
chartify
Chartify Infographics
Chartify showcases interesting facts and statistics through charts, infographics and data visualization. Presented in timeline, mind map, diagram, pie chart and flowchart.
24 posts
Don't wanna be here? Send us removal request.
Last Seen Blogs

healerofthefoxes
Viver a Vida

andejoe
Ande Joe

haunteddreamlandcowboy
Untitled

spiritofrush
V I T A L S I G N S

lesfemsexy2001
reposttgcaption
Photo
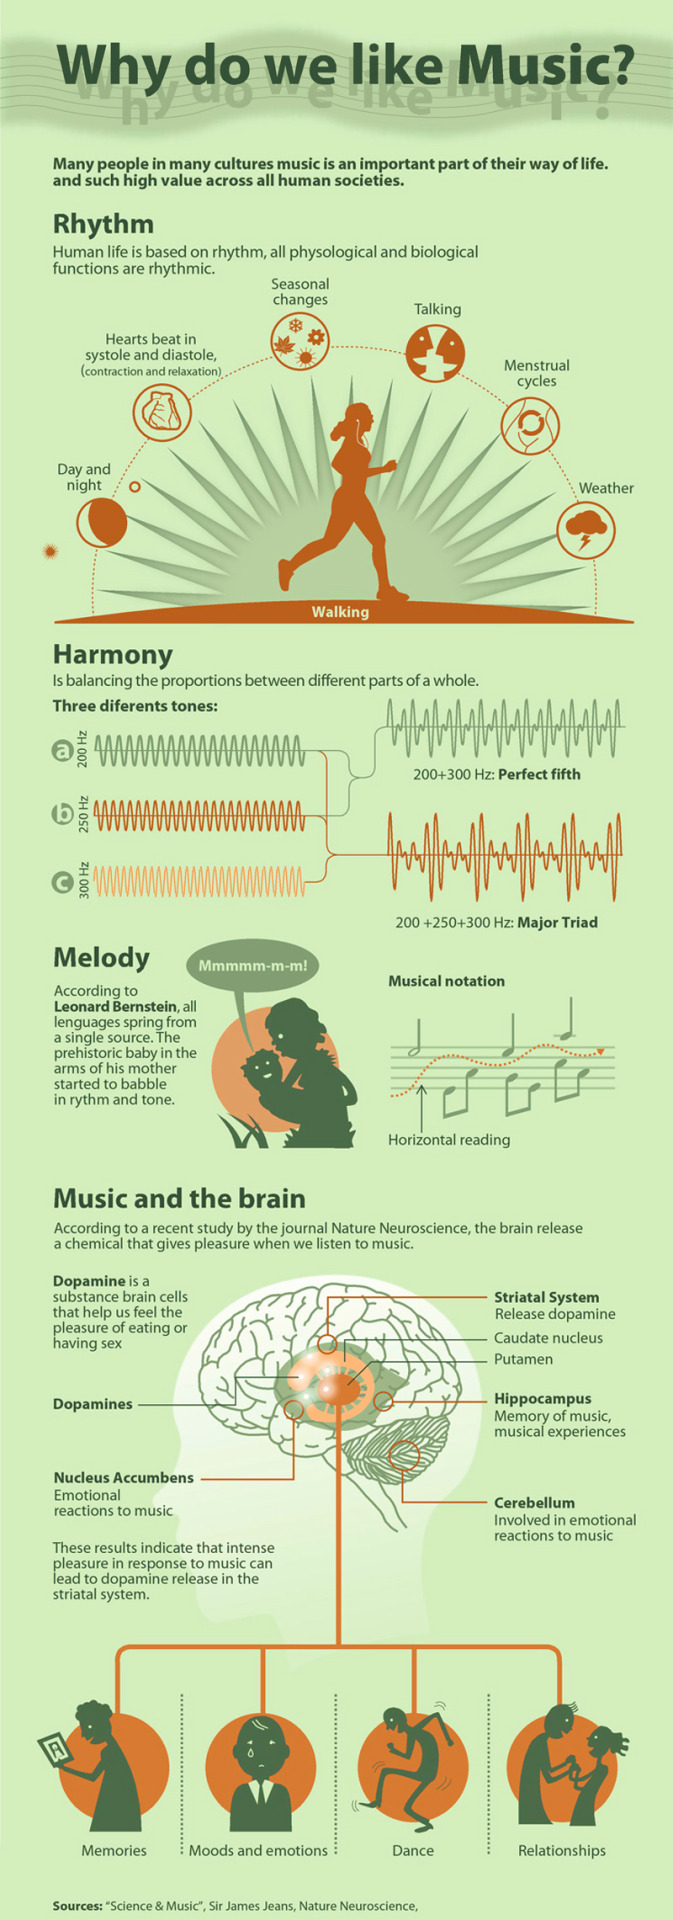
WHY DO WE LIKE MUSIC?
Music is a form of art that is deep and universal. But why do we love listening to songs and musical instrument? This infographic explains why. FB link
#infographic#music#song#pop#singer#infographics#psychology#mp3#artist#apple music#guitar#drums#piano#kpop#bts#taylor swift#adele#rap#rock#hiphop#country music#rnb
16 notes
·
View notes
Photo

NURSING YOUR LUNGS: DON'T SMOKE
Here's a throwback infographic with brilliant design concept —showing the health risk of smoking cigarette. FB link
#infographic#cigarette#smoking#smoker#cancer#lunghealth#lung cancer#infographics#illustration#statistics
3 notes
·
View notes
Photo


MOST PROLIFIC SERIAL KILLER IN EACH STATE OF AMERICA
Check out the most prolific serial killer in each state of America. Based on police and FBI report, their crimes includes kidnapping, torture, robbery and multiple murder. FB link
#infographic#crime#law#police#fbi#infographics#law enforcement#criminal law#criminal case#chart#usa#america#american#murica
3 notes
·
View notes
Photo

ONCE A MOTHER, ALWAYS A MOTHER
Happy Mother's Day! Share your appreciation for your mama and your mama’s mama. The role of being a mom doesn't stop when you became a grandmother. FB link
#infographic#mother's day#single mother#mom#grandmother#infographics#statistics#data#chart#mommy#parenting#gift
2 notes
·
View notes
Photo
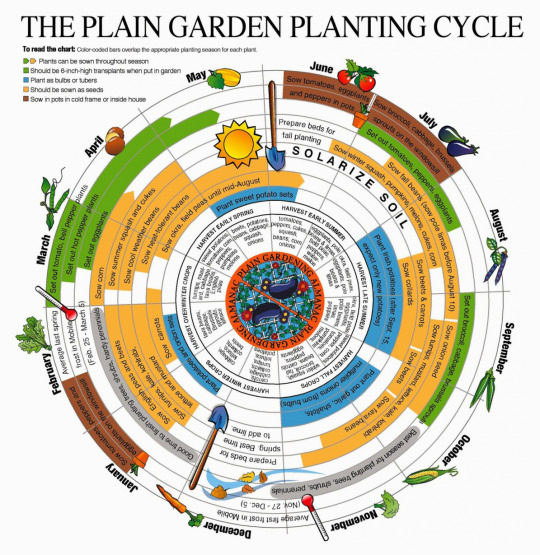
THE PLAIN GARDEN PLANTING CYCLE CHART
This planting calendar guide will help veggie gardeners determine what vegetables to plant in which season or month. FB link
#infographic#gardening#vegan#planting#infographics#chart#guide#vegetable#vegetable garden#veggies#vegetables#plant#plants#garden
3 notes
·
View notes
Photo
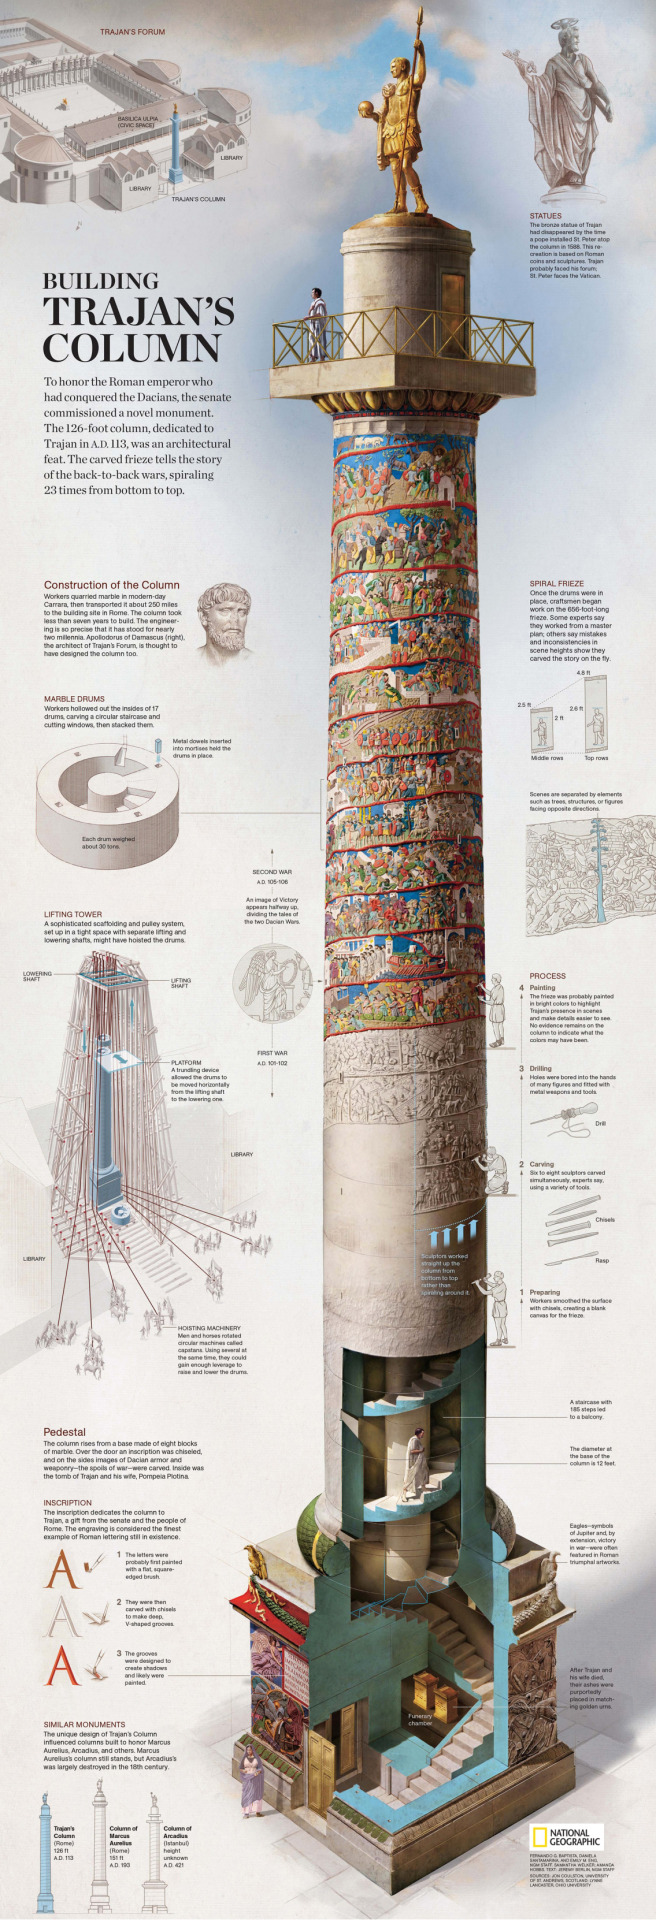
BUILDING THE TRAJAN'S COLUMN
The original Trajan's Column stands at the center of the Roman Forum in Rome. It was built and added sculpted paintings to commemorate Emperor Trajan's two successful campaigns against the Dacians in BCE 101-2 and 105-6. FB link
#infographic#roman#roman empire#romans#history#infographics#illustration#architecture#architect#painting#sculpture#painter
5 notes
·
View notes
Photo
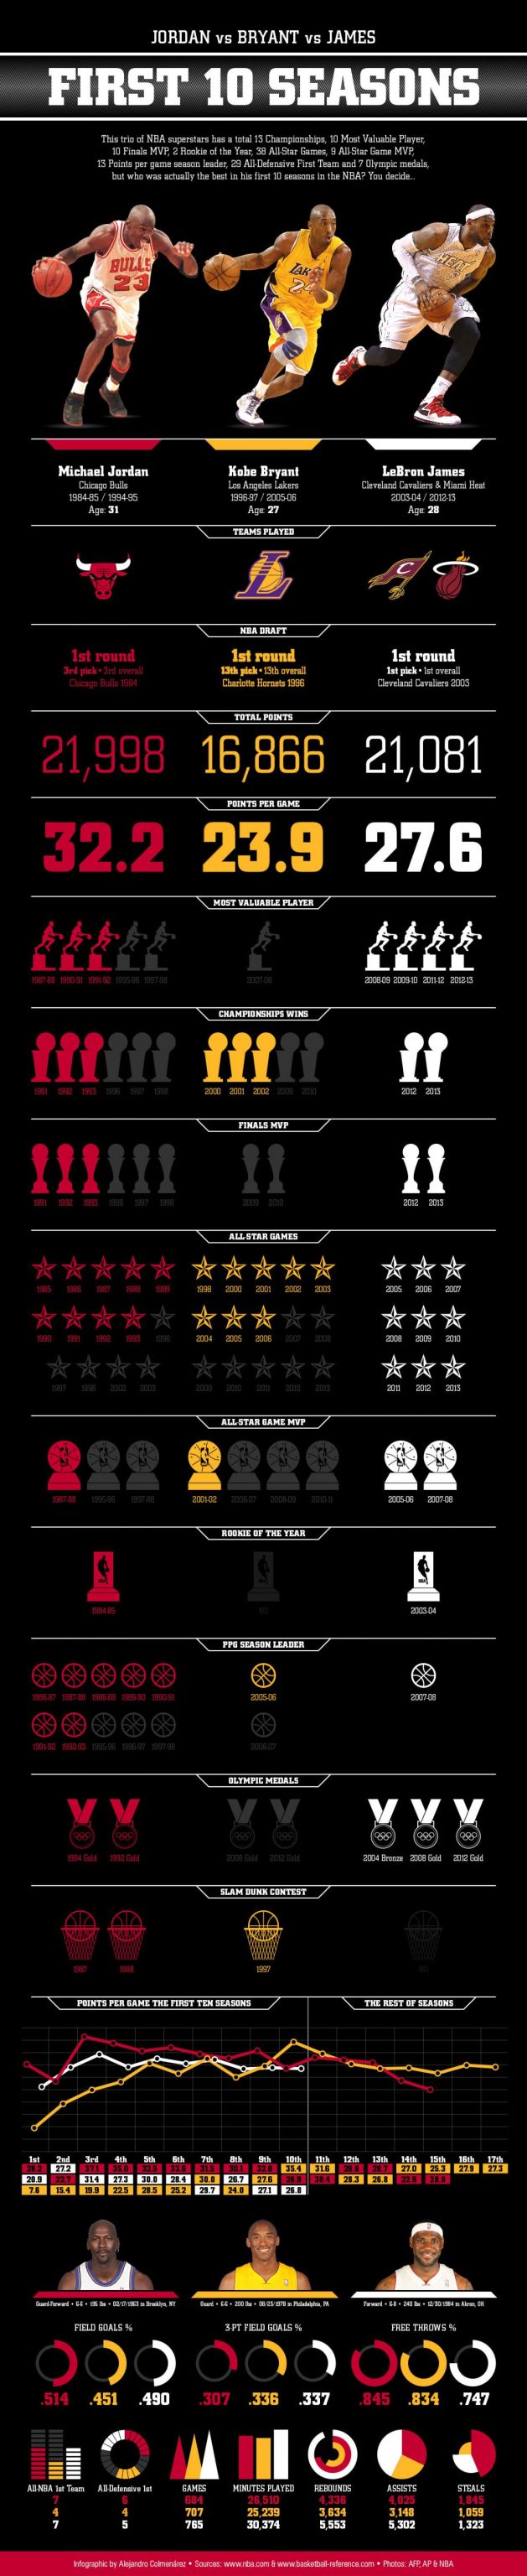
FIRST 10 SEASON: JORDAN VS BRYANT VS JAMES
Comparing the first 10 NBA seasons of Michael Jordan, Kobe Bryant and LeBron James. FB link
#infographic#nba#sports#basketball#infographics#michael jordan#kobe bryant#lebron james#statistics#lakers#chart
2 notes
·
View notes
Photo
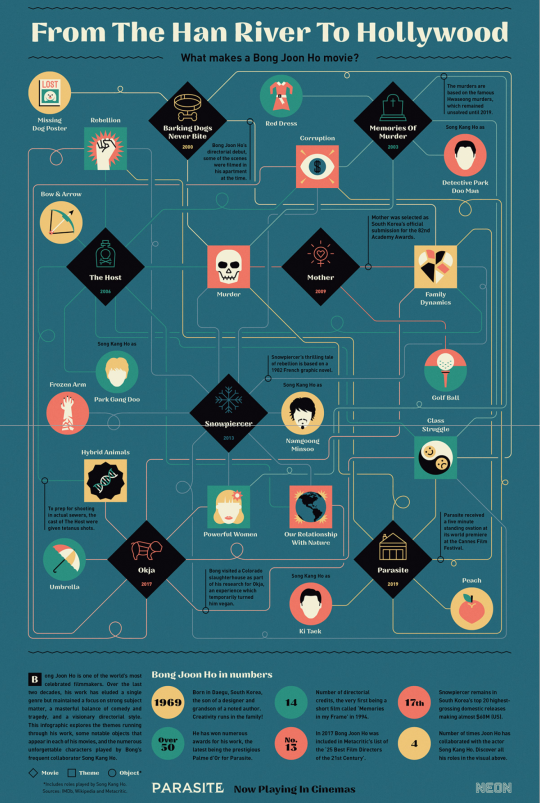
WHAT MAKES A BONG JOON HO MOVIE
Every movie of South Korean director Bong Joon Ho is fantastic in its own way. Parasite is one of his best from his impressive 20-year career that started in 2000. This infographic mindmap reveal his film making formula. FB link
#infographic#movie#parasite#korean#infographics#korean movie#film#directing#film making#mind map#snowpiercer#movies#bong joon ho#director#netflix
1 note
·
View note
Photo
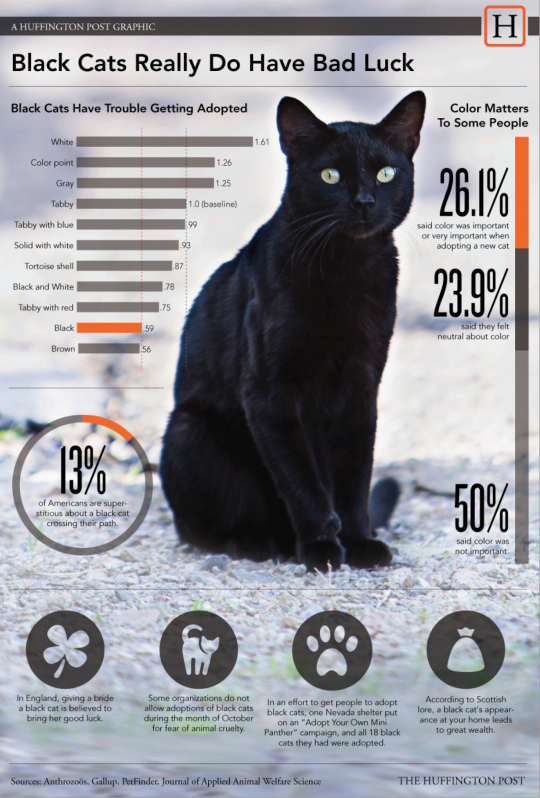
BLACK CATS REALLY DO HAVE BAD LUCK
Happy Caturday! Did you know that black cats experience racism too? That they have such a hard time getting adopted that some shelters offer reduced adoption prices or free spaying and neutering. FB link
#infographic#cat#pet#racism#infographics#blacklivesmatter#animal#animals#peta#adoption#chart#kitten#cats
1 note
·
View note
Text
Amazing Facts About Your Brain

Take a look at these interesting facts about the human brain that will blow your mind. Modern neuroscience have come a long way in understanding the effect our brains have on our function and behavior. FB link
#infographic#neuroscience#science#brain#mind#mental health#facts#illustration#interesting facts#braindamage#infographics
1 note
·
View note
Text
The British Royal Family Tree
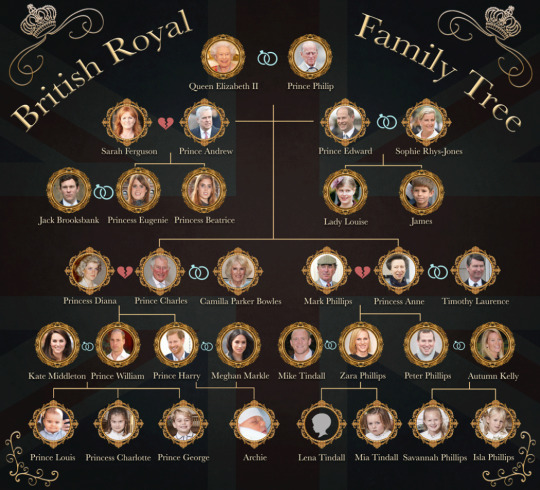
Here's a complete look at the British Royal Family Tree chart. From Her Majesty, Queen Elizabeth II to baby Archie Harrison, son of Prince Harry and Meghan Markle. Made by Melissa Herwitt for E! News. FB link
#infographic#royal family#british#great britain#uk#infographics#chart#guide#history#family tree#her majesty#queen elizabeth 2#queen elizabeth#prince harry#megan markle
1 note
·
View note
Video
Earthquake in sequence as they happened from 1901 to 2000
A data visualization of every recorded earthquake in sequence as they happened from 1901 to 2000. Created by NOAA's Science On a Sphere. FB link
#earthquake#geology#science#dataviz#earthquakes#earth#data visualization#data science#scientist#animation#facts#NASA#infographic#infographics#after shock#tsunami
1 note
·
View note
Text
Emotion Wheel Chart
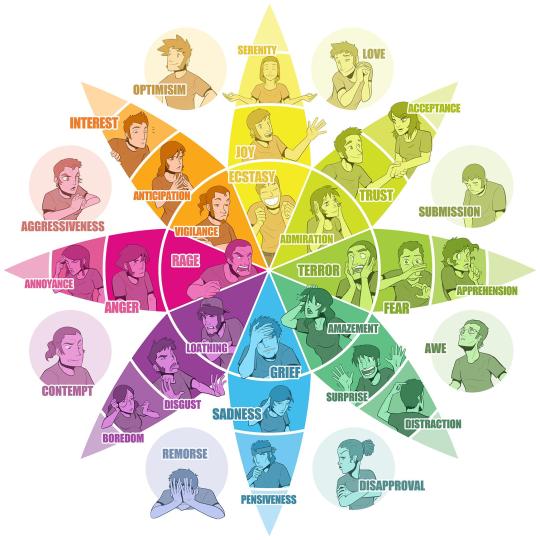
Use the emotion wheel/comic chart to identify your emotions and come to terms to how they are feeling and, ultimately, become more self-aware and self-compassionate. FB link
#psychology#emotion#infographic#comics#art#fridaythoughts#fridayfeeling#infographics#chart#guide#cool#drawing#mood
5 notes
·
View notes
Text
World War 2 Casualties by Country in Map
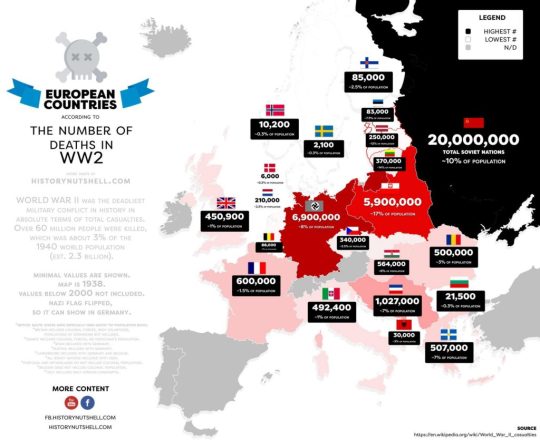
Today we commemorate the 75th anniversary of end of Nazism and WW2 in Europe. FB link
1 note
·
View note
Text
How to Build The Perfect Burger
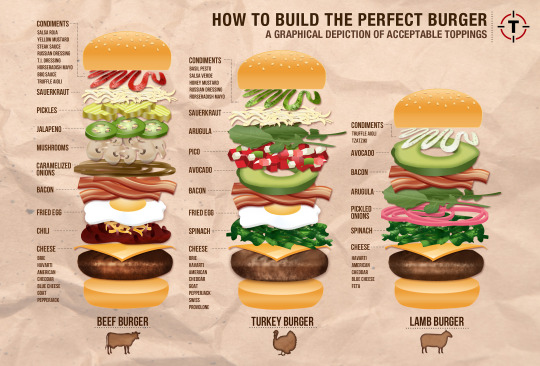
Here's a visual guide of acceptable toppings to build the perfect burger. FB link
#infographic#cooking#burger#recipe#infographics#food#fridayfood#recipes#beef#chicken#eat#restaurant#guide#chart
1 note
·
View note
Text
Visual Periodic Table of Elements by Theodore Gray

The periodic table of elements is probably the most famous infographic in the world. Presented in a concise format, this massive amount of information has been constantly refined and expanded for 2 centuries. FB Link
#science#infographics#chemistry#student#illustration#infographic#chemical#scientist#gold#silver#guide#chart#periodic table
1 note
·
View note
Photo

Here's an infographic of how the Mongol Empire, founded by Genghis Khan in 1206, eventually becomes the biggest empire in world history
5 notes
·
View notes