#GIS Mapping
Text
gis application development in India
BrainFuel with its proven expertise has assisted big brands to develop dynamic and robust GIS web applications and open source GIS mapping software.
0 notes
Text
GIS in Agriculture

GIS helps a large no of farmers with precise and accurate data by using its various tools, which helps farmers to plan accordingly. So visit my blog where I mentioned, various ways that GIS helps farmers all across the globe to increase their farming productivity.
0 notes
Text

The main goal of the forest burn plan is to keep certain regions from burning by monitoring the weather, potential risks, and contacts to make before burning. A forest burn plan is only necessary for defined portions, not every section.
#forest management#forest inventory#carbon#soils carbon#tree planting#forestry#forest inventory washington#GIS mapping
0 notes
Text
How Pole Loading Analysis in GIS Mapping Enhances Structural Integrity in Utility Poles
Utility poles silently support the backbone of our power infrastructure. Ensuring these poles are structurally sound is crucial for a reliable power supply. Here, we'll explore how combining pole loading analysis with GIS (Geographic Information System) mapping can enhance the structural integrity of utility poles, making our power distribution networks more robust and dependable.
The Power of GIS Mapping:
GIS mapping allows us to visualize, analyze, and interpret location-based information. When it comes to utility poles, GIS mapping helps create detailed maps that pinpoint the exact locations of each pole. This spatial awareness is the first step towards effective infrastructure management.
Integrating Pole Loading Analysis:
Pole loading analysis delves into the forces and stresses acting on utility poles, evaluating their load-carrying capacity. Combining this analysis with GIS mapping adds an extra layer of intelligence. By applying Pole Loading Analysis within a GIS framework, we can analyze not just individual poles but the entire network in a spatial context.
Enhancing Structural Integrity through GIS-Mapped Pole Loading Analysis:
Precise Location Identification:
GIS mapping provides accurate coordinates for each utility pole. This precision allows engineers to focus their pole loading analysis on specific geographic areas, ensuring that assessments are localized and tailored to the unique conditions of each location.
Visualizing Load Distribution:
GIS mapping tools enable the visualization of load distribution across the entire power distribution network. Engineers can see which poles are under more stress, helping them identify potential weak points and take accurate measures to reinforce these structures.
Predictive Maintenance Planning:
Combining GIS mapping with pole loading analysis facilitates predictive maintenance planning. By understanding the structural health of each pole and its geographic context, utility companies can schedule maintenance activities more efficiently, reducing downtime and minimizing the impact on power consumers.
Optimizing New Installations:
When expanding or upgrading the power grid, GIS-mapped pole loading analysis assists in optimizing new pole installations. Engineers can use the spatial data to strategically place poles, taking into account existing infrastructure and potential load variations in different areas.
Emergency Response Planning:
In the event of natural disasters or accidents, GIS-mapped pole loading analysis aids in emergency response planning. By knowing the structural status of each pole and its location, utility companies can prioritize repairs and restoration efforts effectively, ensuring a quicker recovery of power services.
Choose Polosoft Technologies for Accurate Pole Loading Analysis
In today’s world, where a reliable and secure power supply is crucial, pole loading analysis is a strong solution. With our precise GIS mapping and other Geospatial data services, Polosoft Technologies offers accurate location data for each pole, allowing tailored analysis in specific areas. Our pole loading analysis service is great for planning maintenance, minimizing downtime, and optimizing activities.
When it comes to new installations, we use spatial data for a strategic approach, adding to overall efficiency. In emergencies, our GIS-mapped analysis helps prioritize repairs for a quick power service recovery. The integration of GIS mapping with pole loading analysis provides an efficient solution for predictive maintenance planning, minimizing downtime, and optimizing maintenance activities. Choose Polosoft as your partner in accurate GIS mapping and pole loading analysis, and take a step towards a future where power distribution is both dependable and resilient.
0 notes
Text
Geoserver: A comprehensive overview of Spatial datasets and web services
GeoServer is open-source software for sharing, processing and creating web services for geospatial data. It plays a vital role in geospatial information systems (GIS) and web mapping applications.
Here's a comprehensive view of Geoserver-
Geospatial Data Support: GeoServer handles diverse geospatial formats, encompassing both vector and raster data.
Web Service Standards: It complies with web service standards like WMS, WFS, WCS, and WMTS, facilitating geospatial data sharing and web visualization.
WMS (Web Map Service): It serves customizable maps (PNG, JPEG) with dynamic rendering based on user requests.
WFS (Web Feature Service): WFS enables querying, retrieval, and editing of geographic features, allowing vector data access and manipulation.
WCS (Web Coverage Service): GeoServer distributes raster data (e.g., GeoTIFF or NetCDF) via WCS, facilitating user access to coverage data.
WMTS (Web Map Tile Service): It supports WMTS for efficient pre-rendered map tiles in a consistent grid, enhancing web mapping application performance.
RESTful Services: Ita offers a RESTful API for developers and custom apps to access geospatial data and services via HTTP requests.
Data Styling and Symbology: Users can customize data layer styles with GeoServer using the flexible Styled Layer Descriptor (SLD) standard.
Security and Access Control: GeoServer secures data and services through access control, supporting authentication and authorization to restrict access to authorized users.
Data Reprojection: GeoServer on-the-fly reprojection serves data in various coordinate reference systems (CRS) to meet client needs
Data Versioning and Publication: GeoServer supports dataset versioning for data integrity and history tracking.
Community and Ecosystem: GeoServer boasts a vibrant user community offering support, docs, and plugins for extended functionality
Scalability: GeoServer is versatile, suiting single servers to distributed setups, effectively managing high data volumes and requests.
Interoperability: GeoServer is compatible with GIS software and can be combined with tools like QGIS, OpenLayers, and Leaflet.
Extensibility: Extensible via plugins and custom code for added functionality and data format support.
GeoServer is a powerful tool for organizations and developers looking to share and publish geospatial data on the web and build web mapping applications.
0 notes
Text
#gsourcetechnologies#architecturedesigns#engineeringdesigns#zoning#lidar technology#gis mapping#landscape architect#architecture#cadservices#lidar
1 note
·
View note
Text
gis smallworld Quality with CGD Safety Delivery
As with most other businesses, digital technology has become a strategic priority for energy companies in 2020. consistent with a recent survey by professional services company Accenture, 97% of upstream and 91% of downstream executives believe that the pace of innovation in their organisation has accelerated over the past three years because of emerging Integrated GIS technology. gis smallworld Oil and gas operators’ proactive embrace of advanced digital solutions, especially geographic information systems (GIS), may be attributed partly to volatile global economic sentiments affecting growth momentum. More and more companies today are focusing their budgets and efforts to enable standardization in workflows and improve productivity to retain their ability to show a profit. And gas distribution retailers are not any different.
Complexities in gis smallworld
Compared to other utilities, a gas distribution network will be extremely complex. If all gas pipelines were laid down in an exceedingly single line, the sprawling infrastructure would circle the world multiple times!
In essence, a gas distribution network is formed from a series of well-looped external pipelines leading from the source to the most gas distribution point, and ultimately to the customer location. These include long-distance trunk lines, street-level distribution pipelines, infeed service lines, entrance gas pipelines, and internal gas pipelines.
Some pipelines are low-pressure, like those meant for residential buildings, while others can be medium- or high-pressure networks, like those designed for industrial plants. Accordingly, valves are installed in readily accessible locations to cut back the time to clean up during emergencies. Other connected assets include pressure regulators further as spring/pilot/weight-loaded relief valves for cover against accidental over-pressurizing. Operators also must maintain regulators and metering stations, odorization devices, automatic shutoff mechanisms, etc.
However, unforeseen challenges like extreme temperatures or unplanned excavations could pose threats to pipelines and hinder distribution companies from providing uninterrupted services. Moreover, gas leakages can happen at many places along the distribution chain for a range of reasons, resulting in a loss in revenue and contributing to temperature change. Which is why the management and maintenance of those overwhelming systems necessitate that distributors keep an intensive inventory of their assets. Federal governments and regulators also require operators to take care of comprehensive plans for operations, maintenance, and emergency response activities.
Managing Gas Distribution Assets with Integrated GIS technology
From a technology standpoint, the best solution for gas distribution networks would balance the necessities for uptime, security, and safety, while seamlessly connecting all systems and hardware platforms to supply operators with one source of truth that fosters quicker and better decision-making. this is often where GIS for gas distribution systems comes in.
A GIS platform allows operators to not only maintain a geo-tagged knowledge bank of their assets and network elements, but it also empowers them to seamlessly integrate this information into the present IT infrastructure. This powerful database can then act as an integral a part of any pipeline integrity management program, providing distribution operators with the tools they have to spot threats, evaluate and prioritize risk, and record and report results. Consider the following…
• Network Planning: except for the various benefits, it offers to the prevailing distribution assets, GIS also can prove strategic for the expansion of the network, allowing companies to grasp if the prevailing pipelines are operating at full capacity or if new pipelines are required. Using tablet devices to assess the GIS software, field technicians can even swiftly compare engineering designs with on-site progress and flag any incorrect positioning of fittings.
• Leak Management: just in case of an emergency, a map of key valve locations is one in every of the primary things an operator would hunt for. supported the leak history, a GIS platform would also help to spot brittle pipes or other materials unsuitable for public utility. And with historical data available at one-click, operators can easily monitor any portions of the system experiencing recurrent leakage more frequently.
• Corrosion Management: There are instances where the system contains non-metallic pipes but includes metallic fittings or connectors that don't seem to be protected against corrosion. In such a scenario, the operator would be able to identify them easily using the GIS platform.
• Risk Identification: Gas distribution companies need to consider both the relative likelihood of an accident occurring and therefore the consequences that may result if it did. So, if there's a district during which more people would be present near the pipeline at the most times, like a retirement centre, that area is marked as a ‘higher consequence region’ on a map for simple visibility.
• One-Call Notifications: Governments and regulatory bodies like Petroleum and gas Regulatory Board (PNGRB) want to deploy an integrated system for One-Call notifications wherein operators will get a method of receiving and recording notifications of all planned excavation activities. When an operator proactively maintains a GIS record of the placement, size, and sort of pipe, together with other critical information like the depth at which the pipeline is buried and which valves have to be closed to isolate the region, a full-scale report of potential impacts of any excavation activity is easily obtained.
• Integrated Enterprise Solution: A GIS software can easily integrate with third-party applications to streamline core business operations and increase general network efficiency. as an example, with the assistance of GIS software, job cards from SAP are often sent on to field workers, and real-time vehicle tracking can validate if workers are navigating to the proper location. GIS data also can be synchronized with hydraulic modelling and simulation software, like Synergi Gas. Similarly, SCADA information may be displayed directly on a map employing a robust GIS solution.
Common Framework for Data Integration gis smallworld
In conclusion, with GIS technologies advancing continually, the oil and gas industry is slated to become rather more modernized within the times to come back. to attain transformative changes in safety and efficiency, an increasing number of distribution companies are turning to a standard framework or data model provided by a single-vendor based system.
0 notes
Text
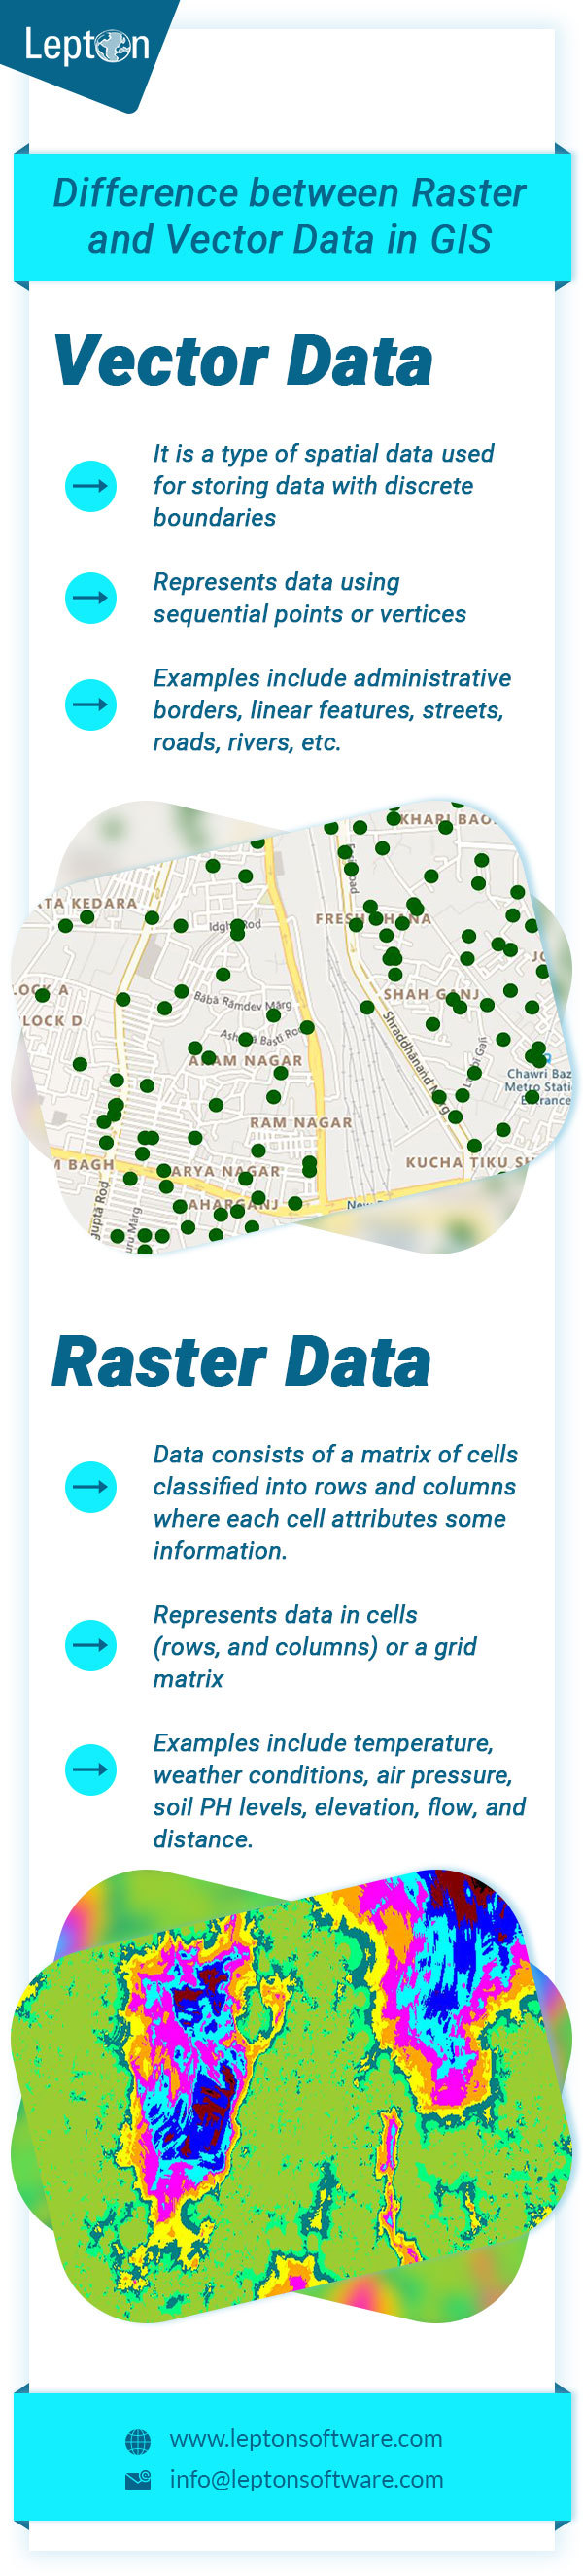
Raster vs Vector Data in GIS
Difference between Vector Data and Raster Data in GIS. Click to know more about best Desktop GIS Mapping Software.
0 notes
Text


FURINA DE FONTAINE !
like / rb & credit if using
#wanted to play around with gradient mapping with this one#furina#furina layouts#genshin impact#gi#genshin layouts#genshin icons#pink#purple#furina de fontaine
107 notes
·
View notes
Text
Lucidpath’s GIS mapping services help businesses to make the most of map data
0 notes
Text
man I love maps I love geography even spatial analysis and shit I think it's neat and can be valuable but sometimes I have sort of a master's tools crisis about it bc like. I'm in this GIS program and oh turns out that classmate's a cop. that other classmate works in national security. that classmate works for the air force. I look for GIS jobs and it's like "would you like to work for the CIA? would you like to work for Homeland Security? how about Consulting Companies A-Z who are also, incidentally, CIA or DHS contractors??" and no, I really would not like that. that's the last thing I would like. is there anyone out there who would pay me to use these skills to not be evil
#gis/gps/all of that came out of the military and yea you can kind of tell#bro i just want to make maps! or even analyze data i guess! but not in order to help the fucking govt kill or police or surveil people#geography things#skravler
32 notes
·
View notes
Link
We envision a world in which forests are fairly valued for the numerous benefits they give to people, economies, and ecosystems. We at global forest resources make it happen through Carbon asset management.
0 notes
Text
Embark on a journey of discovery with GIS Mapping Services, a technological marvel that revolutionizes how we view and analyze geographic data. These services provide a roadmap to navigate and understand our world, offering insights, efficiency, and precision. Join us in exploring uncharted territories through the incredible potential of GIS Mapping Services.
0 notes
Last Seen Blogs

ecfile-123
Untitled

fantasticsharkartisanpalace
Unbetitelt

todayispeia
athropeia

nasudc
Nasu

beatoctopus
Amateur Ideas4Sims