#The State of Innovation
Text
Telling content creators it's wrong to explore artistic freedom and be independently funded by fans, and they should instead continue taking advertisement revenue from google* is
NOT
the anti-capitalism stance actually.
*(Yes, google owns youtube.)
#Watcher#This post is specifically and exclusively about the people who seem to have the capitalism bit wrong#It's almost fascinating how no one is hearing themselves speak#I feel like some of you don't understand WHY we support small businesses and are anti-monopoly#I've seen multiple posts saying “Shane is so anti-capitalism there's no way this was his idea.”#So... you think it's pro-capitalism to start your own business instead of relying on pennies from the exploitative mega-corporation?#Guys... we support small businesses KNOWING it will cost the consumer more#Stop thinking you're entitled to someone's product#That's what got us in this mess#I understand $6 is a lot for many many people but that is what makes certain things a luxury#Nothing used to be this way#Nothing used to be “free” so you can be monitored for your viewing habits and sold to advertisers#If you see a little guy trying to leave youtube/google and you paint them as the capitalist??? You. have. taken. a. wrong. turn.#I don't know how many more ways I can say it#It is better to support someone (if you can) than to pressure them into taking money from the trillion-dollar corporation#so that you can have what they put all their blood/sweat/tears into for free#If you want something badly enough you're going to have to pay for it#Them's the breaks#If you don't want it that badly then maybe it didn't mean enough to you personally#Thinking otherwise is how corporations like youtube take over and squeeze out small competitors#btw on monopolies: having almost every single video content creator (outside of tiktoks and video game streams) on youtube is BAD#You understand that's bad yes?#How tf are we going to diversify unless SOME CREATORS leave youtube???#It's almost the responsibility of larger creators to do so#Ironically what I said is backwards#In its ideal state‚ capitalism is supposed to inspire innovation and new business‚ giving every person a chance to succeed#But I think we all know that's not the reality we're experiencing#I just went with what everyone means when they say it
30 notes
·
View notes
Text

There are many graphics and charts in this story that you might want to view - so click the header and visit the site directly to see them all
The history of Black people’s contributions to the catalog of inventions that marked the Industrial Revolution has been largely muted. This period is considered one of the most innovative eras in world history, seeing the birth of major advances in agriculture, transportation, communications, manufacturing, and electricity that fueled rapid economic growth. With the exception of a few notable inventors who are regularly elevated during Black History Month—e.g., George Washington Carver (peanut products) and Madam C. J. Walker (hair products)—the disregard of many of the era’s Black inventors not only whitewashes the historical record, but biases who we perceive to be innovators in the present.
Using a new database of inventors, this report demonstrates that Black contributions to the Industrial Revolution were influenced by the disproportionate number of Black Americans who lived in the U.S. South in the late 19th and early 20th century, where their opportunities to acquire and apply skills were severely limited by oppressive institutions. Still, Black Americans living outside the South invented nearly as frequently as white Americans, and at rates that would be considered extremely high by historic or global standards of invention even today. We use a novel database created by Sarada, Michael Andrews, and Nicolas Ziebarth that matches inventors listed on patent records in decennial years from 1870 to 1940 to complete census records, which include demographic information for the named inventors.1
The data reveals the following:
From 1870 to 1940, Black people living in the North were eight times more likely to be awarded a patent than Black people living in the South. White people in the North were three times more likely to invent a patented technology than white people in the South, but regional effects were weaker for white people and they were much less concentrated in the South than Black people.
In the North, Black people’s share of patents equaled their share of population. Black people accounted for 1.6% of the North’s population and 1.6% of patents across the decades studied. The rate of patenting per capita among northern Black and white residents was extremely high (0.31 per 1,000 residents for Black people and 0.39 for white people). Both of these rates exceed the U.S. rate of invention for most of the country’s history and approach the highest rates observed around the world today at the country level.2
With 50,000 total patents, Black people accounted for more inventions during this period than immigrants from every country except England and Germany. In our database, 87% of inventions were traced to people born in the United States, and 2.7% of the U.S. total were invented by Black Americans, which is a larger share than nearly every immigrant group. After accounting for patents during nondecennial years, we estimate that Black people accounted for just under 50,000 total patents during this period.
Given the vast differences between the North and South in providing both skill-generating and skill-using opportunities, this historical research points to the importance of linking political equality and social opportunity to innovation and economic growth. It also provides a reassessment and revaluation of the extraordinary contributions of Black people in the development of the United States as well as global technological advancements.
Back to top ⇑
Introduction
In leading theories of economic growth, technology and innovation are the driving forces of long-term gains in living standards.3 Ideas—developed and commercialized—are key to innovation, and economics literature has long recognized that patents offer a valuable measure of invention. Patents were particularly important during the so-called Golden Age of Invention (1870 to 1940), or the second phase of the Industrial Revolution, which was characterized by an unprecedented flowering of economic growth and advances in living standards.4 As historians have documented, people living in the United States contributed disproportionately to this rise.
It is widely believed that Black Americans did not participate in the Industrial Revolution, as suggested by several recently published papers.5 Likewise, contemporary estimates report that Black people are much less likely to become inventors than whites, Asian Americans, and immigrants.
Our estimates for total patents by Black people during the Golden Age of Invention are similar to those previously published. We use the same database as used in Sarada et al., but we emphasize the importance of regional differences and how legal and cultural institutions in the South were particularly harmful to Black people. In this way, we build on the research of economist Lisa Cook, who is the only scholar we know of who has systematically analyzed how Jim Crow laws suppressed invention among Black people.6 We extend her work by using a more comprehensive measure of inventors, one that links patent records to newly released digital data from the U.S. Census Bureau for relevant years during the 1870 to 1940 period.
Our conclusion supports the arguments developed in Jonathan Rothwell’s A Republic of Equals, which concluded that educational achievement, innovation, and entrepreneurship were widespread in the North’s Black community in the decades between the end of slavery and beginning of Jim Crow.7
Back to top ⇑
Methods
This article draws on a more detailed analysis from Jonathan Rothwell and Mike Andrews, recently published as a working academic paper. Interested readers should consult the methods section of that paper and see the discussion for further information.8
Patent records do not record the race of the inventor or other demographic information, other than their name and address. The key benefits of the Sarada, Andrews, and Ziebarth database is that it links these records to census data, unlocking valuable demographic information.
This database is extremely useful for comparing across groups of people and regions to understand where patented inventions came from and who developed the technologies. However, it is not a complete record of every patent developed during the period. Census records are not available for nondecennial years, and while many people identified in the decennial census would also be identified in interdecennial years, the fact that many would have changed addresses complicates direct matching.
Even during decennial years, matching a patent record to a census record is far from guaranteed. State and local geographies often use abbreviations or uncommon spellings. The name of the inventor may be abbreviated or misspelled. Overall, our database accounts for 19% of domestic patents for the relevant years, with nine years of missing data during each decade.
Because of these information gaps, we impute actual domestic utility patents from the U.S. Patent and Trademark Office to groups identified in our database using the group share for the relevant year and geography. For example, we find that 2.7% of all patents went to Black inventors, so a good estimate of the total number of inventions by Black inventors is .027 times the total number of recorded inventions of U.S. residents. In practice, the 2.7% share varies by year, so we assign the nearest decennial year estimate to the years in between to get a more precise estimate. A rule of thumb is that the number of patents observed in our database should be multiplied by 5.4 to account for missing matches, which we have reason to believe are largely random by group. The statistics below are careful to distinguish the estimated actual numbers from the lower numbers derived from the database.
Back to top ⇑
Findings
From 1870 to 1940, Black people living in the North were eight times more likely to be awarded a patent than Black people living in the South. White people in the North were three times more likely to invent a patented technology than white people in the South, but they were much less likely to live in the South than Black people.
White Americans were 4.6 times more likely to patent than Black Americans during the entire period of 1870 to 1940, as other scholars have documented. That rate fluctuated somewhat, but remained fairly constant. A superficial interpretation of this result is that Black Americans faced enduring obstacles throughout the country that resulted in consistently low rates of patenting.
However, underlying this pattern is the fact that during this period, Black Americans were born and raised mostly in the U.S. South, where the institutional environment was radically different with respect to both race and invention. The share of African Americans living in the South went from 90% in 1870 to 77% in 1940. Meanwhile, only one-quarter (26%) of white Americans lived in the South throughout the period. Despite the lopsided share of African Americans living in the South, northern African Americans filed the majority of patents (58% is the average for the entire period), with the North’s patenting share reaching 71% by 1940. Most patents filed by white Americans also came from northern residents (90%), reflecting regional differences in education and industrial concentrations.
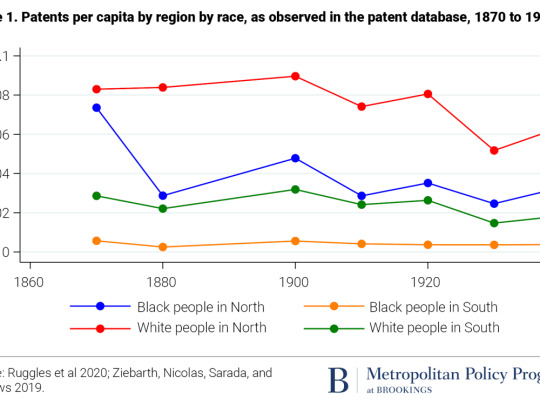
The data suggests these regional institutional differences explain quite a lot. Across the period, Black people living in northern U.S. states were eight times more likely to patent than Black people living in southern states (Figure 1). The regional gap for white inventors is also large, in that northern white people were three times more likely to patent than their southern counterparts—but that is only one-third as strong as the effect on Black invention. A simple interpretation of these facts is that poor social and economic resources (e.g., lack of education, research and development, and industry) limited invention in the South by a factor of three, whereas systemic racism had an even larger effect—albeit only on the Black population. Black people in the North were almost as likely to file a patent as white people in the North, and they were far more likely to patent than white people in the South.
To put in perspective the extraordinary number of patents given to Black people in the North in the decades after the end of slavery, consider that patenting in northern Black communities was equal to white Americans nationally. During this era, the United States was arguably the most inventive place on Earth at what was arguably the most inventive era in world history. This puts northern Black people in the global vanguard of invention in the late 19th and early 20th century.
We also considered what these patenting rates look like by region of birth. This distinction is important in analyzing the causes of different patenting rates by region. A state could be better at providing Black people learning opportunities, practice opportunities, or both. A state that provides only practice opportunities may provide no advantages to people born there, but may be a welcoming destination to highly skilled migrants.
The patenting rates by region of birth are largely consistent with patenting by region of residence. For both races, patenting rates are slightly higher by region of residence, consistent with there being both learning and practice opportunity effects in northern states. Whether using state of birth or residence, the broad regional distinctions are still evident, and the data is clear that northern Black patenting rates were high by either definition.
In the North, Black people’s share of patents equaled their share of population. Black people accounted for 1.6% of the North’s population and 1.6% of patents from 1870 to 1940. The rate of patenting per capita among northern Black and white residents was extremely high (0.31 per 1,000 residents for Black people and 0.39 for white people). Both of these rates exceed the U.S. rate of invention for most of the country’s history, and approach the highest rates observed around the world today at the country level.9
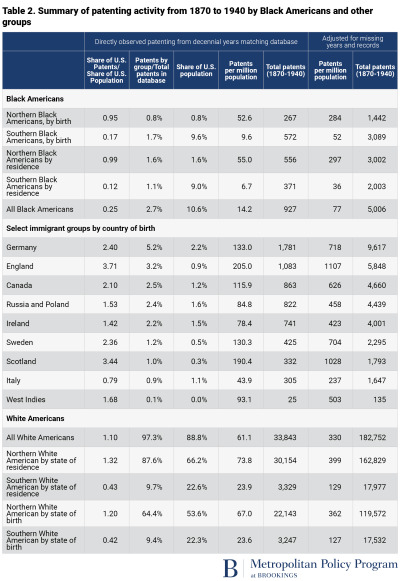
On average, Black patenting rates are lower than white patenting rates in the same state, but there are several notable exceptions (Table 2). In Washington, Maine, Colorado, Pennsylvania, and Indiana, both patenting by residents and patenting by those born in the state are higher for Black people than white people. In Wisconsin, Black patenting rates are roughly the same as white rates for residents, but Black patenting is much higher by birth—suggesting that Wisconsin provided especially advantageous learning opportunities. In New York, Michigan, and Ohio, patenting rates were essentially the same between Black and white people, whether by residence or birth.
In southern states, patenting is almost uniformly lower for white and Black people, but some of the within-race comparisons are instructive. In states with heavy historical slave populations—such as Alabama, South Carolina, Georgia, Mississippi, Texas, and Florida—patenting was much higher for Black people who were born there than patenting by residence. This suggests that these states were especially bad at providing practice opportunities, but many Black people born there achieved inventive success elsewhere after migrating.
Table 1. Patents per million population observed in the patent database by race and state of residence and birth, 1870 to 1940 (cumulative)Black peopleWhite people
State of residenceState of birth State of residenceState of birth
District of Columbia 201.5 140.7 491.6 300.4 Massachusetts 188.3 120.4 222.9 179.9 Washington 151.6 117.9 87.0 33.5 Maine 111.0 413.3 65.0 137.7 New York 100.9 96.7 98.0 97.1 Connecticut 100.6 96.7 293.7 223.9 Colorado 79.7 70.1 71.4 51.1 Delaware 74.7 63.0 174.5 114.3 Pennsylvania 59.1 67.9 49.3 52.5 California 58.7 25.6 84.9 53.7 New Jersey 57.9 57.0 219.3 121.6 Illinois 57.2 39.0 53.4 44.2 Maryland 50.9 51.7 133.0 115.7 Michigan 41.1 40.7 48.0 45.5 Ohio 36.4 46.4 45.5 50.9 Wisconsin 34.8 77.4 38.6 39.9 Indiana 30.4 45.7 26.8 36.3 Kansas 19.6 19.6 12.9 35.6 Utah 14.8 513.1 84.9 58.2 Minnesota 14.7 10.1 28.9 31.9 Missouri 13.2 13.5 24.5 29.2 Iowa 9.5 102.9 16.2 28.5 Oregon 7.5 16.1 81.3 49.0 Tennessee 6.5 11.8 11.8 14.2 Florida 6.3 8.3 29.5 23.3 Louisiana 6.1 5.8 25.9 23.7 Oklahoma 5.8 9.7 17.1 11.6 Kentucky 4.5 9.2 10.4 19.0 Alabama 2.8 5.3 10.3 13.2 Texas 1.9 2.4 7.6 9.4 South Carolina 1.6 6.1 15.4 21.0 Mississippi 1.4 4.8 8.9 11.4 Georgia 1.0 4.7 7.6 13.9 Arkansas 1.0 2.4 6.1 7.8 North Carolina 0.4 5.2 7.0 12.9 New Hampshire 0.0 501.4 78.4 184.9 Vermont 0.0 158.2 88.5 147.4 Nebraska 0.0 25.9 12.2 26.4 Idaho 0.0 0.0 42.1 19.9 North Dakota 0.0 0.0 19.0 20.0 Arizona 0.0 0.0 34.0 44.7 South Dakota 0.0 0.0 15.3 23.8 Wyoming 0.0 22.9 43.8 47.1 New Mexico 0.0 0.0 19.6 14.2 Nevada 0.0 0.0 73.5 79.6 West Virginia 0.0 7.8 1.1 13.1 Hawaii 0.0 0.0 18.3 23.8 Montana 0.0 0.0 0.0 36.7 Rhode Island 0.0 40.7 0.0 65.1 Virginia 0.0 20.9 0.0 31.5 Alaska 0.0 0.0 0.0 1097.7
To put these numbers in perspective, we can compare them to contemporary patent rates in America’s most prolific innovation hubs. To do so, we multiple by 5.4 to account for missing records. From 2007 to 2011, there were 296 patents granted per million residents of U.S. metropolitan areas, according to previous Brookings research.10 From 1870 to 1940, adjusted Black patenting rates exceeded 300 per million in 12 states.
Compared to other states and territories, Black residents of Washington, D.C. had the highest rate of patenting during this golden age, with 1,088 patents per million Black residents, after adjusting for missing data. This rate is roughly equal to contemporary San Francisco and Seattle, though somewhat lower than contemporary San Jose, Calif. In recent years (2007 to 2011), only 16 metropolitan areas exceeded the rate of patenting reached by Black residents in Washington, D.C. from 1870 to 1940.
Other Brookings research allows us to put this in an international perspective. We estimate that northern Black Americans had a rate of 300 patents per million residents, after adjusting for missing records. Japan was the only country in the world to patent at a higher rate from 2010 to 2012.11
With 50,000 total patents, Black people accounted for more inventions during this period than immigrants from every country except England and Germany. In our database, 87% of inventions were traced to people born in the United States, and 2.7% were invented by Black Americans—a larger share than nearly every immigrant group. After accounting for patents during nondecennial years, we estimate that Black people accounted for just under 50,000 total patents during this period.
It is widely known that immigrants to the United States contributed disproportionately to entrepreneurship and innovation, and continue to do so today. Yet it is also the case that during the Golden Age of Invention, most inventions (87%) came from people born in the United States. Black people were among the most important contributors to this, accounting for more patents than immigrants from any country except Germany and England.
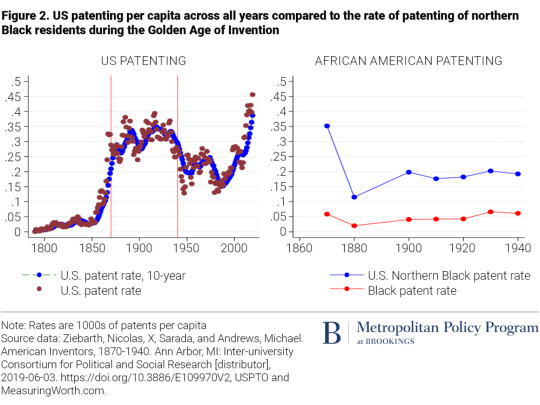
To understand the rate of patenting by northern Black Americans during this period, we compare it to the average rate of patenting throughout U.S. history. A few observations stand out (Figure 2).
First, the Golden Age truly was remarkable for its rate of innovation. No other time in the 19th or 20th century saw rates of patenting matched by the period from 1870 to 1940. In the late 20th and early 21st century, the introduction of software patents has contributed to the increase in patenting, along with much higher rates of postsecondary education and research and development spending per capita.12 Second, Black patenting by northern residents during this period should be considered extremely high relative to the national rate at any time in U.S. history. Simply put, from the period after the end of the Civil War to start of World War II, northern Black people were among the most inventive people in world history.
Back to top ⇑
Discussion
Perhaps the earliest and most ambitious attempt to measure the contribution of Black people to U.S. invention was made by Henry Baker, who worked at the U.S. Patent Office. In 1913, he surveyed approximately 8,000 registered patent attorneys, found 1,200 inventions attributed to people of African American ancestry, and was able to confirm 800 of them.13 He emphasized that this was a large undercount, as attorneys reported failing to recall the names or inventions of some of their Black clients. Our database suggests that Black people were producing roughly 800 patents per year during the decade of Baker’s work.
“We can never know the whole story,” Baker wrote in a 1913 pamphlet. “But we know enough to feel sure that if others knew the story even as we ourselves know it, it would present us in a somewhat different light to the judgment of our fellow men, and, perhaps, make for us a position of new importance in the industrial activities of our country.”
In this spirit, we follow Baker’s lead and describe some of the Black inventors who shaped the history of technology:
Lewis Latimer was born in Massachusetts in 1848 to escaped former slaves. He became a leading electronics engineer, making technical drawings for Alexander Graham Bell, contributing to the development of telephones, and later working for Thomas Edison on improvements to lighting.14
Elijah McCoy was also the son of African American parents who escaped slavery. He was born in Canada but raised in Michigan, before being sent to study in Scotland at age 15. McCoy was denied work as an engineer based on his race, and had to settle for work as a railway technician. In that context, he developed and patented an automated system for wheel lubrication, greatly improving the efficiency of train travel. He went on to have a lengthy career as an inventor.15
Granville Woods was another influential Black inventor of the era, born in Ohio in 1856. He made fundamental innovations to railways, especially in the form of communication systems and the distribution of electricity to the rail cars.16
Sarah Boone invented the ironing board, winning a patent in 1892. She was raised in New Haven, Conn. by African American parents who escaped from slavery in North Carolina through the Underground Railroad.17
Despite living and working in the North, these and other Black inventors, entrepreneurs, and workers of all kinds faced discrimination and professional and financial barriers that white people did not.18 Obtaining a patent was more difficult for Black people, because it often involved working with a white lawyer who may be tempted to engage in unfair dealings. These obstacles, no doubt, suppressed the wealth, fame, and influence of Black inventors—and yet, many succeeded in making important contributions to American technological and economic development. What is striking is that even while lacking complete liberty, Black people in the North acquired and practiced cutting-edge creativity, science, and technical skills at very high rates for a substantial period of U.S. history.
Several important institutions changed in the North that help explain why opportunities for Black advancement seem to have stalled and even reversed after the Golden Age of Invention. The 1920s saw the birth of zoning laws and other government-backed institutions that closed off real estate markets to Black people, leading to rapid increases in racial segregation which did not reach their peak until the 1970s.19 With racial segregation made either an explicit goal or viewed as an unavoidable side effect, governments around the country fostered segregation and corralled Black people into areas that were targeted for disinvestment in important public resources, including education.20 Meanwhile, powerful professional associations—including the American Bar Association and American Medical Association—gained prominence in the early 20th century and used their emerging power, in part, to officially discriminate against Black people for decades.
Throughout northern states, the Golden Age of Invention in America provided a tantalizing glimpse into what Black people could accomplish if given robust opportunities to learn and practice in highly skilled fields. These accomplishments negated the assumption—once held by many in America—that Black people cannot thrive just as well as any other group at the most challenging cognitive activities. National leaders should apply this historical lesson to today’s institutional landscape, and seek out and eliminate barriers to the full participation of Black people in American life.
#Black Innovators#Black Inventors#Black Industrial Revolution#The Black innovators who elevated the United States: Reassessing the Golden Age of Invention
14 notes
·
View notes
Text

Advancing Understanding: Significance of Research Contributions
Hejir Rashidzadeh's commitment to research fosters innovation while also expanding our understanding. His art defies convention and encourages people to explore previously uncharted territory. By his contributions, Hejir raises the bar for research quality and makes a lasting impact on both academia and society at large.
2 notes
·
View notes
Text
9 Surprising Facts About St. Patrick’s Day
Who Was the Real St. Patrick? Was That Legend About the Snakes True? And Why Did So Many St. Patrick's Day Traditions Start in America?
— By History .Com Editors | March 7, 2024

Photograph By Anna Usova/Getty Images
While St. Patrick’s Day is now associated with wearing green, parades (when they're not canceled) and beer, the holiday is grounded in history that dates back more than 1,500 years. The earliest known celebrations were held in the 17th century on March 17, marking the anniversary of the death of St. Patrick in the 5th century. Learn more about the holiday’s history and how it evolved into the event it is today.
1. The Real St. Patrick Was Born in Britain
Much of what is known about St. Patrick's life has been interwoven with folklore and legend. Historians generally believe that St. Patrick, the patron saint of Ireland, was born in Britain (not Ireland) near the end of the 4th century. At age 16 he was kidnapped by Irish raiders and sold as a slave to a Celtic priest in the area now known as Northern Ireland. After toiling for six years as a shepherd, he escaped back to Britain. He eventually returned to Ireland as a Christian missionary.
2. St. Patrick Was Never Canonized
Despite his status as a patron saint, St. Patrick was never actually canonized by the Church during his lifetime. This was primarily because such a process did not exist when he died in A.D. 461. It wasn’t until 993 that St. Ulrich of Augsburg became the first saint to be formally canonized, and it was not until the 12th century that the Church established an official canonization process overseen by the Pope. While St. Patrick has not been formally canonized, many consider him to hold saintly status.
3. There Were No Snakes Around for St. Patrick to Banish from Ireland
Among the legends associated with St. Patrick is that he stood atop an Irish hillside and banished snakes from Ireland—prompting all serpents to slither away into the sea. In fact, research suggests snakes never occupied the Emerald Isle in the first place. There are no signs of snakes in the country’s fossil record. And water has surrounded Ireland since the last glacial period. Before that, the region was covered in ice and would have been too cold for the reptiles.
4. Leprechauns Are Likely Based on Celtic Fairies
The red-haired, green-clothed Leprechaun is commonly associated with St. Patrick’s Day. The original Irish name for these figures of folklore is “lobaircin,” meaning “small-bodied fellow.” Belief in leprechauns likely stems from Celtic belief in fairies— tiny men and women who could use their magical powers to serve good or evil. In Celtic folktales, leprechauns were cranky souls, responsible for mending the shoes of the other fairies.
5. The Shamrock Was Considered a Sacred Plant
The shamrock, a three-leaf clover, has been associated with Ireland for centuries. It was called the “seamroy” by the Celts and was considered a sacred plant that symbolized the arrival of spring. According to legend, St. Patrick used the plant as a visual guide when explaining the Holy Trinity. By the 17th century, the shamrock had become a symbol of emerging Irish nationalism.
6. Ireland’s Only Female Patron Saint, Brigid, Has Her Own Holiday
One of Ireland’s three patron saints, alongside St. Patrick and St. Columcille, St. Brigid (or Bridget) is the patron saint of Irish nuns, newborns, midwives, dairy maids and cattle. Believed to have been born in Ireland sometime around A.D. 450, Brigid was the daughter of a pagan king and an enslaved woman. She grew up to serve the church by building a church in Kildare, which was the site of a former shrine to the Celtic goddess, eponymous to her.
Said to have died in A.D. 524, Brigid's memory was kept alive by the church, which canonized her as St. Brigid. In 2023, Ireland designated February 1 a permanent public holiday in Brigid’s honor.
7. The First St. Patrick’s Day Parade Was Held in America
While people in Ireland had celebrated St. Patrick since the 1600s, the tradition of a St. Patrick’s Day parade began in America and actually predates the founding of the United States.
Records show that a St. Patrick’s Day parade was held on March 17, 1601, in a Spanish colony in what is now St. Augustine, Florida. The parade and a St. Patrick’s Day celebration a year earlier were organized by the Spanish Colony's Irish vicar Ricardo Artur. More than a century later, homesick Irish soldiers serving in the English military marched in Boston in 1737 and in New York City on March 17. Enthusiasm for the St. Patrick’s Day parades in New York City, Boston and other early American cities only grew from there. In 2020 and 2021, parades throughout the country, including in New York City and Boston, were canceled or postponed for the first time in decades due to the outbreak of the COVID-19 virus. They returned in 2022.
8. The Irish Were Once Scorned in America
While Irish Americans are now proud to showcase their heritage, the Irish were not always celebrated by fellow Americans. Beginning in 1845, a devastating potato blight caused widespread hunger throughout Ireland. While approximately 1 million perished, another 2 million abandoned their land in the largest-single population movement of the 19th century. Most of the exiles—nearly a quarter of the Irish nation—came to the shores of the United States. Once they arrived, the Irish refugees were looked down upon as disease-ridden, unskilled and a drain on welfare budgets.
9. Corned Beef and Cabbage Was an American Innovation
The meal that became a St. Patrick’s Day staple across the country—corned beef and cabbage—was an American innovation. While ham and cabbage were eaten in Ireland, corned beef offered a cheaper substitute for impoverished immigrants. Irish Americans living in the slums of lower Manhattan in the late 19th century and early 20th purchased leftover corned beef from ships returning from the tea trade in China. The Irish would boil the beef three times—the last time with cabbage—to remove some of the brine.
#History.Com#St. Patrick’s Day#Nine Surprising Facts#Patrick's Day Traditions | America 🇺🇸#The Real St. Patrick | Born in Britain 🇬🇧#St. Patrick | Never Canonized#No Snakes 🐍 | Ireland 🇮🇪#Leprechauns | Celtic Fairies 🧚 🧚♂️ 🧚♀️#Shamrock ☘️ | Sacred Plant 🌱 🪴#St. Patrick’s Day Parade | March 17 1601 | United States 🇺🇸#Corned Beef 🥩 | Cabbage 🥬 | American 🇺🇸 Innovation
2 notes
·
View notes
Text
California Gov. Gavin Newsom (D) said on Wednesday that “education is under assault,” criticizing the banning of books across the country, efforts to suppress speech and “the othering of our students, teachers, parents.”
“I do believe education is under assault in ways that I’ve never experienced in my lifetime. I really believe that. I thought it was bad back in the day when folks were debating the merits or demerits around vouchers,” Newsom said while giving remarks at the National Forum on Education Policy after receiving the Frank Newman Award for State Innovation from the Education Commission of the States.
“You know, back in the good old days, in the ’90s, the black and white movie days, and people have different opinions about something called ‘charter schools,’” he mused. “But what’s happening now? Banning books, suppressing speech, the othering of our students, teachers, parents? It’s alarming.”
He slammed Florida, for example, after its Department of Education in April rejected dozens of math books, citing alleged references to or the inclusion of critical race theory (CRT) and social emotional learning (SEL) in them.
CRT, which is generally taught in institutions of higher education, is a decades-old theory that asserts that racism is woven into U.S. laws, institutions and history.
SEL programming aims to help students manage their emotions, develop and manage health identities and relationships and make responsible decisions, among other goals.
Newsom also slammed Texas for cutting hundreds of millions of dollars in mental health funding after Texas Gov. Greg Abbott (R) earlier this year redirected more than $200 million from the state’s Health and Human Services Commission, which oversees Texas’s mental health services, toward his border security initiative.
“But what about the whole person? What about the wellness of our kids? Everybody’s talking a good game now about mental health,” Newsom said.
“There’s one large state, Texas, where they cut mental health funding by $211 million. You know why I’m up here? Because we just expanded mental health by $4.7 billion in our public education system in the state of California.”
Newsom has been considered a possible 2024 Democratic presidential contender, though the California governor said in an interview last year that a presidential bid has “literally 100 percent never been on my radar.”
#us politics#news#the hill#2022#gov. gavin newsom#education#education reform#National Forum on Education Policy#Frank Newman Award for State Innovation#Education Commission of the States#Department of Education#crt#critical race theory#sel#social emotional learning#Health and Human Services Commission#gov. greg abbott#california#texas#book burning#book bans#freedom of speech
26 notes
·
View notes
Text
FISKER DELIVERS FIRST 22 FISKER OCEAN SUVS, Establishing Presence in Competitive EV Market
Fisker Inc. achieves a major milestone by delivering the highly anticipated Fisker Ocean SUV to customers in the United States. Explore the groundbreaking features, sustainability, and investment potential of Fisker in the rapidly growing electric vehicle sector

Fisker Ocean SUV:
Innovation and Unmatched Features: The Fisker Ocean SUV represents a groundbreaking leap in automotive innovation. Designed to offer a sustainable and luxurious driving experience, it is equipped with cutting-edge features and impressive performance capabilities. Boasting a class-leading range of up to 360 miles, it surpasses other electric SUVs in its category. The SUV's all-wheel drive system and dual-motor setup deliver exceptional power and acceleration, providing a thrilling driving experience that surpasses traditional internal combustion
Read More
Other Topics Read:
10 Small Investment Ideas: Building Wealth
Stocks on Wall Street Show Resilience
South Korea Retains Position in MSCI Emerging Markets Index
Mastering the 5 EMA: A Powerful Indicator for Analyzing Price Trends
#Fisker #ElectricVehicles #Sustainability #Innovation #CustomerSatisfaction #InvestmentOpportunity #FuturePlans #Expansion #EVMarket
#: Fisker#electric vehicle manufacturer#Fisker Ocean SUV#innovation#sustainability#customer satisfaction#investment opportunity#strategic partnerships#global expansion#leadership team#market conditions#stock performance#Fisker Inc. achieves significant milestone by delivering the highly anticipated Fisker Ocean SUV to customers in the United States#Fisker Ocean SUV: A groundbreaking leap in automotive innovation and sustainability#Fisker Ocean SUV surpasses competitors with its class-leading range of up to 360 miles#Positive customer feedback solidifies Fisker's reputation as a forward-thinking electric vehicle manufacturer#Fisker's commitment to sustainability and eco-friendly materials reduces carbon footprint#Investment opportunity in Fisker as demand for electric SUVs continues to rise#Strategic partnerships strengthen Fisker's position in the competitive electric vehicle market#Fisker's expansion plans include ramping up production capacity and targeting international markets#Fisker's success in delivering the first 22 Fisker Ocean SUVs showcases innovation#and customer satisfaction#Fisker presents an exciting investment opportunity in the rapidly growing electric vehicle sector
2 notes
·
View notes
Photo

Minecraft Paint Your Own Figurines Set
This craft set was released in the United States by Innovative Designs. It was released as merchandise for Minecraft.
2 notes
·
View notes
Text
barbara forgetting to put her shoes on in the abbott ep last night may be hands down the best gag of the whole season
#also sorry for being a hater but that is not really regional educational conferences work 😭#they are NOT going to comp you a hotel room for that shit#your ass is driving home#i know it’s the point and the joke but barbara and melissa’s behavior was so unprofessional and inconsistent with their characterization#i’ll let it slide only because it is a regional conference#but if they had to travel out of state and acted like that… 🔪#i don’t like how they toggle back and forth on barbara#does she know everything or does she still have much to learn#can she only learn from her younger peers or can she also learn from establishment forces like educational conferences and tech innovations#as someone pretty ensconced in academia the idea of her and melissa phoning it in at the conference#or like being proven right for refusing innovations like new tech and juice with more nutrients and less sugar#is pretty irritating to me#Juice in particular. like. nope barbara was wrong on that one. i refuse to believe the juice change would’ve caused a sea change#in bathroom usage that dramatically#and like i know it’s just jokes but >:(#anyway back to my point#as a burgeoning academic the idea that it’s acceptable for established teachers not to keep up with the literature in the educational field#is upsetting to me#that’s precisely what conferences are for…#and i would think it’s#more important for teachers than Academics TM because they probably don’t have the time to comb through the latest peer-reviewed articles
4 notes
·
View notes
Text
100 Gecs Releases Playful New Video For “Most Wanted Person In the United States”

https://music.mxdwn.com/2023/05/15/news/100-gecs-releases-playful-new-video-for-most-wanted-person-in-the-united-states/
2 notes
·
View notes
Text
comics storylines involving possible futures: 99% chance of the worlds most out of field and/or worst heterosexual romantic pairing. 1% chance of gay exes implications
#esha.txt#im still thinking about future state stephcass. that was INNOVATIVE i love when WOMEN are MESSY#just read titans of tomorrow though lol#you know i really admire how in every single comic tim’s in he makes it a point to say that he does not want to be batman. really makes you#wonder about those people who voted him to take over as batman.#i like him……..
6 notes
·
View notes
Text
Idk how accurate this is but Howliday Draculaura might be up on Amazon pretty soon

Tapping the link leads to the “something went wrong” page but if the date is accurate that’s only a couple days
Edit: I’m Canadian so the listed price is for Canadian Amazon, she should be a bit cheaper in the US ($40 is the rumoured price I believe) so don’t let that panic you!!!
#Monster High#Sorry if anyone else has found/mentioned this#I haven’t been in the tags in a while#Canadian prices are wild if you look at a conversion thing a $40 usd product should only be $55 cad#but we get an extra $7 or $8 on top of that#you could maybe blame shipping from the states to Canada but all the dolls come from china and I know Mattel has warehouses in Canada so#the skulltimate secrets/innovation dolls are also $62 something Canadian
8 notes
·
View notes
Video
#MacDill Air Force Base#University of South Florida#125th Fighter Wing#927th Air Refueling Squadron#Innovation#Engineering#Tampa#Florida#United States#flickr
4 notes
·
View notes
Text
ALSO I GOT UTK2 FOR CHRISTMAS FROM MY MOM!!!!!!!! i hate the inflation of prices for ds games tho like she said it was $100 and it didn’t even come in the box like there’s no way it’s THAT obscure and “rare” or whatever ://// BUT I WILL TREASURE IT SO SO SO SO MUCH AND PLAY IT A LOT!!!!!!!!!
#maru.txt#idk why are they trying to push that ds consoles are vintage#they aren’t#it’s just a tactic to inflate pricing which sucks bc even current games are way expensive#and it’s not like!!!! they’re paying devs well!!!!!!!#state of gaming is kinda dystopian just like everything with technology rn#we have passed the point of innovation and are now being repackaged falsified nostalgia
2 notes
·
View notes
Video
youtube
Battery: Solid State Battery Concept
#Materials Science#Science#Batteries#Solid state batteries#Materials processing#Video#Innovations in Manufacturing at Oak Ridge National Laboratory
12 notes
·
View notes
Text

MISFIT MIXTAPE II
THIS HALLOWEEN 10.31.22
4 SONG EP NOTHING CRAZY BUT I WANT TO STAY CONSISTENT
L🖤VE
#soundcloud#cozy#raakshas#underground#alternative rap#arcade#bars#hip hop#music#rap#misfit#misfit mixtape#number 2#sequel#production#album soon#Colorado#grand Junction#box state#innovators#instagram#Halloween#cozyboys#get at me#space invaders#stressed#alternative#cypher#mauve lout#garage band
5 notes
·
View notes
Text

Breaking Boundaries: The Visionary Approach of Hejir Rashidzadeh
Hejir Rashidzadeh, is a trailblazer in innovation and technology. With a relentless drive to explore new horizons and a commitment to out-of-the-box thinking, Hejir is redefining the future of electrical engineering, autonomous vehicles, and law. Embark on a transformative journey with Hejir and witness the power of innovation in action.
1 note
·
View note
Last Seen Blogs

touristsns
TOURISTSNS TOPICS

velvet1997
Velvet

shinymittens
Who Doesn't Love Puppies

technology-guide-rahul
Techology Guide

livesofthenextgen
MOVED TO @KVNDREIL