#coursera
Photo


I found this slideshow on Linked In and thought it was worth sharing here. Does anyone have any opinions on any of these resources? I use Duolingo and I like it.
#eLearning#online learning#free learning#learning#autodidact#self motivated#motivation#ben meer#duolingo#coursera#navalmanack#stanford ecorner#untools#instructables#open library
247 notes
·
View notes
Text
Top Data Science Courses With Certificate ⬇️
1-IBM Data Science Professional Certificate
https://imp.i384100.net/YgYndj
2-Google Data Analytics Professional Certificate
https://imp.i384100.net/x9jAxk
3-Google Data Analytics Professional Certificate
https://imp.i384100.net/x9jAxk
4-Introduction to Data Science Specialization
https://imp.i384100.net/Ryqyry
5-Applied Data Science with Python Specialization
https://imp.i384100.net/GjkEPn
6-Google Advanced Data Analytics Professional Certificate
https://imp.i384100.net/1r5E3B
7-What is Data Science?
https://imp.i384100.net/JzmRaN
8-Data Science Specialization
https://imp.i384100.net/BX9BmB
9-Python for Data Science, AI & Development
https://imp.i384100.net/g1ARWv
10-Foundations of Data Science
https://imp.i384100.net/nL2Wza
11-IBM Data Analyst Professional Certificate
https://imp.i384100.net/jWGKxa
12-Machine Learning Specialization
https://imp.i384100.net/k0gLAV
#courses#coursera#google#data analytics#jobs#dataanalytics#dataanalysis#data science#data analyst jobs#data analysis#datascientist#machine learning#free courses#courses with certification#online courses
13 notes
·
View notes
Text
adding more work for myself // hopefully it'll boost the SNHU classes ahead //
3 notes
·
View notes
Text
learning chinese: day one
NOT PROFESSIONAL! NOTES ARE TO HELP ME LEARN!
CONTENTS
basic chinese characters
learning about pinyin
pronounciations of initials (consonants only)
tone contours
greeting, asking for ones name + telling your own
¹BASIC CHINESE CHARACTERS
口 kǒu
耳 ěr
目 mù
日 rì
月 yuè
火 huǒ
羊 yáng
鸟 niǎo
免 tù
木 nù
禾 hé
竹 zhú
²PINYIN represents pronounciation of each character,
26 English letters, "v" used for foreign
names, rest (25) used for characters
_consonants
b [p] unaspirated p
p [p'] strongly aspirated p
m [m] as in English
f [f] as in English
d [t] unaspirated t
t [t'] strongly aspirated t
n [n] as in English
l [l] as in English
g [k] unaspirated k
k [k'] strongly aspirated k
h [ch] as in German
j [dshi] unaspirated "chy"-sound, as in German
q [tshi] aspirated "chy"-sound
x [shi] as in German
zh [dj] soft ch, as in English
ch [tshr] "chy"-sound, soft r instead of i / y
sh [sch] as in German
r [sh] soft, close to English j, "sh"-sound
z [ds] as in English
c [ts'] as in English
s [s] usual s
w [w] loosely aspirated
y [j] as in German
³TONE CONTOURS
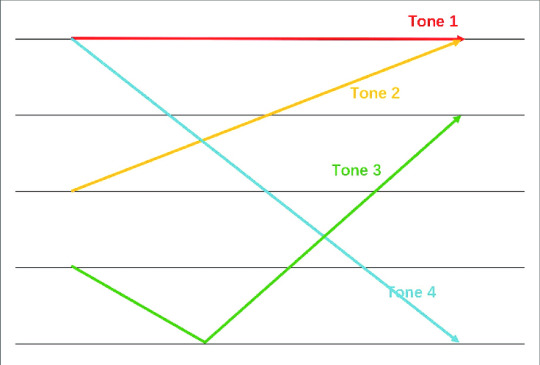
tone 1 ex. mā
tone 2 ex. má
tone 3 ex. mǎ
tone 4 ex. mà
(the picture visualization helped me lots)
GREETING, ASKING FOR NAMES AND TELLING YOUR OWN
"MEETING SOMEONE FOR THE FIRST TIME"
Nǐ haǒ. literally means "you good", rarely used among
friends and family
Nǐ jiào shénme míngzi? literally means "you call what
name?"
Wǒ jiào... "my name is.." answer to question above
Hěn gāoxìng rènshi nǐ. literally means "very happy to
know you", said after
introducing yourself
total study time: 3 hours
where i learn: coursera (hsk course 1-6)
11 notes
·
View notes
Text
Hi! I’m trying to get back into Mandarin, so I just signed up for an HSK 4 Coursera course and am thinking about trying to get back into tutoring. Looking for intermediate or low-advanced learners to follow!
3 notes
·
View notes
Text
Empowering Minds: Coursera's Global Learning Platform

Continuous learning is essential in our rapidly evolving world. Coursera, a leading online education platform, revolutionizes access to knowledge. Offering a diverse array of courses from top universities and organizations worldwide, Coursera empowers learners to upskill, reskill, and explore new horizons.
With Coursera, education transcends geographical boundaries. Learners can access high-quality content in a flexible, self-paced manner, making it suitable for professionals, students, and lifelong learners alike. The platform covers a wide spectrum of subjects, from technology and business to arts and humanities, ensuring there's something for everyone.
Coursera's unique approach combines video lectures, quizzes, peer interaction, and hands-on projects, providing a comprehensive learning experience. The courses are taught by world-class instructors, ensuring the highest quality education. Additionally, Coursera offers specialized certificates and degree programs, allowing learners to acquire valuable credentials recognized by industry leaders.
One of Coursera's standout features is its commitment to inclusivity. Through initiatives like Coursera for Refugees and the Global Skills Initiative, the platform strives to make education accessible to all, regardless of socio-economic background or location.
In a world where adaptability and continuous learning are paramount, Coursera stands as a beacon of accessible, high-quality education, shaping the minds of learners around the globe. Explore Coursera today and unlock a world of knowledge and opportunity.

#education#digital learning#notes#programming#coursera#online learning#digitalmarketing#google#university#great learning#microsoft#amazon#stanford university#harvard university#yale university#duke university#pennsylvania#educación#educhums#educate yourselves#tumblog#my vlog#article#illinois
3 notes
·
View notes
Text
coursera my beloved <33333
4 notes
·
View notes
Text
GoodNotes app
The one time payment to unlock to create multiple documents in GoodNotes app is so worth it. I personally love planners and journalizing, and this app really helped me saved more. I know you could purchase online planners and stickers but what I did is I just edited through canva how I would like my pages to look then saved it through my keynote app to link pages so I can easily create clickable tabs per month for easy navigation.
Aside from that this is where I created my itinerary from our last trip to Palawan. All to the places we went as well how much we spent is documented there.
A simple social media calendar of what brand do I target to post for a certain day and how many posts. Saved all brands that I have into stickers so I can easily put them when I create schedules.
This serves also a work board as well as a notebook for me, since I enrolled into different free self paced classes in Coursera.
7 notes
·
View notes
Text
Coursera Korean thoughts!
So my workplace was so kind and just provided us with some free/already paid for Coursera modules
I honestly hope there's more languages later because right now it's quite sparse compared to the other courses...
But I started doing Korean and I'm also eyeing the creative courses (mainly creative writing and music production). However, right now, I started doing the 5-week Korean Basics course. I did do a bit of Korean before, but just for fun and to be able to help my sister who is currently actively learning and I never attended a course so I'm excited to see what I learn.
And you know, those courses are completely free for us, so I may just as well use it. Now that I finally am doing a little better mental health wise, I want to start learning new things again. I really want to do the Creative Writing course at some point, but it's pretty long and I'm not sure if I can commit. So I'm trying Korean first, which is the 'easier' module for me. It's fun so far, but I'm already almost behind on deadlines, so I need to get a grip, lol. I may come here more often just to remember how fun it is to learn.
Also, the course itself is good so far, the first week is just learning the alphabet and phonetics. I remembered most things, but I was a little frustrated with the explanations and needed to look up more info online just to make sure I fully understood. It reminded me of learning languages at uni and constantly annoying teachers with very detailed questions that just annoyed and confused everyone else. But yeah, a "hard K" for ㅋ when it's actually aspirated? "Aspirated K" makes it so much easier for me to understand. I know that not everybody learning languages knows phonetics and linguistics, but hey, I can still complain about it.
Hopefully more updates on my Coursera journey later!
16 notes
·
View notes
Text
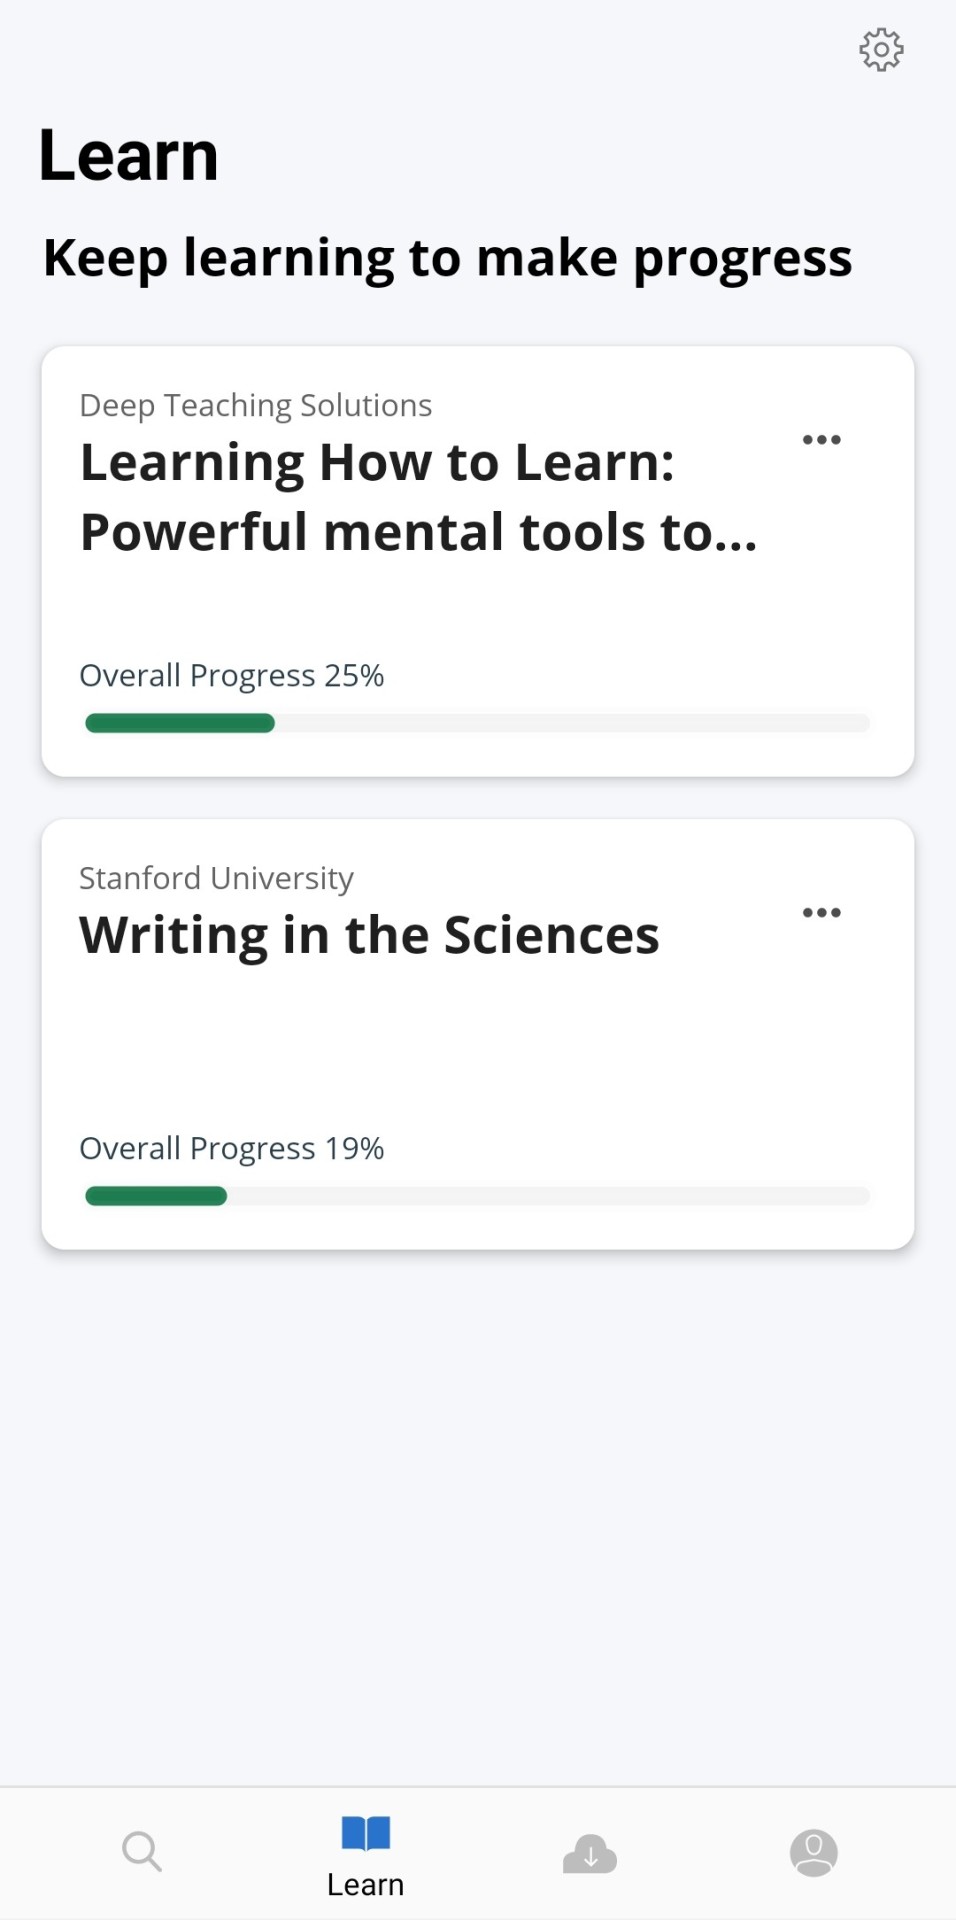

i've been doing two Coursera courses and everytime i'm on the homepage of the app, i see so many more courses i'd love to do and have to stop myself because i know i wouldn't be able to manage more before i complete my in progress ones.
So if you have even a few hours of free time every week, sign up for a course. Because a) there's just so many that it is not possible you won't find courses of your interest and b)you can access the content for free but if you want the certificate and don't want to pay, apply for financial aid, it's not difficult to get just show genuine interest in the course content.
I also got to know today that duolingo is free, so that's that.
I promise there's so much to learn and so many free resources for those who genuinely want to.
#learners#writers#psychology#reading#lessons learned#art#improve#today i learned#opportunity#planning#inspiration#learning#courses#coursera#khan academy#books and reading
24 notes
·
View notes
Text
So I’ve been pretty bored at school lately, what with only taking two courses and a tutorial and being ahead in all of them. I’m interested in doing an online course of some kind... Anyone have recommendations? (Preferably free, but if it’s not super expensive I’m not opposed...)
They can be on any topic (I love learning all sorts of new things!), but if you want to know what I’m already interested in, take a look at my pinned post!
#studyblr#religious studies#gender studies#academia#dark academia#light academia#online courses#coursera#writeblr#studying#college#university#college student#university student#study tips#study recommendations#school#school tips#grad school
9 notes
·
View notes
Text
Top Data Science Courses With Certificate ⬇️
1-IBM Data Science Professional Certificate
https://imp.i384100.net/YgYndj
2-Google Data Analytics Professional Certificate
https://imp.i384100.net/x9jAxk
3-Google Data Analytics Professional Certificate
https://imp.i384100.net/x9jAxk
4-Introduction to Data Science Specialization
https://imp.i384100.net/Ryqyry
5-Applied Data Science with Python Specialization
https://imp.i384100.net/GjkEPn
6-Google Advanced Data Analytics Professional Certificate
https://imp.i384100.net/1r5E3B
7-What is Data Science?
https://imp.i384100.net/JzmRaN
8-Data Science Specialization
https://imp.i384100.net/BX9BmB
9-Python for Data Science, AI & Development
https://imp.i384100.net/g1ARWv
10-Foundations of Data Science
https://imp.i384100.net/nL2Wza
11-IBM Data Analyst Professional Certificate
https://imp.i384100.net/jWGKxa
12-Machine Learning Specialization
https://imp.i384100.net/k0gLAV

#courses#jobs#coursera#education#courses with certification#online courses#career#data analytics#viral#learn data science#data science#data analysis#data scientist#datascience#dataanalytics#machine learning#learn python programming#python tutorial for beginners#python for beginners
3 notes
·
View notes
Text
Alcohol Consumption and employment rate.
First Assignment
I've chosen the Gapminder data set. I think it would be interesting to see different aspects referred to the development of each country and the differences between them. I decided that I'm particularly interested in the relationship that could exist between alcohol consumption and employment rate over the countries and maybe other relationships like the suicide rate.
A good starting point to determine if there is a correlation between alcohol consumption and the employment rate per country is to identify the associated variables. I need to determine what it is about alcohol consumption that I am interested in. In this case, the first variables to consider are the employment rate and the alcohol consumption rate.
Another variable to consider could be the income per person because I think it relates to both variables, in the fact that the average income per person is related to the employment rate cause if there is a low employment rate, the average income per person is reduced possibly that produce an increase in the alcohol consumption rate, or maybe a high alcohol consumption rate produces a low employment rate and is reflected in the average income. I added to my codebook variables that reflect this data.


A second topic that is related to the first one is trying to find a correlation between alcohol consumption and the income per person and try to see if there exists some relation between them. I think it would be interesting to see if a high consumption of alcohol is related to a low income or vice versa. To make all this, I do a series of questions to explain what result I'm trying to obtain from the data for solving these questions, these questions were
Is a high alcohol consumption rate associated with a low employment rate?
Is alcohol consumption related to the average income per person?
High alcohol consumption is associated with low income?
Also, search on the internet to find research that has been done previously on this topic. And I found that this has been extensively studied, I selected a list of different articles referring to this topic, to use them to try to create a hypothesis. After looking at the different articles I figured out that is real that there exists a relationship between the level of alcohol consumption in a country and low employment rates, so I hypothesize that a high level of alcohol consumption is related to a low employment rate.
In summary, I've decided to work with the Gapminder dataset and try to find if there exists a correlation between the level of alcohol consumption and the employment rate.
For do this I selected the variables alcconsumption, employrate, and incomeperperson. And I hypothesize that a high level of alcohol consumption is related to a low employment rate.
References
Forcier, M. W. (1988). Unemployment and Alcohol Abuse: A Review. Journal of Occupational Medicine, 30(3), 246–251. http://www.jstor.org/stable/45007884
Rodriguez E, Lasch KE, Chandra P, et al
Family violence, employment status, welfare benefits, and alcohol drinking in the United States: what is the relation?
Journal of Epidemiology & Community Health 2001;55:172-178.
Rodriguez E, Lasch KE, Chandra P, Lee J. The relation of family violence, employment status, welfare benefits, and alcohol drinking in the United States. West J Med. 2001 May;174(5):317-23. doi 10.1136/ewjm.174.5.317. PMID: 11342506; PMCID: PMC1071386.
2 notes
·
View notes
Text
3 notes
·
View notes
Text
Assignment 4: Creating Graphs for Your Data
PREVIOUS CONTENT
Assignment 1.
Assignment 2.
Assignment 3.
Link to download the dataset here.
Link to download the codebook here.
WHAT TO SUBMIT:
Once you have written a successful program that creates univariate and bivariate graphs, create a blog entry where you post your program and the graphs that you have created. Write a few sentences describing what your graphs reveal in terms of your individual variables and the relationship between them.
Download the graph program here.
In the last assignment (3), I had made the data management that I thought necessary. Now is time to create the graphics that represent this data.
I did that in two ways, in the first one I made the Quantitative->Quantitave method generating a scatterplot and the second one was a Qualitative->Quantitative method that creates a bar graph. Before I present the result of the relationship between the two variables in the graph, let’s see the histogram and the metrics extracted in each attribute separated.
Univariate graphs
Incidence of breast cancer
The first attribute was the incidence of breast cancer in 100,000 female residents during the 2002 year. As it is a quantitative attribute, was generated the histogram of the data. #Univariate histogram of the incidence of breast cancer in 100,000 female residents during the 2002 year.seaborn.distplot(sub1["breastCancer100th"].dropna(), kde=False);plt.xlabel('Incidence of breast cancer in 100,000 female residents during the 2002 year.')plt.ylabel('Number of counties.')plt.title('Histogram of the Incidence of Breast Cancer.')plt.show()
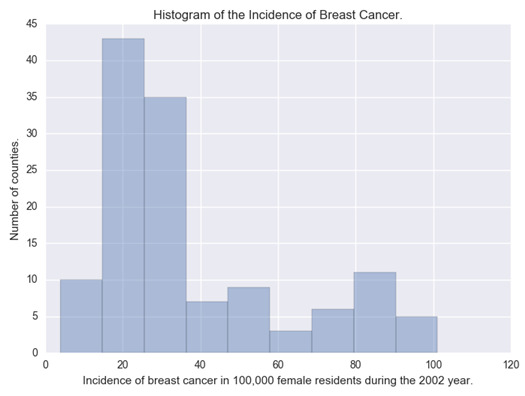
We can observe in the histogram that most of the countries have an incidence of cancer around 30 and 40 cases per 100,000 females. The extracted metrics of this attribute were: desc1 = sub1["breastCancer100th"].describe()print(desc1) count 129.000000mean 37.987597std 24.323873min 3.90000025% 20.60000050% 29.70000075% 50.300000max 101.100000Name: breastCancer100th, dtype: float64
With this, we can see that 75% of the countries have an incidence of breast cancer under 50.30 per 100,000 females.
Sugar consumption
The second attribute is the sugar consumption. For this attribute, I have made two graphs: one that shows the histogram of the original data and the other one that shows the bar graph of this attribute relocated into categories.
Histogram
#Univariate histogram of the Mean of the sugar consumption (grams per person and day) between 1961 and 2002.seaborn.distplot(sub1["meanSugarPerson"].dropna(), kde=False);plt.xlabel('Mean of the sugar consumption (grams per person and day) between 1961 and 2002.')plt.ylabel('Number of counties.')plt.title('Histogram of the Sugar Consumption.')plt.show()
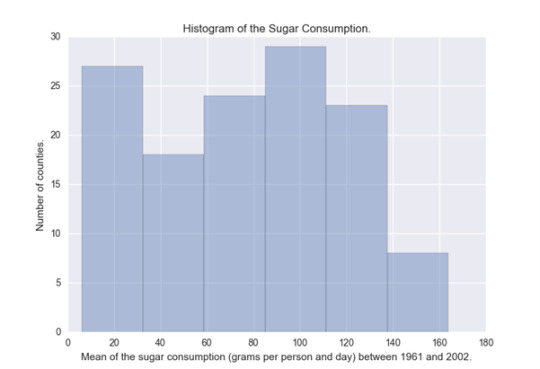
This histogram is almost evenly distributed, we can see that the countries that have the most sugar consumption are in the 20 and the 110 grams per person. desc2 = sub1["meanSugarPerson"].describe()print(desc2) count 129.000000mean 76.238394std 42.488004min 6.13238125% 42.20642950% 79.71452475% 110.307619max 163.861429Name: meanSugarPerson, dtype: float64
The mean of sugar consumption is 76.24 and we can see that 75% of the countries have a consumption of sugar under 110.31 grams per day.
Bar graph
#Univariate bar graph of the Mean of the sugar consumption (grams per person and day) between 1961 and 2002.seaborn.countplot(x="sugar_consumption", data=sub1)plt.xlabel('Mean of the sugar consumption (grams per person and day) between 1961 and 2002.')plt.ylabel('Number of counties.')plt.title('Histogram of the Sugar Consumption.')plt.show()

Where the consumption is:
(0) Desirable between 0 and 30 g.
(1) Raised between 30 and 60 g.
(2) Borderline high between 60 and 90 g.
(3) High between 90 and 120 g.
(4) Very high under 120g.
The bar graph behaved very similarly to the histogram.
Bivariate graphs
The two bivariate graphics are presented below: #Bivariate Scatterplot Q->Q - Incidence of breast cancer versus sugar consumptionscat1 = seaborn.regplot(x="meanSugarPerson", y="breastCancer100th", fit_reg=True, data=sub1)plt.xlabel('Mean of the sugar consumption between 1961 and 2002.')plt.ylabel('Incidence of breast cancer in 100,000 female residents during the 2002 year.')plt.title('Scatterplot for the association between the incidence of breast cancer and the sugar consumption.')plt.show() #Bivariate bar graph C->Q - Incidence of breast cancer versus sugar consumptionseaborn.factorplot(x='sugar_consumption', y='breastCancer100th', data=sub1, kind="bar", ci=None)plt.xlabel('Mean of the sugar consumption between 1961 and 2002.')plt.ylabel('Incidence of breast cancer in 100,000 female residents during the 2002 year.')plt.title('Bar graph for the Association between the incidence of breast cancer and the sugar consumption.')plt.show()
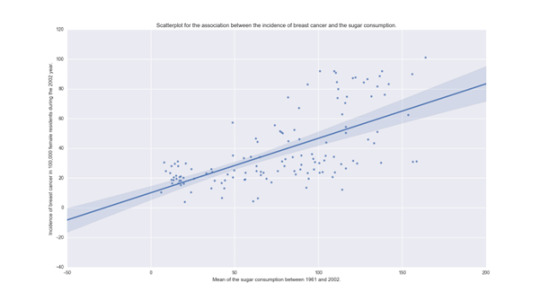
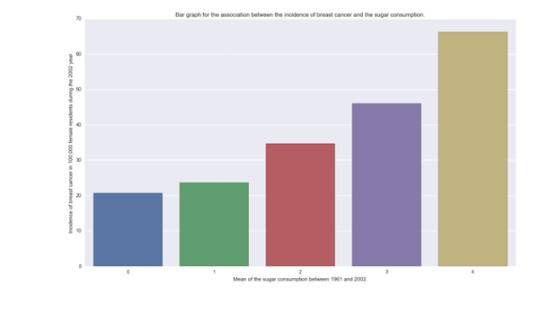
In both graphics, we can see that there is a relation with the incidence of breast cancer and the consumption of sugar. While sugar consumption is increased the incidence of new breast cancer cases is increased too.
Review criteria
Your assessment will be based on the evidence you provide that you have completed all the steps. When relevant, gradients in the scoring will be available to reward clarity (for example, you will get one point for submitting graphs that do not accurately represent your data, but two points if the data is accurately represented). In all cases, consider that the peer assessing your work is likely not an expert in the field you are analyzing. You will be assessed equally in your description of your frequency distributions.
Specific rubric items, and their point values, are as follows:
Was a univariate graph created for each of the selected variables? (2 points)
Was a bivariate graph created for the selected variables? (2 points)
Did the summary describe what the graphs revealed in terms of the individual variables and the relationship between them? (2 points)
2 notes
·
View notes
Text
UX Designer
I finished up work with UW Food Services. I would be happy if I didn’t have to wash another dish again, though I have offered my services part-time in the fall should I be unemployed. UW Food Services treated me right, and it was a great job, I just hated the work. Right now I am looking for a UX Design job.
I’m excited about getting a job where I can use Adobe XD all day. I had made some game prototypes and app prototypes with the software between 2020 and 2022, but have done nothing with the software recently. While my studies at Conestoga College will go on, I would like to find some remote work in the meantime.
Maybe I’m supposed to be a UX Designer. I’m looking at taking some Coursera courses from Google about UX Design this summer. I completed a Coursera specialization from CalArts on UX Design in 2020, but I’m a bit rusty with some of the vocabulary and ideas, so brushing up isn’t a bad idea. Wish me luck with my future endeavours!
#UX#UXDesign#Design#Designer#Designing#Designs#Coursera#Google#CalArts#PhillipGallant#PhillipGallantMedia#PGM#UW#UWFoodServices#ArtDirector#ArtDirection#Adobe#AdobeXD#XD
3 notes
·
View notes
Last Seen Blogs

aceparagon
A BEACON OF HOPE

iphuseekchuckmee-blog
Chuck Mee's IPHIGENIA 2.0

lyu-do
Lyudo.

joy123sstuff
joy

divyasen123
Latest Post