#fibonacci trader
Text
Analyzing Bitcoin's 20% Decline: Is it a Short-Term Hiccup or Indicative of a Larger Downturn?
Bitcoin, the pioneer of cryptocurrencies, is undergoing a distinctive phase marked by a 20% correction, a phenomenon that aligns with historical sentiment cycles. This correction, often referred to as the 'anxiety phase,' has prompted discussions within the crypto community, questioning whether it signifies a transient setback or the commencement of a more profound downturn.
Ali, a prominent figure in the blockchain space, sheds light on Bitcoin's historical tendency to retrace to the 50% Fibonacci level after reaching the 78.6% Fibonacci level in previous bull cycles. The recent attainment of this 78.6% Fib level raises the possibility of a correction to around $32,700, aligning with the 50% Fibonacci retracement. This historical pattern introduces the idea that the ongoing 20% decline might not represent the culmination of the correction.
An intriguing element in this narrative is the relationship between Bitcoin and USDT (Tether) dominance. These metrics, exhibiting inverse movements, serve as indicators of market sentiment. High USDT dominance suggests a risk-averse market, with investors favoring the stability of stablecoins, a trend typically interpreted as bearish for cryptocurrencies like Bitcoin. Conversely, low USDT dominance signals an augmented risk appetite, creating a bullish environment for volatile assets such as Bitcoin.
Presently, Bitcoin is valued at $39,717.94, with a 24-hour trading volume of $30 billion. Despite a marginal 0.81% drop in the last 24 hours, a nuanced perspective emerges from technical indicators. The 4-hour Relative Strength Index (RSI) at 39.62 indicates a slightly oversold condition. However, the 4-hour Moving Average Convergence Divergence (MACD) implies a bearish short-term momentum, supported by the 4-hour Know Sure Thing (KST) exhibiting a negative reading, signifying a weakening short-term trend for Bitcoin.
While historical patterns and technical indicators suggest the potential for further decline, the distinctive context of each market cycle requires careful consideration. Investors and traders are advised to closely monitor these indicators for valuable insights into the shifting sentiment surrounding Bitcoin.
0 notes
Text
Solana (SOL) Technical Analysis: Breaking Support Levels and Analyst Predictions
Current Status of Solana's Price
The price of Solana (SOL) has fallen below the ascending trendline support, which held for nearly 100 days. Additionally, SOL has exited a short-term symmetrical triangle, dropping below the Fibonacci support area.
Breakdown of Long-Term Support for Solana
Technical analysis on the daily timeframe reveals that since October 16, 2023, SOL has been rising along the ascending trendline support, leading to the annual peak of $126 on December 25.
Subsequently, the asset's price started to decline. On January 19, 2024, it broke below the ascending support line and is currently trading within a support area that coincides with the 0.382 Fibonacci retracement level.
!(link to the chart image)
Source: TradingView
The daily Relative Strength Index (RSI) provides bearish signals, being below 50 and continuing its descent.
Analyst Insights
Well-known crypto traders and analysts on Twitter believe that the price of Solana will continue to decline.
- @Lmn12121 believes that the asset is due for a correction towards $70.!(link to the tweet image)
- @LordOfEntry noted the breakdown of the ascending support line, stating that if the candle closes below the current support, the $77 region will start to look realistic.
- @BluntzCapital observed a similarity in SOL's price action to Bitcoin's (BTC) chart in 2018. He speculated that a drop to $70 would signify a long-term bottom.
SOL Price Forecast: When Will the Correction End?
Similar to the daily timeframe, the six-hour chart provides a bearish forecast. The most likely scenario suggests that SOL is in a wave C of a corrective A-B-C structure. Wave B took on the typical form of a triangle for such structures.
Price action indicates that the asset has exited the symmetrical triangle, confirming the correction. Additionally, the RSI is below 50 and falling. If the correction continues, Solana may drop by another 20% to the convergence of supports in the range of $70-$72.
!(link to the chart image)
However, a return to the support trendline of the triangle would signify the end of the correction. In that case, SOL could rise by 30% to the next resistance at $115.
Disclaimer: All information on our website is published on principles of fairness and objectivity and is for informational purposes only. Readers are solely responsible for any actions taken based on the information obtained from our website.
Read the full article
#analytics#correction#Cryptocurrency#Fibonacci#forecast#price#RelativeStrengthIndex(RSI)#resistance#Solana(SOL)#support#TechnicalAnalysis#traders#trend#Twitter
0 notes
Text

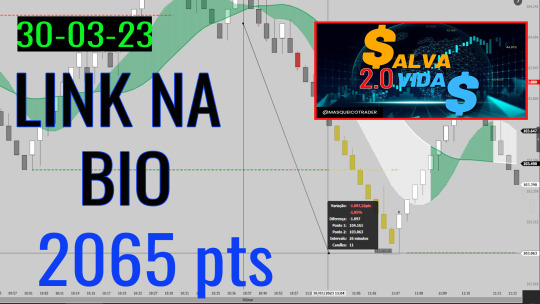
Entrada do Indicador Salva Vidas em 31/03/2023 - Masqueico Trader
Sexta linda, nosso indicador #SalvaVidas se saiu bem, veja o resultado.
MasqueicoTrader #DayTrader
Nos acompanhe em outras redes sociais https://linktr.ee/masqueicotrader
Indicador Salva Vidas - https://youtu.be/YpyOB-jQPn4
Indicador Salva Vidas 2.0 - https://youtu.be/qXIRUit9zqM
Indicador Chutado - https://youtu.be/S6pHEAcy9aQ
masqueico trader, indicador salva vidas, indicadores trading, day trade, day trading, nelogica profit pro, b3, price action, bolsa de valores, trader, mini índice, mini dólar, fibonacci, renko, médias móveis, estratégias day trade, ações, opções, day trader, how to day trade, sinais de entrada day trade
indicador
daytrade
b3
nelogica
profitpro
bovespa
Entrada do Indicador #SalvaVidas em 31/03/2023 #MasqueicoTrader
youtube
#masqueico trader#indicador salva vidas#indicadores trading#day trade#day trading#nelogica profit pro#b3#price action#bolsa de valores#trader#mini índice#mini dólar#fibonacci#renko#médias móveis#estratégias day trade#ações#opções#day trader#how to day trade#sinais de entrada day trade#Youtube
1 note
·
View note
Photo

🇺🇸🇨🇦#USDCAD 🔥USDCAD looks bearish! On the M5 chart the price broke below the ascending support trend line. Thus, we expect the pair to decline toward the recent low at 1.3345. Link in Bio for Free Signals Connect me on Telegram @jeetforex #forex #signals #trend #fx #dollars #fibonacci #traderlifestyle #traders #profits #loss #cad #canada #nasdaq #us30 https://www.instagram.com/p/Cn1lbf0PC15/?igshid=NGJjMDIxMWI=
#usdcad#forex#signals#trend#fx#dollars#fibonacci#traderlifestyle#traders#profits#loss#cad#canada#nasdaq#us30
1 note
·
View note
Text
Best Autotrader Futures Day Trading System buys and sells orders both in the day and night. commonly, the best opportunities to enter the market are always when we’re sleeping or we aren’t in front of the pc.
#12tradepro#besttradepro#bestprotrade#ninjatrader auto-trader trading futures markets#automated trading system-autotrading#pro trade fibonacci
0 notes
Text
fibonacci-la-gi-cac-loai-fibonacci-pho-bien-nhat-hien-nay

#Fibonacci là gì? Fibonacci được hiểu đơn giản là một thuật ngữ được nhiều anh em trader ưa chuộng. Dựa vào dãy số Fibonacci để xác định hỗ t#cắt lỗ hay chốt lời hợp lý khi tham gia chứng khoán hay tiền ảo vvv#Nguồn bài viết : http://interwinlink.com/fibonacci-la-gi.html#interwinlink#nha_cai_INTERWIN#nha_cai#casino#fibonaccilagihtml
0 notes
Text
Resistance at $42 for INJ, While ETC Grapples with ETF Speculation Analysis
Injective (INJ) faces a critical juncture as it grapples with persistent resistance at $42, with potential for a breakout looming large, offering traders a pivotal setup for future market dynamics. The $35 support level has proven steadfast, setting the stage for an imminent decisive movement in INJ's short-term trajectory.
On the other side, Ethereum Classic (ETC) gains momentum propelled by market speculation surrounding a potential Ethereum ETF for ETH. This surge has brought ETC to a significant point, positioned at the 0.5 Fibonacci retracement level. The market now stands at a crossroads, anticipating either a bounce back or a further breakdown from this crucial juncture.
CryptoBusy's insights on ETC's performance amid Ethereum ETF speculation highlight the resistance at $27.00, a critical barrier that the digital asset must overcome to sustain its upward momentum. Simultaneously, a support level has formed around $26.00, holding significance for ETC's stability and influencing its short-term price movements.
As the market conditions unfold, both INJ and ETC are navigating pivotal phases. Injective's potential breakout at $42 and Ethereum Classic's response to ETF speculation set the stage for decisive moves in the coming days. The resistance battles and ETF speculation contribute to the dynamic nature of the market, with traders closely observing these assets for the unfolding short-term direction.
#Injective#potential breakout#traders#critical setup#future movements#Ethereum Classic#vitality#Ethereum ETF#Fibonacci retracement level#market conditions#$INJ#$ETC#Cryptotale
0 notes
Text
Solana (SOL) Technical Analysis: Breaking Support Levels and Analyst Predictions
Current Status of Solana's Price
The price of Solana (SOL) has fallen below the ascending trendline support, which held for nearly 100 days. Additionally, SOL has exited a short-term symmetrical triangle, dropping below the Fibonacci support area.
Breakdown of Long-Term Support for Solana
Technical analysis on the daily timeframe reveals that since October 16, 2023, SOL has been rising along the ascending trendline support, leading to the annual peak of $126 on December 25.
Subsequently, the asset's price started to decline. On January 19, 2024, it broke below the ascending support line and is currently trading within a support area that coincides with the 0.382 Fibonacci retracement level.
!(link to the chart image)
Source: TradingView
The daily Relative Strength Index (RSI) provides bearish signals, being below 50 and continuing its descent.
Analyst Insights
Well-known crypto traders and analysts on Twitter believe that the price of Solana will continue to decline.
- @Lmn12121 believes that the asset is due for a correction towards $70.!(link to the tweet image)
- @LordOfEntry noted the breakdown of the ascending support line, stating that if the candle closes below the current support, the $77 region will start to look realistic.
- @BluntzCapital observed a similarity in SOL's price action to Bitcoin's (BTC) chart in 2018. He speculated that a drop to $70 would signify a long-term bottom.
SOL Price Forecast: When Will the Correction End?
Similar to the daily timeframe, the six-hour chart provides a bearish forecast. The most likely scenario suggests that SOL is in a wave C of a corrective A-B-C structure. Wave B took on the typical form of a triangle for such structures.
Price action indicates that the asset has exited the symmetrical triangle, confirming the correction. Additionally, the RSI is below 50 and falling. If the correction continues, Solana may drop by another 20% to the convergence of supports in the range of $70-$72.
!(link to the chart image)
However, a return to the support trendline of the triangle would signify the end of the correction. In that case, SOL could rise by 30% to the next resistance at $115.
Disclaimer: All information on our website is published on principles of fairness and objectivity and is for informational purposes only. Readers are solely responsible for any actions taken based on the information obtained from our website.
Read the full article
#analytics#correction#Cryptocurrency#Fibonacci#forecast#price#RelativeStrengthIndex(RSI)#resistance#Solana(SOL)#support#TechnicalAnalysis#traders#trend#Twitter
0 notes
Text
Word find tag (ramp, range, rare, ribbon, remember)
@oh-no-another-idea tagged me to search my WIP for ramp, range, rare, ribbon, and remember.
Crossing my fingers and praying to the formatting gods that Tumblr doesn 't randomly turn parts of this post some unreadable colour.

RAMP
He opens the window and waits for exactly the right moment, then throws the chip at the roof of a passing cab. It bounces and vanishes from view, perhaps onto another cab and another, then maybe into the street below to be trampled and kicked and carried along on the soles of strangers' shoes. “It’ll keep moving long enough to confuse Them. We need to get you a new ID.”
RANGE
The smell of coffee finds me and it helps a little. I roll onto my side and reach for it before my eyes are properly open.
Gillen slides it along the table, just out of range of my hand, because he’s that kind of asshole. “Sit up, Rafe. I want to talk to you.”
So I sit, dragging myself upright, resentful of everything. “Why do we have to talk in the morning?”
RARE
“Death Spiral. It’s part electrocution, part MDMA, programmed through a Fibonacci sequence.” Gillen attaches his own cell. “It’ll level out in… fuck!” His kicks in too and he snaps into silence with a sudden gasp of bliss and a rare smile that actually reaches his eyes, as if he’s only truly happy when he’s dying.
RIBBON
Three women walk past us and one of them, small and tough-looking with short dark hair, stops and grins at me. I kind of recognise her from around. Aria something. I think she did time in rehab a while back, but she’s a trader now. Not with Them. She’s in with a different crew. The Other Side, I think. “Nice one,” she says. “That guy’s a fucking dick.” And she’s gone into the crowd, ribbons of light floating behind her.
(Psst! This is Aria. Remember that name. It might be a while before you meet her again, and it won't be in this book, but she'll definitely be back in a big way...)
REMEMBER
This is how people hold me while they bleed out in my arms, as if I didn’t just open their throat with a kiss of metal on skin, as if they’ll find one last shred of life in me if they can only hang on for a little bit longer. I remember what he asked me when we were on the death frequencies and I remember what I answered. It would’ve felt fucking amazing.
Tagging @nanashi23, @ezestreet and @manathen to hunt your WIP(s) for green, monster, city, and eyes.
Also, this is an OPEN TAG (look, everything I post is an open tag because I'm a filthy fucking enabler, OK?) so if you're seeing this and would like to get in on the game, feel free to @ me so I can see and share your post 💜
#my writing#bridge from ashes#project frequency#word find tag#writeblr tags#wip excerpt#am writing#wip snippet#writing wip
5 notes
·
View notes
Text

Quasimodo Pattern atau Pola Quasimodo adalah pola yang ditentukan oleh level harga yang dianggap penting oleh trader, seperti level Fibonacci atau level Pivot Point. Pola ini menunjukkan titik masuk dan keluar dari pasar yang dianggap potensial oleh trader.
3 notes
·
View notes
Text
Entrada do Indicador Salva Vidas em 30/03/2023 - Masqueico Trader
Quinta maravilha, nosso indicador #SalvaVidas se saiu bem, veja o resultado.
MasqueicoTrader #DayTrader
Nos acompanhe em outras redes sociais https://linktr.ee/masqueicotrader
Indicador Salva Vidas - https://youtu.be/YpyOB-jQPn4
Indicador Salva Vidas 2.0 - https://youtu.be/qXIRUit9zqM
Indicador Chutado - https://youtu.be/S6pHEAcy9aQ
masqueico trader, indicador salva vidas, indicadores trading, day trade, day trading, nelogica profit pro, b3, price action, bolsa de valores, trader, mini índice, mini dólar, fibonacci, renko, médias móveis, estratégias day trade, ações, opções, day trader, how to day trade, sinais de entrada day trade
indicador
daytrade
b3
nelogica
profitpro
bovespa
Entrada do Indicador #SalvaVidas em 30/03/2023 #MasqueicoTrader
youtube
#masqueico trader#indicador salva vidas#indicadores trading#day trade#day trading#nelogica profit pro#b3#price action#bolsa de valores#trader#mini índice#mini dólar#fibonacci#renko#médias móveis#estratégias day trade#ações#opções#day trader#how to day trade#sinais de entrada day trade#Youtube
1 note
·
View note
Photo

📉 [Sell Limit] EURCHF - Bearish - We look to Sell at 0.9898 ▪ Although the bulls are in control, the stalling positive momentum indicates a turnaround is possible. ▪ Trades with a bearish descending triangle formation. ▪ Trend line resistance is located at 0.9901. ▪ Prices expected to stall near trend line resistance. Confidence: ⭐⭐⭐⭐ ⛔ Stop: 0.9921 🎯 Target 1: 0.9844 🎯 Target 2: 0.9834 @jeetforex Telegram #ftmo #fibonacci #forextrader #forexsignals #forexmarket #technical #analysis #gold #fx #stockmarketindia #scalping #swing #traders #enterpreneur https://www.instagram.com/p/Ckh-c1ApDti/?igshid=NGJjMDIxMWI=
#ftmo#fibonacci#forextrader#forexsignals#forexmarket#technical#analysis#gold#fx#stockmarketindia#scalping#swing#traders#enterpreneur
0 notes
Video
COMO OPERAR OMBRO CABEÇA OMBRO ESTRATEGIA OPÇÕES BINARIAS IQ OPTION
É possível ganhar dinheiro com o IQ Option? A resposta mais básica para essa pergunta é que, sim, tem como ganhar dinheiro na IQ Option negociando opções binárias. Qual o valor mínimo para investir na IQ Option? Embora não haja um valor mínimo, você precisará entrar em contato com a Equipe de Suporte para solicitar uma retirada de $ 2 ou menos. Fora esse detalhe, não há valor mínimo de retirada aplicado à sua conta. Opções binárias são operações baseadas na subida ou descida dos preços dentro de um período de tempo, determinado por cada negociador. #iqoption #daytrade #opçõesbinárias #opcoesbinarias #trader #iqoptionopçõesbinárias INSTAGRAM https://www.instagram.com/rauniramosy... TELEGRAN https://t.me/raunitutoriais2 COMPARTILHE O VÍDEO https://youtu.be/ThKQ6sLOHyI TAGS: opções binarias, opções binárias, opções binarias iniciante, opções binarias price action, opções binárias ao vivo, opções binarias estrategias 1 minutos, opções binarias funciona, opções binarias é seguro, opções binarias vs forex, opções binarias fibonacci, opções binárias quotex, opções binárias alavancagem, iq option, iq option como funciona, iq option ao vivo, iq option iniciante celular, iq option estrategia, iq option como ganhar dinheiro, iq option é confiavel, iq option ao vivo agora, iq option alavancagem, iq option binaria
6 notes
·
View notes
Text
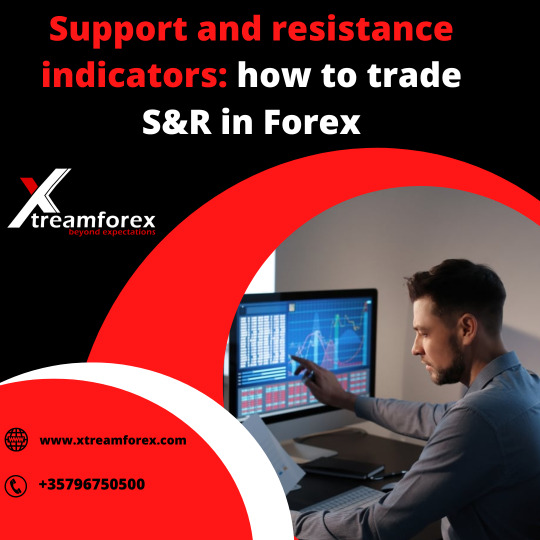
Support and resistance indicators: how to trade S&R in Forex
There are different approaches to distinguish between support and failure levels in forex. Flat S&R levels are the easiest to spot, but various levels such as round number mental levels, his S&R levels in pattern lines, Fibonacci retracements, etc. require specific equipment for a trader to find them. Is required. This is an overview of the main help and obstacle levels in forex.
2 notes
·
View notes
Last Seen Blogs

nolimbsleft
nolimbsleft

joselyncherebolg
JOSELYNCHERE1999


notesfromundergound
Denemeler

gfrxak
CEO of MAR34⋆