#ggplot2
Text
I've been refusing to get into ggplot for several years now and today is the day it's coming back to haunt me. 🥲
#phd#phd student#academia#i need to make pretty plots for my paper manuscript#and all the ones i've used in the past are soooo perfunctory#it's a terrible thing when you're suddenly forced to invest the effort you simply did not want to invest#R#ggplot#ggplot2
17 notes
·
View notes
Text
fuck horoscopes and mbtis, what's your favourite R package
#programmer humor#r programming#biostatistics#bioinformatics#programming#helix talks#ggplot2#my absolute beloved#i just think its neat#trying to plot stuff with base r is suffering to me idk why#also karthik wesanderson and rcolorbrewer because heehee now your graphs can be COLOURFUL
31 notes
·
View notes
Text
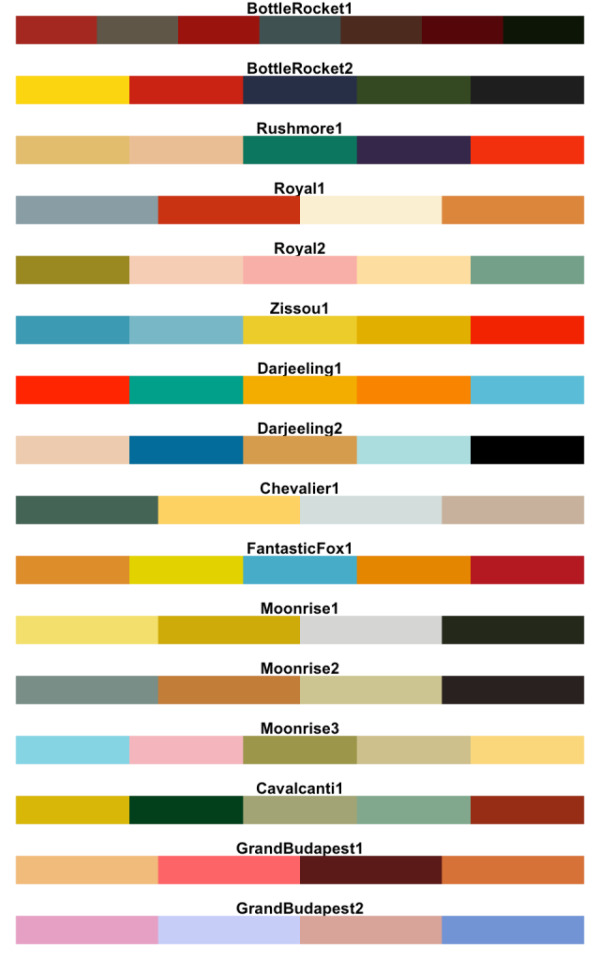
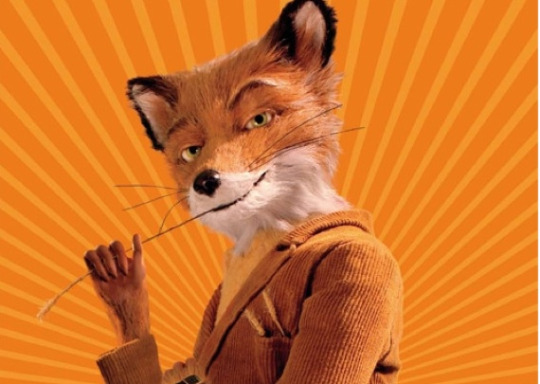
Wes Anderson color palettes
3 notes
·
View notes
Text
#IMaskBecause I have the tools to prevent microclots but they only work if I use them.
Latest from the #IMaskBecause series directly related to the second week of increased Google search traffic for microclots.

Here's me in an elastomeric P100 (dentec comfort air) giving a very bendy thumbs up sign 👆🏻
I've been tracking the increase in searches for miroclots since the last week of April for anyone interested 👇🏻
#covid19#Covid-19#pandemic#covid is not over#covid isnt over#elastomeric#P100#wear a mask#i mask because#microclots#long covid#post covid sequelae#respirator#EDS#hypermobility#R#R stats#ggplot2#tidyverse#gtrendsR#Google trends#google search#trending#analysis#data analysis#sociology#social science#data science#coding example#research
15 notes
·
View notes
Text
0 notes
Text
How to create bubble plots in R with ggplot2
If you want to create bubble plots in R with ggplot2. Please follow the article below for more details!
0 notes
Text
Data Visualization & Storytelling Part_3:
How to create a chart (in R or other tools)
📌In my previous posts, I had talked about how you should study data visualization & how to start selecting basic charts.
Creating a chart depends on the tool you’re using. 😎 In my onion, R provides a great ecosystem for creating & designing amazing charts (be it static or animated, or interactive charts).
If you’re interested to learn about how to create a beautiful chart using r, I am sharing some of the awesome resources that I follow 📜
We don’t need to remember every single function/argument that we might need while customizing a chart. R graph gallery and plotly e-book are the sources, you can rely on when the need arises.
Needless to say, StackOverflow & R community can come to the rescue when stuck in a bug.
👇 Some of my favorite resources are in the comments.
1 note
·
View note
Text
Study One Updates
This is where I would talk about progress with Study One.
We are about to submit a paper for the Cyberpsychology, Behavior, and Social Networking special issue, Virtual Emotions: Understanding Affective Experiences in the Metaverse. The paper is called "Make Me Feel: Public Expressions of Emotion Following VR Play". It examines the most commonly expressed emotions following VR usage. Here is a preview of some of the findings.

We are also working on a secondary paper called "I Like the Way You work That: Identifying Gratification in Remote Work over VR". It was originally proposed for a special issue but is being completed for a yet unidentified journal. That is still in its early stages.

All other Study One work has been targeted at insight gathering for other segments of the team.

0 notes
Text

Flow fields
0 notes
Photo
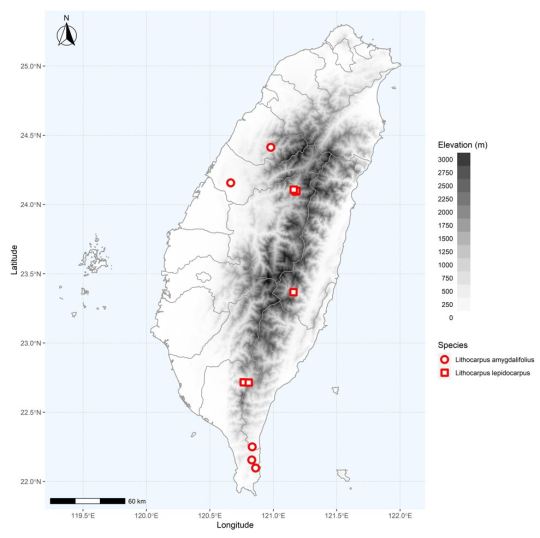
[Drawing a map of Taiwan with R]
I updated my code that is for drawing the map of Taiwan.
Hoping that the post will help anyone who needs it.
Enjoy it~
https://a-botany-nerd.blogspot.com/2022/05/r-part-ii.html
0 notes
Text
Lads u should see how fucking sexy my fucking graphs are rn they’re so fit I’m speechless
1 note
·
View note
Photo

July 2023 Google Top Search Query of Movies by US State
by u/zwei4
Method: This graph shows the top query rather than rising query: * TOP - The most popular search query. Scoring is on a relative scale where a value of 100 is the most commonly searched query, 50 is a query searched half as often as the most popular query, and so on. !Note this is NOT the same as "Rising"
The data was pulled using python, with pytrends (https://pypi.org/project/pytrends/), which is an unofficial API for Google Trends. Data processing, plotting and animataion done in R, with packages ggplot2, usmap, gganimate, gifski, etc.
128 notes
·
View notes
Text
youtube
0 notes
Photo
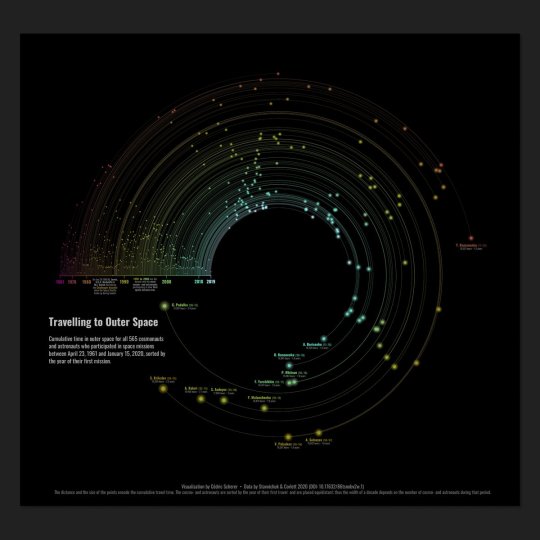
Traveling to Outer Space
A color- and artful visualization of cumulative travel times to space by cosmo- and astronauts for missions between 1961 to 2019.
Made in #rstats with #ggplot2.
by @CedScherer
151 notes
·
View notes
Text
Exploring Data Science Tools: My Adventures with Python, R, and More
Welcome to my data science journey! In this blog post, I'm excited to take you on a captivating adventure through the world of data science tools. We'll explore the significance of choosing the right tools and how they've shaped my path in this thrilling field.
Choosing the right tools in data science is akin to a chef selecting the finest ingredients for a culinary masterpiece. Each tool has its unique flavor and purpose, and understanding their nuances is key to becoming a proficient data scientist.
I. The Quest for the Right Tool
My journey began with confusion and curiosity. The world of data science tools was vast and intimidating. I questioned which programming language would be my trusted companion on this expedition. The importance of selecting the right tool soon became evident.
I embarked on a research quest, delving deep into the features and capabilities of various tools. Python and R emerged as the frontrunners, each with its strengths and applications. These two contenders became the focus of my data science adventures.
II. Python: The Swiss Army Knife of Data Science
Python, often hailed as the Swiss Army Knife of data science, stood out for its versatility and widespread popularity. Its extensive library ecosystem, including NumPy for numerical computing, pandas for data manipulation, and Matplotlib for data visualization, made it a compelling choice.
My first experiences with Python were both thrilling and challenging. I dove into coding, faced syntax errors, and wrestled with data structures. But with each obstacle, I discovered new capabilities and expanded my skill set.
III. R: The Statistical Powerhouse
In the world of statistics, R shines as a powerhouse. Its statistical packages like dplyr for data manipulation and ggplot2 for data visualization are renowned for their efficacy. As I ventured into R, I found myself immersed in a world of statistical analysis and data exploration.
My journey with R included memorable encounters with data sets, where I unearthed hidden insights and crafted beautiful visualizations. The statistical prowess of R truly left an indelible mark on my data science adventure.
IV. Beyond Python and R: Exploring Specialized Tools
While Python and R were my primary companions, I couldn't resist exploring specialized tools and programming languages that catered to specific niches in data science. These tools offered unique features and advantages that added depth to my skill set.
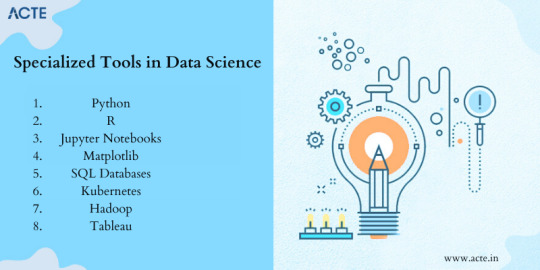
For instance, tools like SQL allowed me to delve into database management and querying, while Scala opened doors to big data analytics. Each tool found its place in my toolkit, serving as a valuable asset in different scenarios.
V. The Learning Curve: Challenges and Rewards
The path I took wasn't without its share of difficulties. Learning Python, R, and specialized tools presented a steep learning curve. Debugging code, grasping complex algorithms, and troubleshooting errors were all part of the process.
However, these challenges brought about incredible rewards. With persistence and dedication, I overcame obstacles, gained a profound understanding of data science, and felt a growing sense of achievement and empowerment.
VI. Leveraging Python and R Together
One of the most exciting revelations in my journey was discovering the synergy between Python and R. These two languages, once considered competitors, complemented each other beautifully.
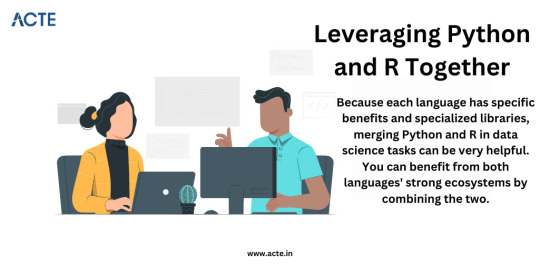
I began integrating Python and R seamlessly into my data science workflow. Python's data manipulation capabilities combined with R's statistical prowess proved to be a winning combination. Together, they enabled me to tackle diverse data science tasks effectively.
VII. Tips for Beginners
For fellow data science enthusiasts beginning their own journeys, I offer some valuable tips:
Embrace curiosity and stay open to learning.
Work on practical projects while engaging in frequent coding practice.
Explore data science courses and resources to enhance your skills.
Seek guidance from mentors and engage with the data science community.
Remember that the journey is continuous—there's always more to learn and discover.
My adventures with Python, R, and various data science tools have been transformative. I've learned that choosing the right tool for the job is crucial, but versatility and adaptability are equally important traits for a data scientist.
As I summarize my expedition, I emphasize the significance of selecting tools that align with your project requirements and objectives. Each tool has a unique role to play, and mastering them unlocks endless possibilities in the world of data science.
I encourage you to embark on your own tool exploration journey in data science. Embrace the challenges, relish the rewards, and remember that the adventure is ongoing. May your path in data science be as exhilarating and fulfilling as mine has been.
Happy data exploring!
16 notes
·
View notes
Last Seen Blogs
hindubull
Untitled

coolzeeshanfan
Untitled

itstctime
Its Teacher crush time my dudes

tygirl5-blog
Untitled