#standard deviation
Note
hi friends I need you to know i read standard deviation way back in 2013 when I was 15 and malleable. now i am 25 and taking electrical engineering courses, in an accelerated masters program, finally learning statistics for the first time and every. single. time. we discuss the concept of standard deviation my permanently altered brain thinks "yeah yeah the statistical significance of drunk mario kart with your graduate instructor yeah we all know it" anyway i also reread it on a nearly yearly basis if i had to wager
So I need you to know that this ask resulted in a good 15 minutes of texting back and forth, squealing. It's just so unreal to think that all this time later*, people are still reading and finding joy in our fic.
Thank you so much for reaching out and sending this ask 💖💖💖
* Standard Deviation is 10 years old!!! We began posting on November 14, 2012!!!
Happy Anniversary, SD 🎉🎉🎉
11 notes
·
View notes
Text
How i wish na sana may sd checker din sa life ko. Para matatap ako kung paulit-ulit and same-same lang ganap ko. Para di boring life.
2 notes
·
View notes
Text
This is a poll
4 notes
·
View notes
Text

Math / stats joke made my day 😂
5 notes
·
View notes
Text
Theory about polls
You know how there are polls where people are supposed to choose randomly but it almost all ways looks the same well what I think is happening is that we are getting standard deviation.

Here’s the standard deviation

AND HERE’S POLLS
LOOK THEY ARE THE SAME
3 notes
·
View notes
Text
In statistics, we have studied the classification of data into a grouped and ungrouped frequency distribution. These data can be pictorially represented using different graphs such as bar graphs, frequency polygons and histograms and so on. Also, we know that the three measures of central tendencies are mean, median and mode. In this article, we will discuss how to find the mean of the grouped data using different methods such as direct method, assumed mean method and step deviation method with many solved example.
Table of Content:
Mean
Standard deviation
Standard deviation of grouped data
Interpretation of Standard deviation
Steps to Calculate Standard Deviation for Grouped Data
Standard deviation of Grouped Data Example
Frequently Asked Questions – FAQs
Read more HERE
0 notes
Text
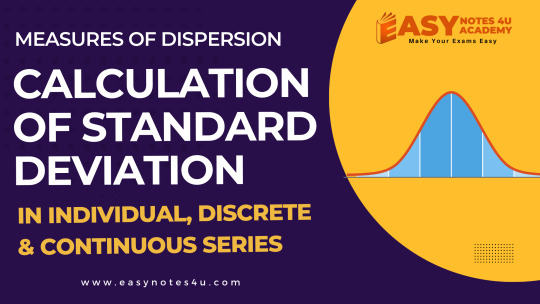
Calculation of Standard Deviation in Individual, Discrete & Continuous Series | Statistics
In this article, we will discuss about Calculation of Standard Deviation in Individual, Discrete & Continuous Series and measures of dispersion in Statistics. How to calculate Standard deviation
Standard Deviation
Standard deviation Measures of Dispersion in Statistics is the measure of the dispersion of statistical data. The standard deviation formula is used to find the deviation of the data…
View On WordPress
#Calculation of Standard Deviation#Calculation of Standard Deviation in Continuous Series#Calculation of Standard Deviation in Discrete Series#Calculation of Standard Deviation in Grouped Data#Calculation of Standard Deviation in Individual Series#Calculation of Standard Deviation in Ungrouped Data#How to Calculate Standard Deviation#How to Calculate Standard Deviation in Continuous Series#How to Calculate Standard Deviation in Discrete Series#How to Calculate Standard Deviation in Individual Series#Measures of Dispersion Statistics#Standard Deviation
0 notes
Text
youtube
The girl asked her what she studied and what she read so late at night
The thoughts that filled her notebooks and the stars that filled her eyes
But she said she couldn't tell her, she said she'd just get bored
It was story told in numbers not a story told in words
But the girl just laughed and leaned right back, said "Try me if you dare
Cause a story's when there's something more to share"
1 note
·
View note
Text
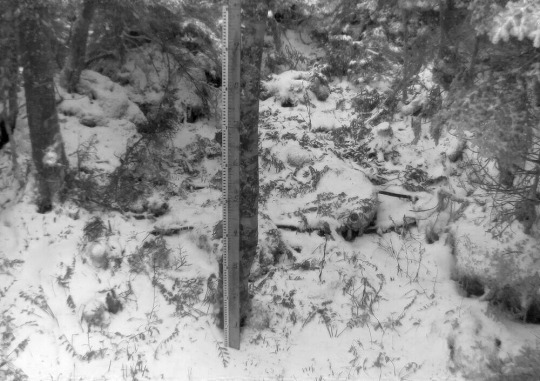
First Vermont snows for the 2023-2024 winter season
Today we got our first taste of the coming winter in the Northern Green Mountains. While Mt. Washington in New Hampshire has had a number of rounds of snow thus far in the autumn, and there were some reports of possible frozen precipitation in far northern Vermont a week or two ago, today saw the first notable accumulating snow on Mt. Mansfield. As of midafternoon today, Powderfreak reported that…
View On WordPress
#Autumn snow#averages#Comparison#Earliest snowfall#Fall#First snow#First Snowfall#Mean#Median#Mode#Mt. Mansfield#Mt. Mansfield Stake#Mt. Washington#Northern Vermont#Snow#Snowfall#Snowfall statistics#Standard deviation#Statistics#Vermont#Weather
0 notes
Text
Calculate Standard Deviation Calculator Easily With Our Free Calculator

Allcalculator.net is a reliable online platform that offers a wide range of statistical tools to help you with your data analysis needs. When it comes to understanding and calculating Standard Deviation, Allcalculator.net provides a user-friendly Sample Standard Deviation Calculator that makes the process quick and effortless. By using our calculator, you can gain valuable insights into the variability and dispersion of your dataset, allowing you to make informed decisions based on accurate statistical analysis. Join us at Allcalculator.net and simplify your statistical calculations today!
Understanding Standard Deviation:
Standard deviation measures the dispersion or spread of a dataset around its mean. It quantifies the average distance between each data point and the mean. A small standard deviation indicates that the data points are closely clustered around the mean, while a large standard deviation suggests a greater spread or variability.
Significance of Standard Deviation in Statistical Analysis:
Standard deviation plays a vital role in statistical analysis by providing crucial information about the variability and distribution of data. It helps identify outliers, assess the reliability of data, compare datasets, and make predictions based on the distribution's shape. By understanding the standard deviation, you can make more informed decisions and draw accurate conclusions from your data.
Introducing the Sample Standard Deviation Calculator:
Our Sample Standard Deviation Calculator is a free and user-friendly tool designed to simplify the process of calculating standard deviation. With just a few simple steps, you can obtain the standard deviation value of your sample, saving time and effort in manual calculations.
1. Inputting Data: To use our calculator, you need to input your sample data. Whether you have a small set of numbers or a large dataset, our calculator can handle it efficiently. Simply enter the values in the designated field, separating each data point with commas or spaces.
2. Calculating the Mean: Once you've entered your data, the calculator automatically calculates the mean (average) of the sample. The mean is a crucial component in the standard deviation calculation, as it serves as the reference point for measuring the deviation of each data point.
3. Calculating the Deviations: Next, the calculator computes the deviation of each data point from the mean. It determines how far each value deviates from the average, considering both positive and negative deviations.
4. Squaring the Deviations: To account for the magnitude of deviations, the calculator squares each deviation value. Squaring eliminates the negative signs and allows for a more accurate representation of the dispersion.
5. Summing the Squared Deviations: The squared deviations are then summed up to obtain the sum of squares. This step aggregates the dispersion values and prepares them for the final calculation.
6. Calculating the Sample Variance: The sample variance is determined by dividing the sum of squares by the number of data points minus one. This step calculates the average squared deviation from the mean.
7. Calculating the Sample Standard Deviation: Finally, the calculator takes the square root of the sample variance to obtain the sample standard deviation. This value represents the dispersion of the sample data and provides a measure of the spread around the mean.
Benefits of Using the Sample Standard Deviation Calculator:
Our Sample Standard Deviation Calculator offers several advantages when it comes to calculating standard deviation:
1. Accuracy and Efficiency: The calculator ensures accurate and precise calculations, eliminating the possibility of manual errors. It saves you valuable time and effort, especially when dealing with large datasets.
2. User-Friendly Interface: The calculator features a simple and intuitive interface, making it accessible to users with varying levels of statistical knowledge. You can easily input your data and obtain the standard deviation without any complex procedures.
3. Quick Insights into Data Variability: By calculating the standard deviation of your sample, you gain a deeper understanding of the dispersion and variability within your data. This insight allows for better decision-making and more accurate interpretations.
At Allcalculator.net, we understand the importance of accurate statistical analysis. Our Sample Standard Deviation Calculator empowers you to calculate the standard deviation of your sample effortlessly, giving you precise insights into data variability. With the user-friendly interface of Allcalculator.net, you can streamline your statistical calculations and make informed decisions based on reliable results. Unlock the power of statistics and take your data analysis to the next level with Allcalculator.net
#standard deviation calculator#standard deviation#mathcalculators#allcalculator#fitness and health calculators
0 notes
Text
Mastering Statistical Analysis: The Power of Standard Deviation

Introduction:
AllCalculator.net provides a comprehensive suite of statistical tools, including a user-friendly standard deviation calculator. By utilizing our platform, you can effortlessly calculate the standard deviation of your dataset, gaining valuable statistical insights. Understanding the significance of Standard Deviation is essential for accurate data analysis across diverse fields, and AllCalculator.net is here to simplify the process for you. With our intuitive interface and reliable calculations, mastering the application of standard deviation has never been easier.
What is Standard Deviation?
The standard deviation is a statistical measure that quantifies the amount of dispersion or spread in a dataset.
It tells us how much individual data points deviate from the mean, providing a comprehensive view of data distribution.
Calculating Standard Deviation:
To calculate the standard deviation, follow these steps:
Find the mean (average) of the dataset.
Subtract the mean from each data point and square the result.
Find the mean of the squared differences.
Take the square root of the mean to obtain the standard deviation.
Why is Standard Deviation Important?
It provides information about the data's consistency and variability.
A small standard deviation indicates that data points are close to the mean, representing low variability.
A large standard deviation suggests that data points are spread out from the mean, indicating high variability.
The Bell Curve (Normal Distribution):
Standard deviation is fundamental to understanding the bell curve, also known as the normal distribution.
In a normal distribution, about 68% of the data falls within one standard deviation from the mean, 95% within two standard deviations, and 99.7% within three standard deviations.
Use Cases in Real Life:
Finance: Assessing the risk associated with an investment portfolio.
Quality Control: Ensuring consistency and reliability in manufacturing processes.
Education: Analyzing exam scores to understand student performance.
Social Sciences: Measuring the spread of responses in surveys and studies.
Healthcare: Assessing the variability in patient outcomes for medical treatments.
Interpreting Standard Deviation:
A low standard deviation suggests that data points are close to the mean, indicating higher consistency and predictability.
A high standard deviation implies that data points are spread out, indicating greater variability and potential uncertainty.
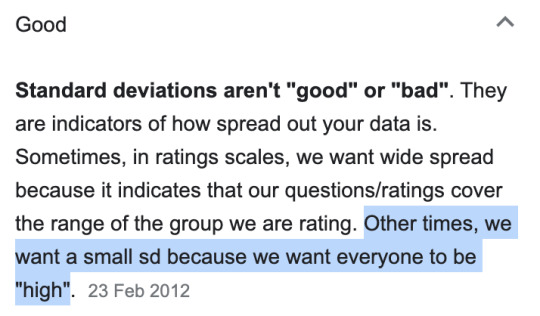
Common Misinterpretations:
Confusing standard deviation with the mean or range.
Assuming that a high standard deviation is always a negative aspect, which might not be the case in certain scenarios.
Conclusion:
Mastering the concept of standard deviation empowers you to gain profound insights from data, make informed decisions, and communicate results effectively. It serves as a powerful tool in statistical analysis, providing a deeper understanding of the data's spread and variability. Embrace the power of standard deviation and enhance your data analysis skills to unlock a world of valuable information.
#Standard Deviation#Auto loan calculator#Allcalculator#Financial Calculators#Math calculators#Fitness and Health Calculators
0 notes
Text
How can a standard deviation calculator help in comparing the variability of two or more data sets?

Allcalculator.net: The comparison of variability between two or more data sets is a crucial aspect of statistical analysis. Standard deviation is a widely used measure that quantifies the amount of dispersion or variability within a dataset. A Standard deviation calculator from Allcalculator.net plays a vital role in facilitating the comparison of variability between different data sets.
Understanding Standard Deviation
Allcalculator.net: Before delving into the role of a standard deviation calculator, it is essential to understand what standard deviation represents. Standard deviation measures the average amount of deviation or dispersion of data points from the mean of a dataset. In other words, it quantifies the spread of data around the mean value. A higher standard deviation indicates a greater dispersion, whereas a lower standard deviation suggests a more concentrated distribution.
Calculation of Standard Deviation
Allcalculator.net: Calculating the standard deviation manually can be time-consuming and prone to errors. However, with the advent of standard deviation calculators, this task has become much simpler and more efficient. A standard deviation calculator from Allcalculator.net utilizes the following steps to determine the standard deviation:
Comparing Variability Using a Standard Deviation Calculator
Allcalculator.net: A standard deviation calculator from Allcalculator.net proves to be invaluable when comparing the variability of two or more data sets. It simplifies the process and provides meaningful insights into the dispersion of the data. Here's how it aids in the comparison:
Conclusion
Allcalculator.net: In conclusion, a standard deviation calculator from Allcalculator.net serves as a valuable tool for comparing the variability of two or more data sets. It simplifies the calculation process and provides numerical values and visual representations that aid in quantitative and qualitative comparisons. By utilizing a standard deviation calculator from Allcalculator.net, analysts and researchers can gain insights into the dispersion of data and make informed decisions based on the variability observed.
0 notes
Text
Understanding Average, Variation, Capability and Their Applications in Process Improvement
Process improvement is a critical aspect of any organization, and understanding key statistical concepts like average, variation, and capability can help drive more efficient and effective decision-making. This article will explore these concepts, their calculations, and their applications in understanding and improving processes.
Section 1: Average and Variation – The Basics
Average, also…
View On WordPress
#average#Cp#Cpk#percent of failure#Process capability#Process Improvement#Quality Management#specification limits#Standard deviation#variation
0 notes
Text
Not sure about you but I needed this reminder today! Harness your superpowers, speak out, take up oxygen. It’s go time to take back our majority control!
youtube
#ted talks#democracy#wearethemajority#speak up#standard deviation#truth to power#sophia ongele#women in tech#gen z#do whatever you can#Youtube
1 note
·
View note
Last Seen Blogs

ittybittybumblebee
Wont u take me 2 FREAKYTOWN!!!🐝🔍🔬

nekarth
Paukarth

randomincorrectquotes10
Roa Apologist

minthappiness
af.

invesprop14
Property Investments Spain