#tablock
Note
hey sweet, would you recommend victorian sherlock fics?
Hey Lovely!
Sure, here are Victorian-adjacent fics:
Victorianlock
ACD Canon
Long ACD Canon (MFLs)
Victorian Meets Modern Johnlock
TABlock (Apr 2020)
Feel free to add more, my friends!
40 notes
·
View notes
Text
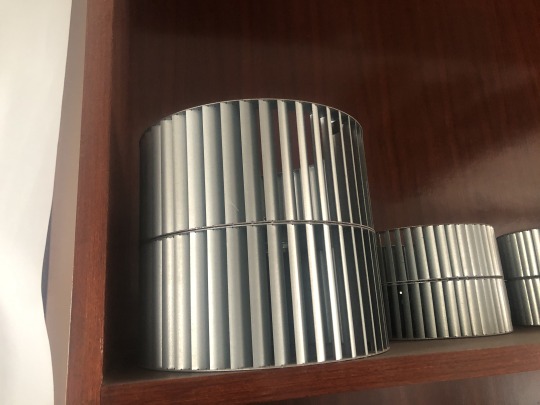
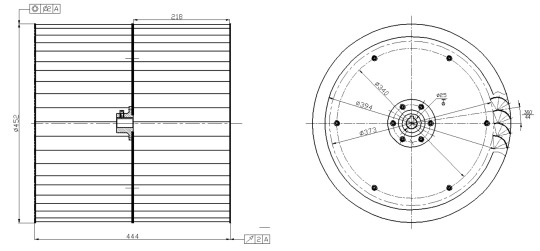
Galvanized Steel Centrifugal Fan Blades Multi-wing Impeller Double-Inlet Strip Type Blower Wheel
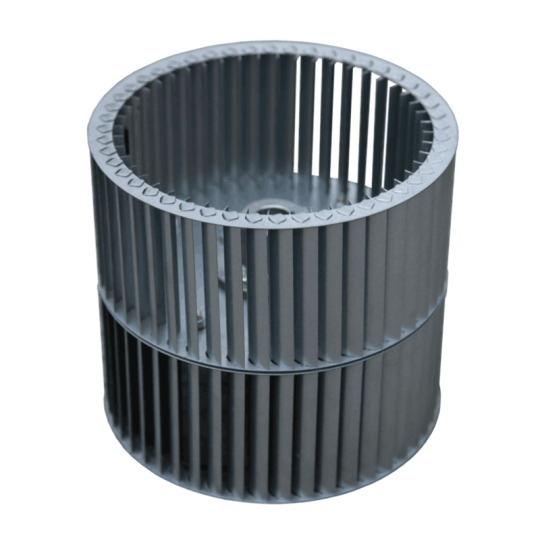

Centrifugal Fan Wheel — Fan Wheel / impeller. Centrifugal strip blower wheel · Centrifugal tablock blower wheel · strip dual wheel · tablock dual wheel · strong type · Centrifugal Strip
Application:
HVACR equipment, machinery, burner, oven, dryer, etc.
Function: Ventilation, Cooling, heating, air conditioning, draft inducing, air refreshing, air circulation.
Features:
Configuration Type: Single inlet, Twin-inlet
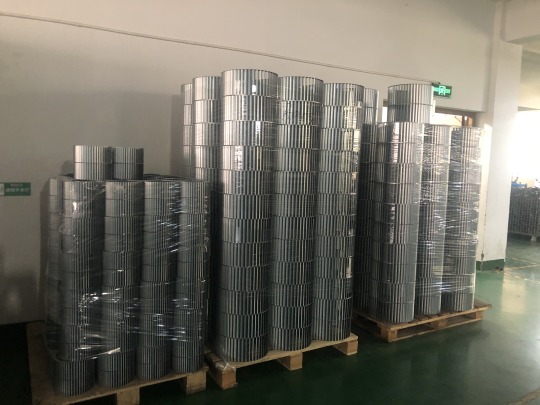
Order Information:
Minimum Order: Negotiate
OEM/ODM Product, Branded Product, Buyer's Label Offered
FOB: China Ningbo /China Shanghai
Customization Available
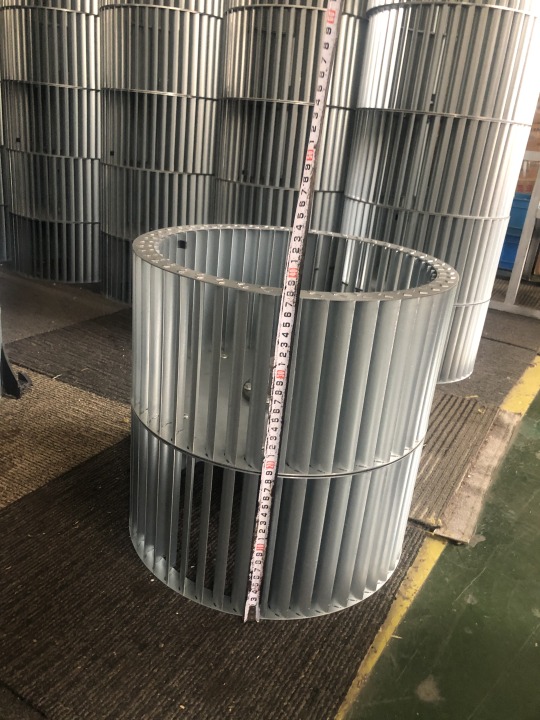
If you don't find the products you want in our range , please contact us for customization services freely . our profesional engineer team will work out a satisfied stuff with you .
Any dimensions of cross flow fans , perfromances of air flow ,air pressure ,noise level , installation positions or other functions are availble for your customizing

Read the full article
0 notes
Video
TabLosc Yangi TabLock buzadigan amallar , uning noyob to'liq tabiiy tarkibi tufayli, nikotin va boshqa toksinlardan tanani tozalaydi. Tabiiy o'simlik ekstraktlari yuqori va pastki nafas yo'llarining shilliq qavatlariga ehtiyotkorlik bilan g'amxo'rlik qiladi, shuningdek, nikotin parchalanishini oldini oladi. Bu sizga tez va og'riqsiz tarzda chekish istagidan xalos bo'lishga imkon beradi! Новый спрей TabLock, благодаря своему уникальному полностью натуральному составу, очищает организм от никотина и других токсинов. Натуральные экстракты трав бережно ухаживают за слизистой верхних и нижних дыхательных путей, а также предупреждают никотиновую ломку. Это позволяет быстро и безболезненно избавиться от тяги к курению!
1 note
·
View note
Text
Cannon Tab Lock Downrigger Base

Proveedor: Cannon
Tipo: Soportes y Abrazaderas para Camara
Precio: 28.30
Allows for easy removal and replacement of LakeTroll| SportTroll| Legacy EasiTroll| and MiniMag downriggers Built with heavyduty composite construction for corrosion and UV resistance
Incluye tablock base Se adapta laketroll| sporttroll| easitroll y minimag downriggers Construido con alta resistencia Lexan
Otras caracteristicas
Marca Cannon
Nombre de modelo Tab Lock
Dimensiones del articulo LxWxH 9 x 7 x 1 pulgadas
Color Black
Peso del producto 075 Libras
source https://www.electroika.com/products/cannon-tab-lock-downrigger-base
0 notes
Video
Спрей от курения TabLock - Бросьте курить сегодня!
0 notes
Link
0 notes
Link
SQL blocking means that one or multiple SQL queries are waiting for resources that are locked by another SQL Query. SQL blocking can affect data throughput and SQL Server responsiveness significantly. SQL Server response time is a measure that shows how long the end user that has executed a query must wait until he gets a response. So, in case that a query is doing nothing while waiting on another query to release the lock on the target resource, the response time increases thus making the SQL Server less responsive.
At the other hand, when talking about the data throughput, the measure is the number of simultaneous users who are logged and execute their queries in parallel without slowing down the SQL Server. Moreover, this is the SQL Server performance parameter that could be severely affected when blocking chain occurs. In scenarios were complex blocking chains occurs where one SQL query blocks another, and that query then blocks the third one, and the third one blocks the fourth one, and so on the blocking of the critical SQL Server resources for a prolonged time could occur. That creates a sort of artificial serialization in accessing key resources to the level where only one or eventually two users are effectively using SQL Server at one time.
Both of these scenarios are something that should be avoided and prevented.
SQL Server blocking is hard to identify and troubleshoot as it is hard to predict such behavior during development when only a limited number of users, quite often only one or two, are executing and testing the queries against the SQL Server at the same time. It is even worse to predict the situations where a single rarely executed query can cause a lengthy and complex blocking chain, making the troubleshooting process of bad SQL Server performance caused by such a rare and complex blocking chain annoying and often without results.
For more information SQL Server blocking read the Techniques to identify blocking queries and causes of SQL Server blocks article.
As it can be seen in the article, establishing the SQL Server blocks monitoring and tracking of even simple SQL Server blocks is not an easy and straightforward process. Even when the significant time is invested, results could be vague in most cases.
The situation where blocking chain is the cause of the issue is even more complicated for monitoring and troubleshooting. It’s quite tough to pinpoint the head blocker of the blocking chain when there are a number of processes involved. Moreover, if we add the possibility that deadlocks could be involved in the blocking chain as well, there could be quite a mess that has to be resolved and tracked.
Just as an example of the blocking chain, the scenario where a chain of the three SQL blocking processes will be simulated. Simulating such a blocking chain requires four separate connections to the SQL Server database to be created. That means that each query must be executed from a separate query tab in the SQL Server Management Studio. The Adventure Works database will be used in the blocking chain example.
SSMS tab1:
In this window, the query will start a transaction that will select from the database table and then for the purpose of easier simulation the waitfor delay command will be executed to create the 15 seconds wait for more comfortable work and unambiguous results presentation. The query will force the locks just for the purpose of the presentation. Otherwise, that is not recommended without a very particular reason.
begin tran select * from [Person].[Person] with (tablock, holdlock, xlock) waitfor delay '00:00:15' commit tran
SSMS tab2:
The query in tab 2 should be executed immediately after the previous query in tab 1. The transaction will try to select from the same table, and that will conflict with the transaction in the tab1 that holds the lock.
select * from [Person].[Person]
SSMS tab3:
Finally, in tab 3 the select query will be executed after the tab 2 query, and it will conflict with the query in the tab 2.
select * from [Person].[Person]
SSMS tab4:
This query in tab 4 is designed to display the active SQL blocking and should be executed after the query in tab 3 is executed. In our example, SQL Server used for this example had a very few active processes, so we were able to get insight straight into results.
Select Session_ID,Blocking_Session_ID From Sys.DM_Exec_Requests Where Session_ID > 50 And Blocking_Session_Id <> 0
What we can see from this result is that session 65 is waiting for session 56 to release the lock it holds on the resource, and it can be seen that session 56 is waiting for session 55 to release the acquired lock. Moreover, it is evident that session 52 is not waiting for anything, so one could assume that session 52 is the root cause of the SQL blocking or the so-called head blocker.
While this could look like a simple to troubleshoot, it is not the case in the real world. Production servers might have hundreds or thousands processes where numerous blocks could occur and blocking chains could reach tens of levels. Analyzing such results manually and figuring out relations and connections between processes cod take a lot of time and are prone to mistakes or misinterpretations.
At the top of that, this is not the information that is stored somewhere, so it doesn’t allow any insight into the history and frequency of SQL blockings and blocking chains.
Use ApexSQL Monitor to resolve SQL blocking
ApexSQL Monitor SQL blocking and blocking chain tracks are parts of the Query waits feature, or to better say the sub-features of the Query wait feature.
To access the blocking chain section of the Query waits feature:
Select the SQL Server that should be checked for the blocking chain in the server explorer pane on the left
From the Instance dashboard, select the Waits link in the Query section
In the Query waits page, select the Blocking chain radio button
If SQL blocking exists in the selected SQL Server, the information about the blocking chains displays
ApexSQL Monitor displays each SQL Server block in a hierarchical form that allows displaying the relations between all blocked and blockers SPIDs in a SQL blocking chain. The head blockers are displayed by default as they consist of the top nodes in the blocking chain hierarchy. The blocked SPIDs are displayed as parts of the sub-nodes in the blocking chain.
To check the blocked SPIDs, expand the blocking chain using the arrow icon left of the head blocker grid row:
The blocked SPIDs are nested underneath the head blocker, and any subsequent SPID is nested beneath its blocker in the chain, and it can be drilled down the chain by expanding any new subsequent SQL blocking where exists. Such an approach ensures the complete insight in the blocking chain at a first glance.
For each blocker and blocked query, ApexSQL Monitor allows reviewing details about that particular query by expanding the table via the arrow icon on the far right of the row.
The information in the Query details tab contains information about the query involved in the blocking chain that includes the wait type involved, wait time as well as the wait resource.
To help understand the Wait resource details and the way to decipher those, check the article INF: Understanding and resolving SQL Server blocking problems
As SQL blocking is a situation where a process is forced to wait another process to release the acquired lock, SQL Server logs that via the LCK_M_XXX wait type. The adequate wait type will be displayed, in accordance with what lock type blocked queries are waiting to acquire. Click the wait type link to display the helper pop up window with details related to that wait type as well as advice on potential resolution and links to external resources where some additional information about the involved wait type could be researched.
The SQL Text tab contains the full T-SQL of the query.
An additional ability of the block chain feature is that it allows the user to decide whether to display or not the blocking chains where the deadlock as a unique form of SQL blocking is involved. Unticking the Deadlock check box displays only the blocking chains where deadlocks are not involved. By default, the ApexSQL monitor displays all blocking chains including the ones where the deadlock is involved. In addition, each such blocking chain is marked with red DEADLOCK marking, as all blocking chains where the deadlocks are involved requires the special attention.
Quick tip:
The information about the deadlock involvement and ability to filter out blocking chains where deadlock is involved is possible only if the deadlock monitoring is turned on. To learn how to enable deadlock monitoring and track the deadlocks, read How to configure and use deadlock monitoring
Another way to access the blocking chain of interest is via the Blocked section of the Query waits page. While analyzing the blocked queries, if there is a need for a particular query to get details about its involvement in the blocking chain and how it is involved, use the Blocking chain link in the details of that blocked query details.
That will drill down to the specific blocking chain in the Blocking chain section that involves that particular SQL blocking situation.
In this way, only the particular blocking chain related to that particular SQL blocking will be displayed. That could be very useful for reducing the noise that other blocking chains could cause when analysis of the particular blocking chain situation is required.
0 notes
Note
O Steph, most beloved and mighty oracle of all things Johnlock - did you have a TABlock list somewhere or did I hallucinate that the way I regularly hallucinate a competently written S4?
Hi Nonny!
Ah, nope, you didn't dream it!
It's a small list, and really old, but I do have a TABlock/Victorianlock (June 2020) list!
If anyone has anything new to add based on TAB, PLEASE add some more! TAB fics are sadly lacking!
11 notes
·
View notes
Text
Tweeted
#SqlServerHelp - TABLOCKX vs TABLOCK + XLOCK https://t.co/P4BKW06KZm via SSC
— SQL Joker (@sql_joker) December 14, 2017
0 notes
Text
I am both deeply excited about Sentinel/Guide TABLock story & wondering if it's really *necessary*.
Which is to say, I'm certainly not backing out now...
1 note
·
View note
Text
1 réponse sur Vogels PTS 1224 TabLock iPad Pro 12.9
#technos http://dlvr.it/PSZD6P
0 notes
Photo

Look at http://ift.tt/2qn6zPB Professional PTS 1105 TabLock – Sicheres Gehäuse für Web-Tablet – für Apple iPad 2
0 notes
Text
Birchwood Casey PREGAME Tablock Turkey Kit
Birchwood Casey PREGAME Tablock Turkey Kit
Get Ready For Turkey Season With The New PREGAME™ Tablock™ Turkey Kit From Birchwood Casey® (ArmsVault.com) – The new PREGAME™ TabLock™ Turkey Kit from Birchwood Casey® provides hunters a quick and easy way to pattern their shotguns, or test new loads before the season. The TabLock backer eliminates the need to carry tape or a stapler to your shooting area. Birchwood Casey PREGAME Tablock Turkey…
View On WordPress
0 notes
Text
Get Ready for Turkey Season with Birchwood Casey’s PREGAME Tablock Turkey Kit https://t.co/5z0kEIiRll https://t.co/7lxw4F8yI6
Get Ready for Turkey Season with Birchwood Casey’s PREGAME Tablock Turkey Kit https://t.co/5z0kEIiRll http://pic.twitter.com/7lxw4F8yI6
— AmmoLand (@AmmoLand) March 20, 2017
0 notes
Text
Vogels PTS 1225 Safety Enclosure for Apple iPad Mini 4/Home Access Silver/Aluminium
More and more tablet PC’s like the iPad are used for public applications in retail shops, museums, showrooms and exhibitions. Vogel’s Professional has developed a secure enclosure for the iPad mini 4 called TabLock. TabLock prevents theft and unauthorized operation of the tablet. Made out of high quality aluminum and steel we designed a stylish and slim enclosure which protects the iPad in public…
View On WordPress
0 notes
Last Seen Blogs

hellowsallow
🕸sallow🕸

theunderestimator-3
THE UNDERESTIMATOR

ankororinn
近所の和菓子屋の豆大福、パン屋のあんぱん

opus-calorie-noodles-s
Division effectiveness outsourcing services, carbohydrate mixtur

kurixta
Kuri