#Doji candlestick
Text
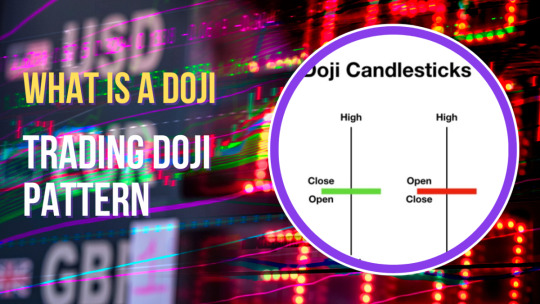
Doji Candlestick Patterns
Definition of Doji candlestick patterns
Doji candlestick patterns are a candlestick formation in technical analysis that occurs when the opening and closing prices of an asset are very close or identical, resulting in a small or non-existent body and long shadows or wicks on both sides. In other words, a Doji pattern appears when the opening and closing prices of an asset are almost the same,…

View On WordPress
0 notes
Text
Doji Candlestick Pattern and Trading Doji
The doji pattern is a candlestick pattern commonly used in technical analysis to indicate indecision in the market. It occurs when the opening price and the closing price of an asset are very close to each other, resulting in a candlestick with a very small real body.
The doji pattern can have different shapes, but the common characteristic is that it has a small real body, a long upper and…
View On WordPress
#candlestick patterns#Candlesticks#Doji#dragonfly doji#gravestone doji#learn technical analysis#long legged doji#Patterns#stock markets#stock trading#technical analysis#trading doji
3 notes
·
View notes
Text
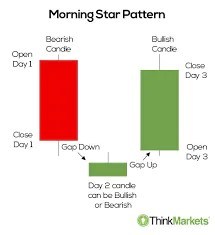
Mastering the Morning Star Pattern: A Step-by-Step Guide
Title: Mastering the Morning Star Pattern: A Step-by-Step Guide
Introduction:The world of technical analysis offers traders a plethora of tools to identify potential trend reversals and market opportunities. One such powerful pattern is the Morning Star pattern, a three-candlestick formation that signals a potential bullish reversal after a downtrend. In this step-by-step guide, we will explore…
View On WordPress
#bullish reversal#candlestick patterns#comprehensive trading approach.#confirmation factors#doji candle#downtrend#false signals#market sentiment#momentum shift#Morning Star pattern#position sizing#price action#resistance levels#Risk Management#spinning top#stop-loss#support levels#technical analysis#trading strategy#trading volume#Trend Reversal#volume analysis
0 notes
Text
This blog serves as a user-friendly guide for those just stepping into the world of forex trading. It meticulously breaks down the concept of forex trading signals, highlighting their immense value for beginners in navigating the intricate forex market. It emphasizes the advantages of using signals, such as their potential to save time, reduce emotional stress, and offer a learning opportunity for novice traders. Throughout the guide, the presence of Funded Traders Global as a supportive and educational partner is evident, ensuring that beginners gain confidence in their learn more...
#Analyzing Fundamental Data#Basics of Trading Signals#Candlestick patterns#Complete Guide to Forex Trading Signals for Beginners#currency pairs#Defining Forex Trading Signals#dojis#economic calendars#economic indicators#engulfing candles#Evaluating Sentiment Indicators#Forex charts#Forex News Sources#forex trading 2023#Forex Trading Signals for Beginners#Fundamental Analysis Signals#hammers#How to Choose a Reliable Provider#How to Find Forex Trading Signals#Interpreting Forex Trading Signals#MACD (Moving Average Convergence Divergence)#Market Analysis Tools#Market Sentiment Indicators#mood and perceptions of traders in the market#moving averages#Position Sizing Strategies#Risk Management in Forex Trading#RSI (Relative Strength Index)#Self-Analysis and Research#Sentiment Analysis Signals
0 notes
Text
Everything You Must Know About Doji Candlesticks
Everything You Must Know About Doji Candlesticks
The Doji candle is a sort of candlestick that belongs to the Japanese candlestick chart family. Its unique training and formation give it its name. This three-column candlestick pattern is often considered an indicator of a potential market trend reversal. It comes in two different variations, depending on the trend of the market at the time.
Identifying reversals
The Doji candlestick is a…

View On WordPress
0 notes
Text
Day Trading Forex: Everything You NEED To Know!
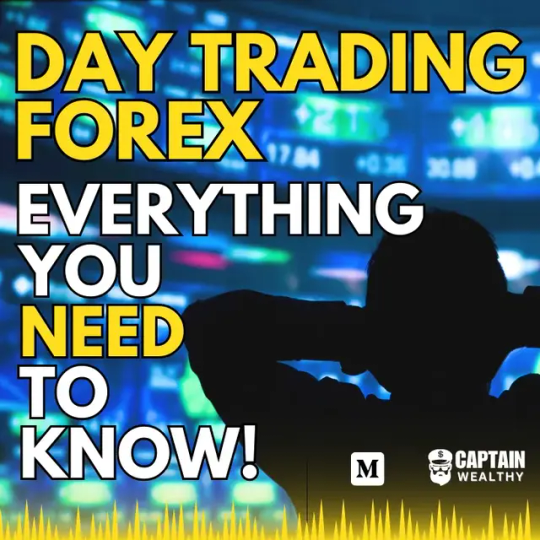
Are you interested in exploring the world of forex trading and want to take advantage of short-term price movements? Day trading forex might be the perfect strategy for you.
In this article, we will delve into the ins and outs of day trading forex, from understanding the forex market to developing effective strategies and managing risks. So let’s get started!
Introduction to Day Trading Forex
Benefits of Day Trading Forex
Day trading forex offers several advantages compared to other trading styles. Some of the benefits include:
Potential for quick profits: Day traders seek to profit from intraday price movements, aiming to close positions before the market closes.
High liquidity: The forex market is the largest and most liquid financial market globally, providing ample trading opportunities.
Flexibility: Traders can choose from a wide range of currency pairs and trade during different market sessions.
Lower capital requirements: Compared to other markets, forex trading allows for smaller initial investments, enabling traders to start with less capital.
Understanding Forex Market
To become a successful day trader in forex, it’s essential to have a solid understanding of the market dynamics.
Major Currency Pairs
The forex market consists of various currency pairs, but some major pairs dominate the trading volume. These include EUR/USD, GBP/USD, USD/JPY, and USD/CHF, among others. Familiarize yourself with these major currency pairs and their characteristics.
Market Hours
The forex market operates 24 hours a day, five days a week. However, certain trading sessions offer higher volatility and trading opportunities. The major sessions include the London, New York, Tokyo, and Sydney sessions. Knowing the active market hours can help you optimize your trading strategy.
Getting Started with Day Trading Forex
Before diving into day trading forex, you need to set up your trading infrastructure.
Setting Up a Trading Account
Choose a reputable forex broker that provides a user-friendly trading platform, competitive spreads, reliable execution, and comprehensive customer support. Ensure the broker is regulated by a recognized authority.
Selecting a Reliable Forex Broker
Research different forex brokers and compare their offerings, including trading costs, available currency pairs, leverage options, and deposit/withdrawal methods. Read reviews from other traders to gauge the broker’s reputation and reliability.
Funding Your Trading Account
Technical and Fundamental Analysis
Successful day trading forex relies on a combination of technical and fundamental analysis techniques.
Candlestick Patterns
Candlestick patterns provide valuable insights into price dynamics. Learn to identify patterns such as doji, engulfing, and hammer, which can signal potential reversals or continuations in the market.
Moving Averages
Moving averages help smooth out price fluctuations and identify trends. Experiment with different moving average periods, such as the 50-day and 200-day moving averages, to identify potential entry and exit points.
Support and Resistance Levels
Support and resistance levels are price levels at which the market tends to bounce or reverse. Identify key support and resistance levels using horizontal lines on your charts and incorporate them into your trading decisions.
Economic Indicators
Economic indicators, such as GDP growth, inflation rates, and employment data, can significantly impact currency prices. Stay informed about major economic releases and their potential effects on the forex market.
News Events
Popular Day Trading Strategies
To succeed in day trading forex, you need to implement effective trading strategies that suit your trading style and risk appetite.
Scalping
Scalping involves making multiple trades within a short time frame, aiming to capture small profits from quick price movements. Scalpers often rely on tight spreads and fast execution to capitalize on these rapid price changes.
Breakout Trading
Breakout traders look for significant price breakouts above resistance or below support levels. They aim to enter trades early in a new trend to maximize profit potential. Breakout strategies often utilize technical indicators to confirm breakouts.
Momentum Trading
Risk Management in Day Trading Forex
Managing risk is crucial in day trading forex to protect your capital and preserve long-term profitability. Here are a few ways to help manage your risk:
Setting Stop-Loss Orders
Always use stop-loss orders to limit potential losses on each trade. Determine an appropriate level for your stop-loss order based on your risk tolerance and the characteristics of the currency pair you are trading.
Implementing Proper Position Sizing
Calculate your position size based on the size of your trading account and the percentage of capital you are willing to risk per trade. Avoid overexposing your account by trading positions that are too large relative to your account size.
Managing Leverage
Emotions and Psychology in Day Trading
Controlling emotions and maintaining a disciplined mindset are crucial in day trading forex.
Controlling Greed and Fear
Greed and fear are common emotions that can cloud judgment and lead to irrational trading decisions. Develop self-awareness and discipline to overcome these emotions and make objective trading choices.
Maintaining Discipline
Stick to your trading plan and avoid impulsive trades driven by emotions. Follow your strategy and trading rules consistently, even when faced with market fluctuations.
Developing a Trading Plan
Building a Trading Routine
Establishing a structured trading routine can help you stay organized and make better trading decisions.
Pre-market Analysis
Before the market opens, conduct a thorough analysis of the currency pairs you are interested in trading. Review economic calendars, technical indicators, and news events that may impact the market.
Executing Trades
Once the trading day begins, execute your trades based on your predefined strategies and analysis. Stick to your risk management rules and avoid impulsive trades based on emotions.
Reviewing and Analyzing Trades
Resources and Tools for Day Traders
Several resources and tools can assist day traders in their trading activities.
Educate Yourself
It is important to stay up to date and learn constantly when you are day trading. It’s always a good idea to begin your journey with a day trading forex course such as the Cash on Demand Trades Education or The Ultimate Forex Strategy
Trading Platforms
Choose a user-friendly trading platform that provides real-time charts, technical indicators, order execution capabilities, and access to relevant news and analysis.
Charting Software
Utilize charting software to analyze price patterns, apply technical indicators, and identify potential trade setups. Popular charting platforms include MetaTrader, TradingView, and NinjaTrader.
Economic Calendars
Stay informed about upcoming economic events and news releases using economic calendars. These calendars provide information on scheduled economic indicators, central bank meetings, and other market-moving events.
Online Communities and Forums
Engage with other day traders through online communities and forums. Participate in discussions, share ideas, and learn from experienced traders. Collaborating with like-minded individuals can enhance your trading knowledge and skills.
Tips for Successful Day Trading
Consider the following tips to improve your day trading performance:
Stay Informed and Educated: Continuously update your knowledge about the forex market, trading strategies, and risk management techniques. Follow reputable sources of market analysis and stay informed about economic developments.
Practice Risk Management: Always prioritize risk management to protect your capital. Implement appropriate stop-loss orders, manage your position sizes, and avoid overtrading.
Start with Small Positions: When starting out, focus on small position sizes to minimize risk. Gradually increase your position sizes as you gain experience and confidence in your trading abilities.
Keep Emotions in Check: Emotions can cloud judgment and lead to poor trading decisions. Maintain emotional discipline, stick to your trading plan, and avoid impulsive actions driven by fear or greed.
Review and Learn from Your Trades: Regularly review your trading performance, analyze your trades, and identify areas for improvement. Learn from both successful and unsuccessful trades to refine your strategy.
Final Thoughts
Day trading forex offers exciting opportunities for traders to profit from short-term price movements in the forex market.
By understanding the market dynamics, implementing effective strategies, managing risks, and maintaining emotional discipline, you can increase your chances of success in day trading forex.
4 notes
·
View notes
Text
Understanding the Three Inside Down Candlestick Pattern in Stock Trading

In the intricate world of stock trading, where every fluctuation and pattern holds potential significance, candlestick patterns stand out as invaluable tools for traders. Among these patterns, the Three Inside Down pattern is notable for its indication of potential trend reversal. With its distinct formation and implications, understanding this pattern can be a valuable asset for traders seeking to navigate the volatile waters of the stock market.
Unveiling the Three Inside Down Pattern:
The Three Inside Down pattern is a bearish reversal pattern that typically forms at the peak of an uptrend. It consists of three candles that provide traders with valuable insights into market sentiment and potential shifts in direction.
First Candle:
The pattern begins with a tall bullish candle, indicating a strong upward movement in the market. This candle signifies the continuation of the existing uptrend, with buyers dominating the market and pushing prices higher.
Second Candle:
Following the bullish momentum of the first candle, the second candle forms as a small-bodied candle, often referred to as a Doji or a spinning top. This candle represents indecision in the market, with neither buyers nor sellers exerting significant control over price movement. It serves as an early sign of potential weakening in the uptrend.
Third Candle:
The third candle is where the pattern's significance becomes apparent. It is a bearish candle that closes below the midpoint of the first candle's body. This candle's appearance confirms the reversal of the previous uptrend and indicates a shift in momentum from bullish to bearish. The closing price of the third candle is often near its low, further emphasizing selling pressure.
Interpretation and Implications:
The formation of the Three Inside Down pattern carries several implications for traders:
Reversal Signal:
The primary significance of the Three Inside Down pattern is its indication of a potential trend reversal. After a sustained uptrend, the emergence of this pattern suggests that selling pressure is beginning to outweigh buying pressure, signaling a possible transition to a downtrend.
Confirmation of Bearish Sentiment:
The bearish nature of the pattern reinforces negative market sentiment. As the third candle closes below the midpoint of the first candle, it reflects a decisive shift in favor of sellers, highlighting their increasing dominance in the market.
Entry and Exit Points:
For traders, recognizing the Three Inside Down pattern provides valuable entry and exit points for positions. Traders may consider entering short positions or liquidating existing long positions upon the completion of the pattern, anticipating further downward movement in prices.
Risk Management:
Incorporating the Three Inside Down pattern into risk management strategies can help traders mitigate potential losses. Implementing stop-loss orders above the high of the third candle can limit downside risk in the event of a failed reversal.
Limitations and Considerations:
While the Three Inside Down pattern offers valuable insights into market dynamics, it is essential to consider its limitations and the broader market context:
Confirmation Needed:
Like any technical indicator, the Three Inside Down pattern requires confirmation from additional signals or factors. Traders should look for corroborating evidence, such as volume analysis or support and resistance levels, to strengthen the validity of the reversal signal.
False Signals:
As with any trading pattern, false signals can occur, leading to losses if traders rely solely on the Three Inside Down pattern without considering other factors. It is crucial to exercise caution and use the pattern as part of a comprehensive trading strategy.
Market Conditions:
Market conditions, such as volatility and liquidity, can influence the effectiveness of the Three Inside Down pattern. Traders should adapt their strategies and risk management techniques accordingly, taking into account the prevailing market environment.
Conclusion:
The Three Inside Down candlestick pattern stands as a powerful tool for traders seeking to identify potential trend reversals in the stock market. Its distinct formation and implications provide valuable insights into shifting market dynamics, allowing traders to make informed decisions about their positions.
However, like any trading indicator, the Three Inside Down pattern is not without its limitations. Traders must exercise caution, conduct thorough analysis, and incorporate risk management strategies to navigate the complexities of the market successfully.
By understanding the nuances of the Three Inside Down pattern and its implications, traders can enhance their ability to identify profitable trading opportunities while effectively managing risk in an ever-changing market landscape.
0 notes
Text
Unlocking the Mysteries of Crypto Candlestick Charts with Ailtra
Understanding Candlestick Charts
Before we dive into the specifics of crypto candlestick charts, let’s take a moment to understand what they are and how they work. Candlestick charts originated in Japan in the 18th century and were used to track the price of rice. Today, they are widely used in financial markets, including the world of cryptocurrencies.
At first glance, candlestick charts may seem intimidating, with their various shapes and colors. However, once you understand the basic components, they become much easier to interpret. Each candlestick represents a specific time period, such as one hour, one day, or one week. The body of the candlestick shows the opening and closing prices for that period, while the wicks, or shadows, indicate the high and low prices.
The Power of Patterns
One of the key advantages of candlestick charts is their ability to reveal patterns that can signal potential market movements. There are numerous candlestick patterns, each with its own significance. For example, a “bullish engulfing” pattern occurs when a small red candlestick is followed by a larger green candlestick, indicating a potential reversal from bearish to bullish momentum. Conversely, a “bearish engulfing” pattern suggests a shift from bullish to bearish momentum.
Other common candlestick patterns include the “doji,” which occurs when the opening and closing prices are virtually the same, signaling indecision in the market, and the “hammer,” which has a small body and a long lower wick, indicating a potential reversal from a downtrend to an uptrend.
Using Candlestick Charts with Ailtra
At Ailtra, we understand the importance of leveraging advanced tools and technologies to stay ahead in the crypto markets. That’s why we’ve developed cutting-edge software that integrates seamlessly with candlestick charts, providing traders with real-time insights and analysis.

Conclusion
In conclusion, crypto candlestick charts are a powerful tool for traders looking to gain an edge in the volatile world of cryptocurrency trading. By understanding how to read and interpret these charts, traders can identify patterns and trends that can help them make informed decisions. With Ailtra’s advanced platform, traders can take their analysis to the next level, empowering them to navigate the complex crypto markets with confidence.
So why wait? Sign up for Ailtra today and unlock the full potential of crypto candlestick charts!
0 notes
Text
User Technical Analysis for Options Trading
Technical analysis can be a valuable tool for options traders, providing insights into market trends, price patterns, and potential entry and exit points. Here are some practical topics within technical analysis for options trading:
1. Chart Patterns: Understanding common chart patterns like head and shoulders, triangles, flags, and channels, and how they can indicate potential price movements.
2. Support and Resistance Levels: Identifying significant support and resistance levels using historical price data, which can help in determining entry and exit points for options trades.
3. Moving Averages: Learning how to use simple moving averages (SMA) and exponential moving averages (EMA) to identify trends and potential reversals in the underlying asset's price.
4. Relative Strength Index (RSI): Utilizing the RSI indicator to gauge overbought or oversold conditions in the market, which can help in timing options trades.
5. Moving Average Convergence Divergence (MACD): Understanding how the MACD indicator can signal changes in momentum and potential trend reversals, providing valuable insights for options traders.
6. Bollinger Bands: Exploring how Bollinger Bands can help identify volatility and potential price breakouts, assisting options traders in setting appropriate strike prices and expiration dates.
7. Fibonacci Retracement Levels: Using Fibonacci retracement levels to identify potential areas of support and resistance based on the Fibonacci sequence, aiding in options trading decisions.
8. Volume Analysis: Analyzing trading volume patterns to confirm price trends and potential reversals, providing additional confirmation for options trading strategies.
9. Candlestick Patterns: Studying candlestick patterns such as doji, engulfing patterns, and hammers, which can provide insights into market sentiment and potential price reversals.
10. Option Chain Analysis: Integrating technical analysis with option chain data to identify potential support or resistance levels based on open interest and volume at different strike prices, enhancing options trading decisions.
By mastering these topics within technical analysis, options traders can develop a more comprehensive understanding of market dynamics and improve their ability to make informed trading decisions.
0 notes
Text
Pancakeswap price faces resistance near 38.2% Fibonacci retracement; What to expect next?
PancakeSwap's price faces downward pressure despite the burning of $28 million worth of tokens, as U.S. equities show a mild negative bias. The token experienced a bearish start to the week, finding support around the 21-day and 50-day SMA crossover on the 4-hour chart. However, a daily candlestick above $3.50 could shift the bias in favor of bulls, although the longer-term trend remains downward.
As of writing, CAKE/USD trades at $3.43, down 0.34% for the day, with a 24-hour trading volume of $25,698,034, indicating weakening bearish momentum.
Despite the significant token burn, PancakeSwap's price remains relatively unaffected. Trading near a critical resistance level, the token struggles to sustain momentum above the 9-day and 21-day SMAs, with the formation of a Doji candlestick signaling investor indecision.
Having declined by approximately 26% from its recent high, the price currently pauses near the 38.2% Fibonacci retracement level, posing as a critical resistance zone. A breach below $3.40 could continue the downside movement, testing support at $3.30 and potentially $3.10.
Conversely, a shift in sentiment and a daily close above $3.50 could favor buyers, targeting the 0.50% Fibonacci retracement at $3.55 and the horizontal resistance zone at $3.70.
The 4-hourly RSI indicates sideways movement below 50, suggesting potential price correction upon any downtick in the oscillator.
0 notes
Text
0 notes
Text
Doji Candlestick Patterns
Definition of Doji candlestick patterns
A Doji candlestick pattern is a candlestick formation in technical analysis that occurs when the opening and closing prices of an asset are very close or identical, resulting in a small or non-existent body and long shadows or wicks on both sides. In other words, a Doji pattern appears when the opening and closing price of an asset are almost the same,…

View On WordPress
0 notes
Text
Dragonfly Doji Pattern
The Dragonfly Doji is a significant candlestick pattern in technical analysis that provides traders with valuable insights into market sentiment and potential trend reversals. This pattern is characterized by a single candlestick with a small body, long lower shadow, and little to no upper shadow. The overall appearance of the candlestick resembles a dragonfly, hence the name.
Here’s a detailed…

View On WordPress
#Bullish Reversal#Candlestick Charting#candlestick patterns#Chart Patterns#day trading#dragonfly doji#Financial Markets#Japanese Candlesticks#Market Analysis#Market Trends#Market Volatility#price action#Price Patterns#stock market#swing trading#technical analysis#Trading Patterns#Trading Psychology#trading signals#Trading Strategies
0 notes
Link
After forming successive Doji candlestick patterns on the weekly chart for the previous three weeks, Bitcoin (BTC) is heading in the right direction to finish the week on a optimistic word. That is an early signal that the uncertainty between the bulls and the bears is resolving to the upside.Though the restoration remains to be in its early levels, the Federal Open Market Committee assembly on Sep. 20 may increase volatility. The vast majority of the market members anticipate the Federal Reserve to keep up a establishment on charges however surprises may come up throughout Fed Chair Jerome Powell’s press convention following the speed choice.Crypto market information every day view. Supply: Coin360Bitcoin’s restoration from the robust help close to $24,800 has ignited shopping for curiosity in choose altcoins, that are offering buying and selling alternatives. For these altcoins to proceed their upward trajectory, Bitcoin wants to keep up above $26,500.Might Bitcoin’s reduction rally choose up momentum, triggering shopping for in choose altcoins? Let’s research the charts of top-5 cryptocurrencies which are exhibiting promise within the close to time period.Bitcoin value evaluationBitcoin rose above the 20-day exponential transferring common ($26,303) on Sep. 14, indicating that the promoting stress is decreasing. Since then, the bulls thwarted a number of makes an attempt by the bears to yank the worth again under the 20-day EMA.BTC/USDT every day chart. Supply: TradingViewPatrons will attempt to construct upon their benefit and drive the BTC/USDT pair to the 50-day easy transferring common ($27,295). This stage might act as a minor hurdle but when overcome, the pair is prone to attain $28,143. The bears are anticipated to defend this stage with vigor.If bears need to keep the higher hand, they must sink the worth under the 20-day EMA. Which will entice the aggressive bulls and open the doorways for a possible retest of the pivotal help at $24,800.BTC/USDT 4-hour chart. Supply: TradingViewThe value has been buying and selling above the 20-EMA on the 4-hour chart indicating that the bulls are shopping for on dips. This implies that the merchants anticipate the restoration to proceed. If consumers clear the hurdle at $26,900, the pair might climb to $27,600 and finally to $28,143.If bears need to make a comeback, they must sink and maintain the worth under the 20-EMA. Such a transfer will clear the trail for an additional fall to the 50-SMA and later to the robust help zone between $25,600 and $25,300.Maker value evaluationPatrons propelled Maker (MKR) above the 50-day SMA ($1,162) on Sep. 15, indicating that the bulls try to take cost.MKR/USDT every day chart. Supply: TradingViewThe MKR/USDT pair is on its technique to $1,370. This stage is prone to witness a tricky battle between the bulls and the bears. If the bulls don't hand over a lot floor from this stage, the chance of a break above it will increase. If that occurs, the pair may choose up momentum and sprint towards $1,759.The essential stage to observe on the draw back is the 20-day EMA ($1,162). If this stage cracks, it would counsel that the pair might swing inside the big vary between $980 and $1,370 for a while.MKR/USDT 4-hour chart. Supply: TradingViewThe 4-hour chart exhibits that the bulls stay in command however the RSI close to the overbought territory suggests a minor correction or consolidation within the close to time period. The 20-EMA stays the important thing stage to observe on the draw back. A break and shut under it may point out the beginning of a deeper correction towards the 50-SMA.As a substitute, if the worth bounces off the 20-EMA, it will likely be an indication that the bulls proceed to purchase the dips. Which will begin a rally towards the stiff overhead resistance at $1,370.Aave value evaluationAave (AAVE) surged above the transferring averages on Sep. 16, indicating that the bulls have made their transfer. Nonetheless, the lengthy wick on the day’s candlestick exhibits promoting at greater ranges.AAVE/USDT every day chart. Supply: TradingViewA minor benefit in favor of the bulls is that they didn't permit the bears to make a comeback and are once more attempting to maintain the worth above the 50-day SMA ($59). In the event that they succeed, the AAVE/USDT pair is prone to speed up towards $70 and later to $76.The 20-day EMA ($56) is the vital help to regulate within the close to time period. If the worth skids under this stage, it would counsel that bears are lively at greater ranges. That might sink the pair to the strong help at $48.AAVE/USDT 4-hour chart. Supply: TradingViewThe 4-hour chart exhibits that the bulls just lately bought the pullback to the 20-EMA, indicating that the sentiment has turned optimistic. Patrons will attempt to propel the worth above the resistance at $63. If they'll pull it off, the pair may soar to $70.Opposite to this assumption, if the worth turns down and breaks under the 20-EMA, it would counsel that demand dries up at greater ranges. The pair may then slide to the 50-SMA which can appeal to consumers.Associated: How low can the Bitcoin value go?THORChain value evaluationTHORChain (RUNE) has staged a sensible restoration prior to now few days, indicating that the consumers try a comeback.RUNE/USDT every day chart. Supply: TradingViewThe up-move is nearing the strong resistance at $2, which is prone to act as a significant roadblock. If the worth turns down sharply from $2, it would point out that the bulls are speeding to the exit. That might tug the worth all the way down to the 20-day EMA ($1.62).Contrarily, if the RUNE/USDT pair doesn't hand over a lot floor from the present stage, it would counsel that the bulls are holding on to their positions as they anticipate the rally to increase additional. If $2 is taken out, the pair may begin a brand new uptrend to $2.30 and subsequently to $2.80.RUNE/USDT 4-hour chart. Supply: TradingViewThe 4-hour chart exhibits that the $2 stage is appearing as a resistance. The value might pull again to the 20-EMA, which is prone to act as a robust help. If the worth rebounds off this stage with energy, the bulls will once more try to beat the impediment at $2. In the event that they handle to do this, the pair might soar towards $2.30.The primary signal of weak spot can be a break and shut under the 20-EMA. That might tempt a number of short-term merchants to guide earnings. The pair might then stoop to the 50-SMA.Render value evaluationRender (RNDR) broke out and closed above the 50-day SMA ($1.58) on Sep. 15, indicating that the promoting stress could possibly be decreasing.RNDR/USDT every day chart. Supply: TradingViewThe transferring averages are on the verge of a bullish crossover and the RSI is within the optimistic territory indicating that bulls have a slight edge. If the worth turns up from the 20-day EMA ($1.50), it would counsel a change in sentiment from promoting on rallies to purchasing on dips. That might begin a stronger restoration to $1.83 after which to $2.20.This optimistic view may invalidate within the close to time period if the worth continues decrease and breaks under the transferring averages. The RNDR/USDT pair may then plummet to $1.38 and later to $1.29.RNDR/USDT 4-hour chart. Supply: TradingViewThe transferring averages on the 4-hour chart are sloping up and the RSI is within the optimistic territory, indicating benefit to consumers. The primary help to observe on the draw back is the 20-EMA. If the worth turns up from this stage, it would sign that bulls proceed to view the dips as a shopping for alternative. That will increase the potential of a rally to $1.77.Quite the opposite, if the 20-EMA provides method, the pair may slide to the 50-SMA. This is a crucial stage for the bulls to defend as a result of a break under it could sink the pair to $1.39.This text doesn't comprise funding recommendation or suggestions. Each funding and buying and selling transfer includes danger, and readers ought to conduct their very own analysis when making a call.Supply: https://cointelegraph.com/information/bitcoin-price-holds-26k-as-mkr-aave-rune-and-rndr-flash-bullish-signals
0 notes
Text
What is candlestick in share market?

In the share market, a candlestick is a type of financial chart used to represent the price movements of a security, such as a stock, bond, commodity, or currency pair, over a specific period of time. Candlestick charts are widely used by traders and investors to analyze price action, identify trends, and make trading decisions.
Each candlestick on a candlestick chart provides information about the open, high, low, and close prices of the security for the given time period. The candlestick consists of two main parts:
Body: The body of the candlestick represents the price range between the opening and closing prices of the security during the specified time period. The body is typically filled or colored differently to indicate whether the closing price was higher (bullish) or lower (bearish) than the opening price. If the closing price is higher than the opening price, the body is usually filled or colored, indicating bullishness. If the closing price is lower than the opening price, the body is usually empty or colored differently, indicating bearishness.
Wicks (or Shadows): The wicks, also known as shadows, are the thin lines extending above and below the body of the candlestick. The upper wick represents the highest price reached during the time period, while the lower wick represents the lowest price reached. The length of the wicks provides information about the price volatility and the trading range during the specified time period.
Candlestick charts are valuable tools for technical analysis because they provide visual representations of price movements and patterns that can help traders and investors interpret market sentiment and predict future price movements. Different candlestick patterns convey different signals about market dynamics, and traders use these patterns to make informed decisions about buying, selling, or holding securities.
Some common candlestick patterns include:
Bullish Engulfing: A bullish engulfing pattern occurs when a large bullish candlestick completely engulfs the previous smaller bearish candlestick. It suggests a potential reversal from a downtrend to an uptrend.
Bearish Engulfing: A bearish engulfing pattern occurs when a large bearish candlestick completely engulfs the previous smaller bullish candlestick. It suggests a potential reversal from an uptrend to a downtrend.
Doji: A doji candlestick has a small body with wicks extending on both sides. It indicates indecision in the market and suggests potential reversals or trend continuation depending on its placement within the price action.
One of the best way to start studying the stock market to Join India’s best comunity classes Investing daddy invented by Dr. Vinay prakash tiwari . The Governor of Rajasthan, the Honourable Sri Kalraj Mishra, presented Dr. Vinay Prakash Tiwari with an appreciation for creating the LTP Calculator.
LTP Calculator the best trading application in India.
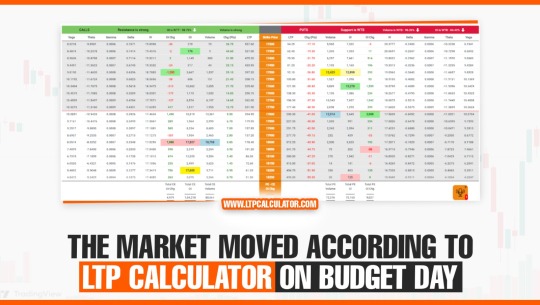
You can also downloadLTP Calculator app by clicking on download button.

These are just a few examples of candlestick patterns, and there are many more that traders use to analyze market behavior and make trading decisions in the share market.
0 notes
Text
Navigating Cryptocurrency Trading Graphs: Building a Diverse Portfolio
Cryptocurrency trading has emerged as a lucrative investment avenue, drawing attention from seasoned investors to newcomers seeking to capitalize on the digital asset revolution. Central to successful trading in this domain is the ability to interpret and analyze cryptocurrency trading graphs effectively. By delving into these charts, investors can glean valuable insights to inform their trading decisions and develop a diverse portfolio that balances risk and reward.
Understanding Cryptocurrency Trading Graphs:
Cryptocurrency trading graphs provide a visual representation of price movements over time. They typically display historical price data in the form of candlestick charts, line graphs, or other charting techniques. Each type offers unique advantages in analyzing market trends and identifying potential trading opportunities.
Candlestick charts, for instance, are widely used in cryptocurrency trading due to their ability to convey a wealth of information within a single data point. Each candlestick represents a specific time period, with the body indicating the opening and closing prices and the wicks or shadows depicting the price range within that period. By observing patterns such as bullish engulfing, bearish harami, or doji, traders can anticipate market sentiment and make informed decisions tradetrek.
Line graphs, on the other hand, offer a simplified view of price movements by connecting the closing prices over time. While they lack the granularity of candlestick charts, line graphs provide a clear depiction of long-term trends, enabling traders to identify support and resistance levels and assess overall market direction.

Developing a Varied Portfolio:
Building a diversified portfolio is essential for mitigating risk and maximizing returns in the volatile world of cryptocurrency trading. A well-rounded portfolio should encompass a mix of assets across different categories, including established cryptocurrencies like Bitcoin and Ethereum, promising altcoins, and stablecoins pegged to fiat currencies.
Bitcoin, as the pioneer cryptocurrency, serves as the cornerstone of many portfolios due to its widespread adoption and established track record. With its finite supply and growing institutional interest, Bitcoin offers a hedge against inflation and economic uncertainty, making it a favored store of value asset.
Ethereum, the second-largest cryptocurrency by market capitalization, holds immense potential as the foundation for decentralized applications (DApps) and smart contracts. Investing in Ethereum allows traders to participate in the burgeoning world of decentralized finance (DeFi) and non-fungible tokens (NFTs), driving innovation and growth in the cryptocurrency ecosystem.
In addition to blue-chip cryptocurrencies, diversifying into promising altcoins can provide exposure to high-growth opportunities. Conducting thorough research and due diligence is crucial when selecting altcoins, as the market is rife with projects of varying quality and legitimacy. Look for altcoins with strong fundamentals, innovative technology, and a dedicated community to maximize the potential for returns.
Stablecoins play a vital role in risk management within a cryptocurrency portfolio, offering a reliable means of preserving capital during market downturns. Pegged to stable assets like the US dollar or other fiat currencies, stablecoins provide stability and liquidity, allowing traders to swiftly exit volatile positions and minimize losses.
Conclusion:
Navigating cryptocurrency trading graphs is an indispensable skill for investors seeking to thrive in the dynamic and rapidly evolving digital asset market. By mastering chart analysis techniques and developing a diverse portfolio spanning established cryptocurrencies, promising altcoins, and stablecoins, traders can navigate market fluctuations with confidence and capitalize on lucrative investment opportunities. Remember to exercise caution, conduct thorough research, and diversify your holdings to optimize risk-adjusted returns in the exciting world of cryptocurrency trading.
1 note
·
View note
Last Seen Blogs

mrfrblogresearch02
priyamrfrblog

sammmb33
Untitled

classystrawberryfart
Untitled

claudvain
claudevain supreme

ym021
Michy