#IchimokuCloud
Text
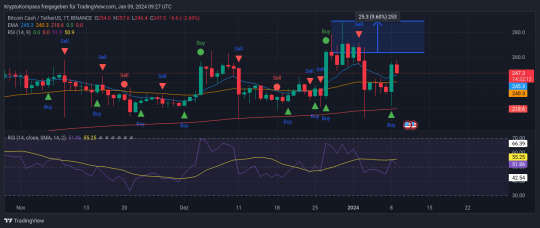
Bitcoin Cash Chartanalyse: Der Start des Bullenlaufs?
Die technische Analyse von Bitcoin Cash lässt auf einen bevorstehenden Ausbruch hoffen. Am 27. Dezember 2023 generierte der Markt ein Buy-Signal, als die Kerze bei 229,20 Dollar eröffnete und beim Candle Close bei 264,10 Dollar endete. Eine entscheidende Entwicklung, da an diesem Tag der 50er EMA (Orange) und der 10er EMA erfolgreich überwunden wurden.

Verlaufshoch und Konsolidierung: Chancen und Herausforderungen
Am 30. Dezember 2023 erreichte Bitcoin Cash ein Verlaufshoch von 288 Dollar, ein beeindruckender Zugewinn von knapp unter 10%. Diese Gewinne konnten dank eines entsprechenden Hebels erheblich gesteigert werden. Die nachfolgende Konsolidierung führte zu einer Korrektur am 3. Januar, die den Kurs auf 211,30 Dollar zurückführte, wobei der 50er EMA als solide Unterstützung diente.
Erneutes Durchstarten und Widerstandsdurchbruch
Die Konsolidierung setzte sich fort, bis der Kurs gestern erneut durchstartete. Nach einem kurzen Ausflug auf 221 Dollar zum „Luft holen“ schloss Bitcoin Cash bei 253,90 Dollar. Dieser Close durchbrach erfolgreich die Widerstände des 10er und 50er EMA.
Aktuelle Situation und Ausblick: Bullish mit Vorsicht
Aktuell, am 9. Januar 2024 um 10:40 Uhr, notiert der Kurs bei 247,30 Dollar und befindet sich über dem 10er EMA bei 245,30 Dollar. Der RSI MA liegt bei 55,26, während der RSI bei 42,54 notiert. Die genaue Bedeutung dieser RSI-Werte lässt Raum für individuelle Interpretationen.
Ichimoku Cloud als Support und potenzielle Handelsstrategien

Der Kurs bewegt sich weiterhin über der Ichimoku Cloud, die in vergangenen Korrekturen zusätzlichen Support bot. Die Aussichten bleiben bullish, solange keine tiefgreifenden Korrekturen eintreten und der Kurs die Wolke nicht nach unten durchquert.
Für Trader bieten sich potenzielle Long-Positionen bei einem möglichen Rücklauf auf den 50er EMA an. Aktuell sind jedoch keine klaren Anzeichen für Short-Positionen erkennbar. Die Entwicklung bleibt aufmerksam zu verfolgen, da Bitcoin Cash möglicherweise vor einem bedeutenden Ausbruch steht.
Disclaimer: Diese Analyse dient ausschließlich Informationszwecken und stellt keine finanzielle Beratung dar. Jegliche Handelsentscheidungen, die auf den in dieser Analyse präsentierten Informationen basieren, liegen in der alleinigen Verantwortung des Lesers. Es wird dringend empfohlen, sich bei Bedarf von einem qualifizierten Finanzberater beraten zu lassen.
Quellennachweis und Vertiefungen
Die Analyse von Kryptowährungen erfordert nicht nur ein Verständnis der aktuellen Marktsituation, sondern auch Kenntnisse über die zugrundeliegenden Indikatoren und Methoden. Im Folgenden werden wichtige Quellen und Vertiefungen zu den Schlüsselaspekten dieser Analyse vorgestellt.
Exponential Moving Average (EMA): Ein tiefer Einblick
Die Börse Frankfurt bietet eine klare Erklärung des Exponential Moving Average (EMA), einem gleitenden Durchschnitt, der besonders empfindlich auf aktuelle Kursentwicklungen reagiert. Eine fundierte Definition und Anwendung dieses Indikators in der technischen Analyse finden sich auf der Website der Börse Frankfurt.
Ichimoku Cloud: Prognose durch die Wolken
Für eine umfassende Erklärung der Ichimoku Cloud (Ichimoku Kinko Hyo), einer komplexen technischen Analysemethodik aus Japan, bietet sich die Wikipedia-Seite an. Diese Wolke dient dazu, Kursbewegungen zu prognostizieren, und wird im Artikel ausführlich beschrieben.
Relative Strength Index (RSI): Ein Schlüsselindikator
Der Relative Strength Index (RSI) ist ein entscheidender Indikator in der technischen Analyse von Finanzmärkten. Auf der Wikipedia-Seite findet sich eine umfassende Erklärung, einschließlich der Berechnung und Anwendung dieses Indikators. Der RSI ist als eines der wichtigsten Instrumente für die Marktanalyse bekannt.
Mit diesen Quellen und Vertiefungen erhalten Anleger und Analysten eine solide Grundlage, um nicht nur die aktuellen Marktbewegungen zu verstehen, sondern auch die Instrumente und Indikatoren, die hinter den Entscheidungen stehen.
#BitcoinCash#Chartanalyse#EMA#Finanzmärkte#IchimokuCloud#Investitionen#KryptoAnalyse#Kryptomarkt#Kryptowährungen#Marktanalyse#RSI#TechnischeAnalyse#TradingSignals
0 notes
Text
Hướng dẫn sử dụng chỉ báo Ichimoku hiệu quả.
Bạn cần phải biết những điều sau:
✅ Nhận định thị trường thông qua chỉ báo Ichimoku
✅ Giao dịch khi Tenkan-Sen cắt Kijun-Sen
✅ Giao dịch khi Chikou Span cắt đường giá
✅ Giao dịch khi Senkou Span A cắt Senkou Span B
👉Tham khảo tại:
0 notes
Link
Expert Webinar on Ichimoku Trading Strategies- Manesh Patel, CMT,CFTe
0 notes
Photo
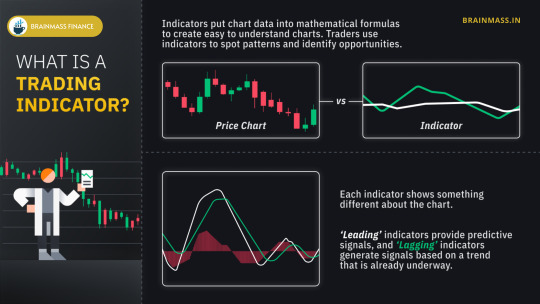
Brainmass Academy :
#tradewithraj#brainmasstraders#brainmassacademy#vwap#vwma#supertrend#learnwithraj#indicators#pricechart#bollingerband#stochastic#macd#adx#ichimokucloud#tradingindicators
0 notes
Video
youtube
Using the Ichimoku Cloud for amazing Profits
This is a trade example taken today from one of our members using the Ichimoku cloud for amazing profits. Learning to understand price action and momentum played a huge part in this trade. The Ichimoku cloud indicator set the trade up while having the knowledge and patience to wait for price action to show us the way played dividends with an R:R of 7:1. This doesn't happen everyday but at Price Action Traders Ireland we lay the foundations for every trader to learn and flourish in a community of retail forex traders. Join our Mentoring Programme and enjoy the benefits of the members area on our website www.priceactiontradersireland.ie where every members gets access to live trade recordings and webinars. Darragh Coyle will mentor each student until they gain the knowledge and confidence to trade forex like a pro .
0 notes
Text
$BTC.X #Bitcoin is working on a seventh straight lower close on its daily #heikinashi chart. #technicalanalysis #ta #ichimokucloud https://t.co/x3xSTZcMFW
$BTC.X #Bitcoin is working on a seventh straight lower close on its daily #heikinashi chart. #technicalanalysis #ta #ichimokucloud pic.twitter.com/x3xSTZcMFW
— Patrick Rooney (@patrickrooney) February 28, 2021
https://platform.twitter.com/widgets.js
from Twitter https://twitter.com/patrickrooney
View On WordPress
0 notes
Photo

Coronavirus Stock Investing Opportunities - 2 Types of Stocks to Invest in http://ehelpdesk.tk/wp-content/uploads/2020/02/logo-header.png [ad_1] How To Take Control Of Your Fina... #accounting #algorithmictrading #cfa #coronavirus #coronavirusstocks #coronavirus #coronavirusoutbreak #coronavirusstockbuy #coronavirusstockbuyingopportunities #coronavirusstockmarket #coronavirusstockmarketanalysis #coronavirusstocks #coronavirusupdate #daytrading #excel #finance #financefundamentals #financialanalysis #financialcrisis #financialcrisis2020 #financialeducation #financialliteracy #financialmanagement #financialmodeling #financialtrading #forex #ichimoku #ichimokucloud #investdiva #investing #investingforbeginners #investmentbanking #investmentstocks #investmentstrategies #kianadanial #optionstrading #personalfinance #stockinvesting #stocktrading #technicalanalysis
0 notes
Text
تریدینگ ویو رایگان
❌ آیا حتما نیاز به خرید اکانت تریدینگ ویو دارم؟
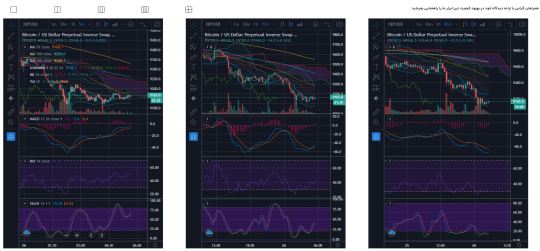
📊 همونطور که همه دوستانی که در زمینه تحلیل و مبادله ارزهای رمزنگاری شده فعالیت می کنن می دونن یکی از بهترین ابزارهایی که برای تحلیل نمودارهای قیمتی این ارزها وجود داره سایت تریدینگ ویو(Tradingview) هست.
💵 مشکلی که وجود داره هزینه بالای استفاده از خدمات تکمیلی این سایت هست که با توجه به مشکلات پرداخت ارزی باعث میشه اکثریت کاربران ایران برای خرید اون اقدام نکنن.
🆘 یکی از بزرگترین مشکلات و محدودیت هایی که استفاده از اکانت مجانی تریدینگ ویو برای کاربران دارد محدود شدن تعداد اندیکاتورهای مورد استفاده به سه عدد و Multiple Chart می باشد.
⚙️ ما به صورت رایگان این امکانات را در اختیار شما قرار میدهیم.
IchimokuCloud
MACD
Moving Average (3x=200-100-50)
Stochastic
Multiple Chart
Bollinger band
RSI
🧩کلیه این ابزار ها رایگان می باشند.
https://signalling.ir/tradingview-free/
🏅همراهان گرامی : این یک پروژه کاملا رایگان می باشد و با ارائه دیدگاه خود در بهبود کیفیت این ابزار ما را راهنمایی بفرماید.
#تریدینگ_ویو_رایگان #تریدینگ_ویو #تریدینگویو #لایسنس #اکانت_تریدینگ_ویو #خرید_اکانت_تریدینگ_ویو #ارزدیجیتال #binance #chart #cryptocurrencies #tradingview #بورس
0 notes
Video
youtube
Ichimoku Cloud Trading Strategy | Ichimoku Kinko Hyo | ఇచిమోకుపై అవగాహన
0 notes
Link
How to use ichimoku cloud - ichimoku cloud trading strategy [100% working] How To Use Ichimoku Cloud Trading Strategy Ichimoku cloud is a type of technical analysis method that is often simply called Ichimoku. It is based on Japanese candlestick charting to predict future price movements. Only in the 1960s did Ichimoku came to the attention of the public when a Japanese journalist named Ichimoku Sanjin, also known as Goichi Hosoda, released it publicly after three decades perfecting it. The idea behind the Ichimoku Cloud Strategy is to use a moving-average based trend method to indicate where a stock is likely headed next. In addition to price action, Ichimoku uses time as another element, and because greater data points are used, it is generally regarded as providing a clearer picture than Japanese Candlesticks. How The Ichimoku Cloud Strategy Works Ichimoku cloud is designed to spot direction and momentum in order to help you make buy and sell decisions more easily. Five indicators are used with each corresponding to a different timeline. Ichimoku Cloud The cloud is known as the Kumo and is what grabs your attention right away because it’s the most noteworthy of the five indicators. When prices are above the cloud, the trend is positive. And when prices fall below the cloud, the trend is negative. When the price action takes place within the cloud, it is believed that the trend is flat. But how do you know when the trend is strong? Leading Span A Line The next indicator or line to pay close attention to is the Leading Span A, which is also known as Senkou Span A. When share prices rise above the Leading Span A, the top line acts as support while the lower line acts as a second support level. #ichimokucloud #tradingstrategy
0 notes
Text
Solar Optics - NASDAQ - AXTI
New Post has been published on https://techgoldrush.com/stockgroup/solar/solar-optics-nasdaq-axti/
Solar Optics - NASDAQ - AXTI
NASDAQ – AXT; AXTI
-substrate is a key ingredient of the semi-conductors that go into solar cells
-AXT use Gallium Arsenide which boosts efficiency and is twice as efficient as silicon
-Gallium Arsenide is also used in 3D sensing and light displays, power amplifiers, radar and 5G smart phones
-The company also make indium phosphide which is used in the field of optical networks.
-Data is transmitted using light at a stunning speed
-This is being used in data centres, video streaming, cloud computing, data networks etc
-$50 million in cash and no debt (2017 NOV)
AXTI – financhill
new TradingView.widget( "width": 1200, "height": 610, "symbol": "NASDAQ:AXTI", "interval": "D", "timezone": "Etc/UTC", "theme": "Light", "style": "1", "locale": "en", "toolbar_bg": "#f1f3f6", "enable_publishing": false, "allow_symbol_change": true, "calendar": true, "news": [ "stocktwits" ], "hideideasbutton": true, "studies": [ "IchimokuCloud@tv-basicstudies" ] );
0 notes
Photo

📣📣Learn Live from the author of the book Trading with Ichimoku Clouds
👉 Get Trained by Manesh Patel, CMT, CFTe
👉 Ichimoku vs Moving Averages
👉Ichimoku Optimize Fibonacci & Elliott Wave
👉Short term vs Long Term Trading
👉Ichimoku System
👉Multiple Time Frame Analysis
👉Psychology of Price action
📌 Grow your Trading Career. You can be our next success story!
📌 2 DAYS LIVE SESSION - 14 & 15 DEC 2022, 7pm - 9 pm
👉To book your slot -👇👇👇
👉https://bit.ly/3VNjYyk
👉Contact for More Information
9746492791
9048217901
👉Email your query:
[email protected]
0 notes
Text
$BTC.X Cloud remain favorable for #bitcoin. #ichimokucloud #technicalanalysis https://t.co/R9Wdff04vD
$BTC.X Cloud remain favorable for #bitcoin. #ichimokucloud #technicalanalysis pic.twitter.com/R9Wdff04vD
— Patrick Rooney (@patrickrooney) February 24, 2021
https://platform.twitter.com/widgets.js
from Twitter https://twitter.com/patrickrooney
View On WordPress
0 notes
Text
#Cocoa ripped up to its highest level of 2021 but the future still looks cloudy. #ichimokucloud #technicalanalysis https://t.co/kQA3l9zHQK
#Cocoa ripped up to its highest level of 2021 but the future still looks cloudy. #ichimokucloud #technicalanalysis https://t.co/kQA3l9zHQK
— Patrick Rooney (@patrickrooney) February 10, 2021
https://platform.twitter.com/widgets.js
from Twitter https://twitter.com/patrickrooney
View On WordPress
0 notes
Last Seen Blogs

xxtoomuchofafangirlxx
To Much Of A Fangirl

xivymoonartx
Local Scumbag Dealer

samantha7834
Untitled


mylvbags
Untitled