#hockey stats
Text
im usually a realist on here, and obviously a so loss to end the road trip isn't the way we wanted to go out, but let's consider the circumstances
first of all
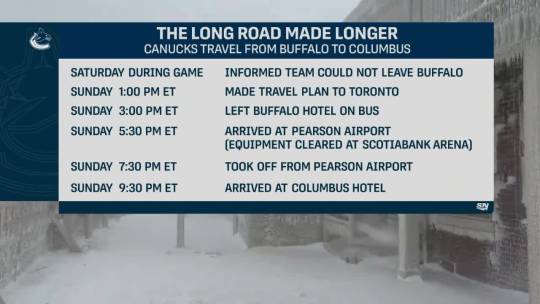
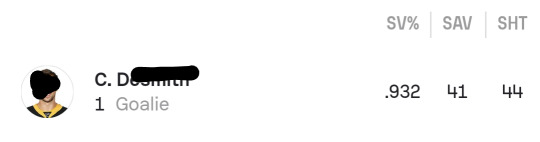
the travel schedule was crazy, getting to columbus the night before for an already insanely early 1pm local time start after the full day of back and forth travel they needed to endure is crazy. we fought hard in that game, especially our goaltender who made an impressive 41 saves and was exceptional between the pipes
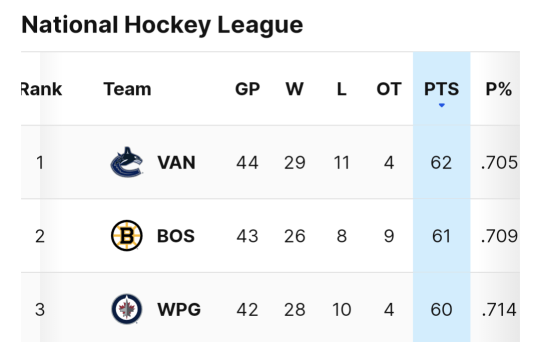
though we didn't win, we finished 5-1-1 on the road trip, and we are still 1st in the league (3rd by p% if you're a stats nerd like me) and easily 1st in the division with our 8 point gap on VGK and our impressive 13 point gap on LAK.

and, to put it in perspective, here's where we were last year (left) according to moneypuck vs this year (right) at the same time.

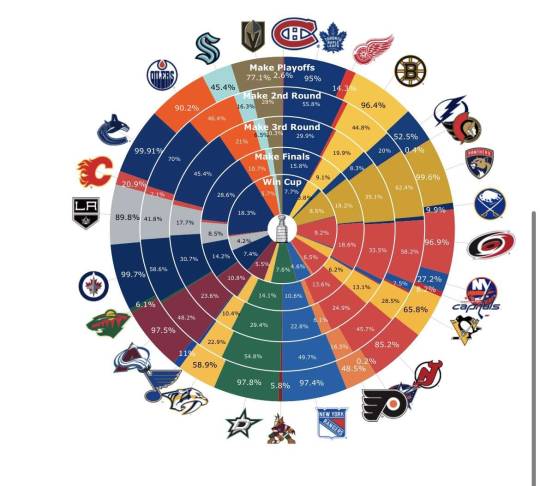
going from just a 0.6% chance to make the playoffs at all to a 99.91% chance to make the playoffs and a 18.3% chance to win the cup in just one year is absolutely wild, and im so proud of our team and all we have accomplished.
so yes, we did lose today. but overall, i think we are the biggest winners in the league.
ive been saying it since i was 3, and ill say it again now. go canucks go, we are going to kill it when we get back home
#not naming our backup goalie because of the credible assault allegations against him but he deserves to be recognized#solely for his performance#canucks posting#hockey tactico talk#stats#hockey stats#vancouver canucks#canucks#canucks lb#nhl stats#money puck
20 notes
·
View notes
Text
I try to be nice to Luszczyszyn and the others who work on the tiers and power rankings on the athletic I just think there's something flawed with how his GSVA model is calculated as it feels off in a way that I don't get with other stats people even when they're pointing out bad things about a player I like
but literally how the fuck do you put Philip Danault as one of the top 100 players in the league and not include Suzuki, the guy he lost his job to in the playoffs
Suzuki has also already beaten Danault's career high in points and did it younger and on a worse team
if the rankings included the last few years as they claim and not just this season that should matter to how this is calculated and decided
#hockey#hockey stats#nick suzuki#maybe I shouldn't have deleted my hockey sideblog but also I dont miss it so ur gonna get it here
2 notes
·
View notes
Text

"Are you new to hockey and confused about stats? Are you an old hat at this sport but still confused about stats and too scared to ask at this point?"
Read our guide to the NHL's Advanced Statistics here.
3 notes
·
View notes
Text
singlehandedly dragging his team back into the game... just matthew things 👅
#matthew tkachuk#florida panthers#nhl#nhledit#hockey#hockeyedit#meg.cats#meg.gif#meg.all#sorry i know people who believe in Analytics and Math and Stats shouldn't really really believe in the concept of being clutch#that being said#matthew just genuinely digs deeper when needed. lol
276 notes
·
View notes
Text
Are you new to hockey and confused about stats? Are you an old hat at this sport but still confused about stats and too scared to ask? Do you think you are proficient in stats and then, all of a sudden, a new acronym comes out of nowhere to re-confuse you about stats?
This season, seemingly more than any other, every other hockey tweet and article mentions an incomprehensible acronym jumble and a percentage sign. With the NHL making more advanced statistics accessible to the public, these different stats seem to have more of an impact than ever on how people talk about and analyze the game, but it can feel like explanations of these numbers and codes are hard to find.
I’ve written a handy guide to some of the most common stats, talking about what the acronyms stand for, the data that the stat is looking at, and why each stat is important so you can better understand the tweets and articles from all the hockey analysts.
There are three main categories of stats to look at: skater stats, goalie stats, and team stats, and these stats were accurate as of 5:00 pm on Saturday, March 2.
Skater Stats:
SH%
Shooting % (SH%) is the percentage of shots a player attempted that resulted in goals. This is calculated by multiplying goals by 100 and dividing by shots. This shows a player’s conversion rate, or how many goals they score for every 100 shots. It's useful when looking at goal pace, and whether a skater is just on a hot/cold streak or if their goals are indicative of their average abilities.
An average shot conversion rate is between 9% and 13%, but skaters can have seasons where more of their shots go in or less of their shots go in. SH% fluctuates from less than 1% to over 20% depending on the skater’s luck. It is also important to look at the sample size. On Natural Stat Trick, if you sort by pure SH%, it shows you that Vasily Ponomarev (CAR) has the highest SH% of the players who have more than 1 goal on 1 shot, with a 33.33% SH%. This is because he has scored 1 goal on 3 shots, so the low sample size inflates his SH%.
Highest SH%: Sam Reinhart (FLA) with a 25.31% SH% from 41 goals on 162 shots. It would seem like this year, lots of bounces are going Reinhart’s way.
Average SH%: David Pastrnak (BOS) with a 12.67% SH% from 38 goals on 300 shots. This is league average, despite how many goals and shots he has.
Lowest SH%: Seth Jones (CHI) with a 0.90% SH% from 1 goal on 111 shots. This is extremely unlucky, his SH% says he is due for some bounces.
+/-
Plus/Minus is a stat to measure defensive efforts. Every time a player is on the ice when their team scores a goal, they get a +1, whether they are involved in the goal or not. When a player is on the ice when the other team scores a goal, they get a -1. If a player is on the ice for 2 goals for their team and one goal for the other team, they would end the night with a +1. If a player ends the night with 0, they were on the ice for equal amounts of goals for and against.
However, a disclaimer; +/- is an imperfect stat, and it is not always useful without context. It is a useful at-a-glance stat to quickly see defensive performance, but more context is necessary to see if a player is good defensively or not. This is because +/- is often influenced by factors outside of a player’s control, highly variable factors. Some variables that can influence +/- without player input are goalie SV%, the amount of time the player spends on ice and whether they are spending that time in the offensive or defensive zone, and the amount of time a player spends on the power play or penalty kill. Nick Suzuki (MTL) has a +/- of -14, but he also has the fifth-highest TOI of any forward in the league and has very positive defensive numbers in other areas, such as takeaways and offensive zone time.
Highest +/-: Gustav Forsling (FLA) with +39 in 59GP
Average +/-: Mikko Rantanen (COL) with +5 in 61GP
Lowest +/-: Philipp Kurashev (CHI) with -32 in 53GP
Goalie Stats:
GSAA
Goals Saved Above Average (GSAA) is the difference between a goalie’s goals against and a goalie’s goals against with the same shot against and the average save % (SV%). If you were comparing Goalie A with Average Goalie, who has the same goals against and shots against just an average SV%, GSAA measures how many more (or fewer) goals against Goalie A would save over Average Goalie.
For example, if Thatcher Demko (VAN) was compared to Average Goalie, with the same goals and shots against and an average SV%, Demko would have saved 6.80 goals more than Average Goalie. This is useful for evaluating how goalies perform compared to the average, as well as how much they need to bail out their team. For example, a goalie like Sam Montembeault (MTL) might have a lower SV%, but a higher GSAA because he faces many more shots than a lot of goalies but saves many of them. This is a good stat to evaluate goalie quality.
Highest GSAA: Connor Hellebuyck (WPG) is +26.74 GSAA, which is crazy. Hellebuyck is crazy good.
Average GSAA: John Gibson (ANA) is -1.09 GSAA, the closest to the hypothetical Average Goalie this season.
Lowest GSAA: Arvid Soderblom (CHI) is -17.34 GSAA, yikes!
SV%
Save % (SV%) is the percentage of shots against a goalie that a goalie saved. This is calculated by dividing the number of saves by the amount of shots against. This is useful as an initial evaluation of a goalie’s quality and should be used in conjunction with GSAA to evaluate a goalie’s performance more accurately, as SV% doesn’t account for any extenuating circumstances. Igor Shesterkin (NYR), for example, has had some stretches of poor SV% this season. These weren’t entirely his fault, as he was not getting the defensive support he was used to, therefore he was letting in more goals.
League average SV% this season is around 0.903% and typical SV% ranges from 0.870% to around 0.930%. Similarly to SH%, it is important to look at the sample size for SV%, as the number of shots a goalie has faced can affect their SV%, and can show whether it is just a hot/cold streak or a reliable measure of performance.
Highest SV%: Connor Hellebuyck (WPG) with a 0.940% SV% by making 948 saves on 1008 shots.
Average SV%: John Gibson (ANA) with a 0.913% SV% by making 752 saves on 824 shots.
Lowest SV%: Jonas Johansson (TBL) with a 0.895% SV% by making only 513 saves on 573 shots.
GAA or GA/G
Goals against per game, known as GAA or GA/G (I will be referring to it as GAA, but different websites use different acronyms), are the average amount of goals per game that a goalie allows. This is calculated by multiplying the goals against by 60 and dividing it by the goalie’s time on ice. This number is indicative of how many goals on average a goalie gives up, which isolates a goalie’s performance and is indicative of how good a goalie is, separate from their defensive core. It is especially useful when looking at good goalies on bad defensive teams, as it isolates the goalie from the skaters. A lower GAA means a goalie lets in fewer goals per game, and a higher one means a goalie lets in more. In this case, a lower number is better.
Lowest GAA: Connor Hellebuyck (WPG) with 2.23 GAA through 43 games played.
Average GAA: Jake Oettinger (DAL) with 2.92 GAA through 38 games played.
Highest GAA: Arvid Soderblom (CHI) with 3.97 GAA through 22 games played.
Team Stats:
P%
P%, or Points %, is the percentage of available points a team has won. For example, if a team has played 50 games and won all 50, they would have the maximum amount of points: 1.000 because every win is 2 points. Therefore they would have a 100% P%. If they won 40 of those 50 games, they would have 80 points and a 0.800 P%. If they won only 30 games but lost the remaining 20 all in overtime or a shootout, they would also have 80 points and an 80% P%, as OT and SO losses still gain a point.
P% is useful to look at throughout the season when teams have not played the same number of games. As of the time of writing, some teams have played up to 60 games while other teams have played only 55. When comparing the two teams, P% is a more accurate way to look at the standings, because it levels the playing field when there is a discrepancy in the amount of games played.
Sometimes people talk about being above or below “500 hockey,” and this is talking about P%! “500 hockey” is when a team has won 50% of the available points. Above 0.500 is usually seen as a positive. There is only one team exactly at 0.500 P%, and that is somehow the Buffalo Sabres!
Highest P%: Florida Panthers, with 0.700 P% from 84 points in 60 games played (wow!)
League Average P%: Washington Capitals, with 0.551 P% from 65 points in 59 games played
Lowest P%: Chicago Blackhawks, with 0.292 P% from 35 points in 60 games played (yikes.)
PDO
If you are a fan of the Vancouver Canucks like I am, you have probably heard this acronym from both the media and opposing fans all season. PDO, also known as “puck luck,” is just adding a team’s combined shooting % with a team’s combined save %. The team’s combined shooting % is the average of the shooting % for all a team’s skaters, and the combined save % is the average of all a team’s goalies.
PDO is important to know what percentage of a team’s shots are going in the net and how many shots are being saved by the goalies; basically, just puck luck! The average PDO in the league is 100.0, but depending on a team’s SH% and SV% throughout a season, these numbers usually fluctuate between 95% and 105%.
Highest PDO: Vancouver Canucks, with 103.4 from a combined 11.36 skater SH% and a 92.09 goalie SV%, those lucky ducks.
Lowest PDO: San Jose Sharks, with 97.4 from a combined 6.78 skater SH% and a 90.59 goalie SV%. Better find some four-leaf clovers, SJ.
Corsi/CF%
Corsi is a number that combines any shot attempt outside of a shootout. This includes goals, shots on the net, shots that miss the net, and shots that are blocked by the opposing team. There are two types of corsi, corsi for (CF) and corsi against (CA). CF is the amount of shots that Team A makes on Team B. CA is the measure of how many shots Team B takes against Team A.
For example, if Team A has 3 goals, 30 shots, and 30 blocked shots or missed shots, their CA would be 63. If Team B scored 2 goals on Team A and also had 20 shots and 20 blocked shots, Team A’s CA is 42.
Got that? Great! Stay with me for this next part.
CF% is the important stat, as it measures the percentage of total Corsi while a team is on the ice. It shows how the percentage of CF a team has vs CA. In other words, CF% measures how many more total shot attempts Team A has on Team B’s net than Team B has on Team A’s net.
Hold on – don’t close the page, I know it’s confusing. Maybe this will make sense with some examples.
The team with the best CF% is the Carolina Hurricanes, with 59.56 CF%. They have 3468 CF, or total shots, and 2355 CA, or shots the other teams took against them. Of the total goals, shots, and shot attempts on the ice in any Carolina Hurricanes game, the Canes have just under 60% of them. That is an impressive share of the shots. This stat helps you evaluate offensive versus defensive possession, as a high CF% (like the Canes) indicates high offensive possession. The more time spent in the offensive zone, the more goals, shots and shot attempts, and therefore a higher CF%!
Highest CF%: Carolina Hurricanes, as I said, super impressive!
Average CF%: Ottawa Senators, with 50.15% of the total shots on the ice in their games (or just over 50% CF%). Sens the most equal offensive zone vs defensive zone time? Makes sense!
Lowest CF%: San Jose Sharks, with 43.48% CF%. San Jose is not great at controlling play, but what did we expect?
These are some of the most common stats and acronyms that you will come across in your analytics research, happy reading!
Stats were retrieved via Natural Stat Trick and ESPN’s NHL Player Stats, and definitions were retrieved with the assistance of Natural Stat Trick’s Stat Glossary.
#back on the hockey prof grind you know it you know it#haven't had a lot of time with school but you know im here for you guys with the stats coverage#more coming soon just coming slowly as i work on things!#hope you enjoy hope this is useful#k the hockey prof???#k.txt#hockey tactico talk#stats chats#hockey stats#nhl stats
16 notes
·
View notes
Text
Things Set to Occur in 2024:

Terminators!

Hockey: outlawed!

Irish Unification!
What else we got waiting in the wings...?
#2024#new year#stat trek#star trek tng#st tng#the next generation#jason x#jason voorhees#terminator#sarah connor#kyle reese#ireland#hockey
104 notes
·
View notes
Text
Okay so i went in depth about some of Bucky's hockey stats and habits as a goal tender with @1343-40 BUT i gotta talk about Gale "One Engine" Cleven (Aka Clevy, AKA Buck) for a second
so i imagine he's about 5 years into his NHL career. A cup under his belt, not quite a seasoned vet, not quite a rookie. He could still be argued as up-and-coming and has won a lot of awards but theres a lotta people who think he's overrated, over hyped. Bit of a candy-ass when it comes to taking hits and standing up to the bigger players (not that Austin is itty bitty but he's small for a hockey player)
so anyways by year Five Gale is playing a solid 78-82 games. He's the main guy, hes the superstar. Got his nickname "One Engine" cause he skated and scored with one broken off skate
Stats(Cumulative): 146 goals, SOLID 350 assists, (What can i say hes a giver) He's got a really low PIM; mostly nonviolent calls so Holding, maybe some accidental high-sticks and obstruction. He's an ace on the Powerplay (58 PPG, 140 PPA) but struggles with his SHG (we'll put it at a solid ONE TIME) ,again because of his size. if he doesn't have enough players playing interference the other team roughs him up easy.
he's got a respectably 24 game winning goals by now, a stanley cup and a closet of trophies:
Art Ross, Hart memorial, Ted Lindsay. ALMost snags the Messier but I think Curt gets it instead. Maurice Richard and 2 Conn Smythes
#mostly fudged from Sid stats cause i just know him best#picture me doing SOOO much math it was so hard be proud#mota hockey au#i think he could manage all those trophies by year 5 but thats the part im least sure about
26 notes
·
View notes
Text
You know what this means? Jarry leads all nhl goaltenders with the most shutouts and goals
45 notes
·
View notes
Text
honestly i am so blissfully oblivious to a lot of stuff there couldve been a hockeyblr civil war and i wouldve been diddling about saying stuff like "sarah nurse has an offensive disappear-and-shoot-from-nowhere ability comparable to auston matthews according to my eye test but because she is a winger she's generally more comparable to a pastrnak type equivalent. furthermore pastrnak combines matthews' shot versatility with ovechkin's shootiness although he's not nearly as good as either of them" and getting a solid 23 notes (21 likes and 2 reblogs) on it. ive never even gotten anon hate
#i got one anon politely disagreeing with me a while ago. closest ive ever gotten#also 'shootiness' is one of my fav hockey semi-stats#great word. measurable metric. does it make you better or worse not really it's just There#frankly i think all this one-axis measurement of players is not entirely helpful (tho it has a place). players can be good in diff ways#eg why natemac and am34 are both who i would consider to be the current second-best players in hockey#but they are ENTIRELY different players
47 notes
·
View notes
Text
Brock Faber 2024 rookie season stats
~Skated 2,032.71 minutes through 82 games
~47 points (8 goals + 39 assists)
~Most points of any wild rookie defensemen
~Second Most points of any wild rookie
~Most assists by any wild rookie
~Blocked 150 shots
~Highest toi in 51/82 games
~Was one of the only two (the other being Marco Rossi) that played every game this season
~Highest toi 33.25 minutes (vs the Montreal Canadiens 12/21/23)
~Skated over 19 minutes in every game
~Average toi of 24.59 minutes
~Sixth highest toi in all NHL
~Highest avg toi by a rookie since 1997-98
#just some stats I’ve compiled#and#just more reasons he should be the rookie of the year#I’m never not amazed by this kid#like he’s actually crazy#nothing but respect for my Calder winner#faber for calder#rookie of the year#brock faber#mn wild#minnesota wild#hockey
33 notes
·
View notes
Last Seen Blogs

anaheimreliableplumbers-blog
Untitled

legathyrose
LegathyRose

amandamello
amanda mello

affable-rp-blog
Affable Roleplay

kirkreedstrom
Quack.