
growdashboards
Grow.com
At Grow, we design holistic Business Intelligence solutions that help you track data and make data-driven decisions for complete transformation. Empower your teams with engaging data visualizations and enter into a territory where you can connect and store data from multiple data sources. Witness data the way you want with our Business Intelligence software, visit www.grow.com for more information.
534 posts
Last active 3 hours ago
Don't wanna be here? Send us removal request.
Last Seen Blogs

holycoffeeshark
Charlie Carolan

anwar1hidayat
Statistikian

bucks26
Sans titre

urmoo
Urmonan

apartamento-a-venda-blog
Apartamento a Venda
Text
Can No-Code BI Tools Keep Up with Big Data Demands?
The Rise of Big Data
Big data is characterized by four primary dimensions, often referred to as the four Vs:
Volume: Every second, an astounding amount of data is produced. From social media feeds to transaction records, the volume of data is so vast that traditional data processing software often falls short.
Variety: There are three main types of data: structured, semi-structured, and unstructured. Text, images, videos, and logs are just a few examples of the diverse types of data that organizations must now manage.
Velocity: Data is generated at unprecedented speeds, requiring tools that can process information in real-time or near-real-time to make timely decisions.
Veracity: The accuracy and reliability of data are important. Poor data quality can lead to misleading analysis results and poor business decisions.
These dimensions pose unique challenges and opportunities, pushing companies to adopt innovative technologies such as no-code BI software tools, which simplify the complexities associated with big data.
Big Data in Key Industries
Retail: Retailers leverage big data to enhance customer experiences through personalized marketing and optimized supply chains. No-code BI tools allow marketing teams to analyze customer data and shopping trends without relying on IT departments, enabling faster, data-driven decision-making.
Healthcare: In healthcare, big data is used to predict epidemics, improve quality of life, avoid preventable deaths, and reduce overall healthcare costs. No-code Business Intelligence tools help in aggregating and analyzing patient information quickly, facilitating timely interventions and personalized treatment plans.
Finance: Financial institutions use big data for risk analysis, fraud prevention, and customer segmentation. No-code BI software tools enable analysts to visualize large datasets to detect anomalous transactions and trends, enhancing security and customer service.
Challenges Posed by Big Data
Big data introduces several challenges, primarily in data management and analysis:
Storage: The volume of data requires substantial storage solutions that are both scalable and cost-effective. Cloud storage integrated with no-code Business Intelligence software can offer scalable options without heavy upfront investments.
Processing: Processing large datasets quickly is a challenge, especially when the data is complex and varied. No-code BI tools with robust backend architectures can significantly reduce the processing time, providing real-time analytics to support rapid decision-making.
Analysis Complexity: Analyzing diverse and massive datasets requires advanced analytical tools and expertise. No-code BI tools democratize data analytics by providing user-friendly interfaces and pre-built analytics models, making complex data analysis accessible to non-experts.
Evaluation of No-Code BI Tools in Handling Big Data
No-code BI tools are transforming the landscape of data analytics by making complex data analysis accessible to non-technical users. These tools are designed not only to simplify interactions with big data but also to provide robust technical capabilities to manage large datasets efficiently. Let’s explore these capabilities and real-world applications through case studies that highlight the efficacy of no-code BI software in various industries.
Technical Capabilities to Handle Large Datasets
No-code Business Intelligence tools are equipped with advanced data processing engines that allow them to manage and analyze large datasets with ease. These tools typically feature:
Data Aggregation and Filtering: No-code BI tools can handle millions of data points by aggregating data and allowing users to apply filters for focused analyses.
Performance Optimization: Many no-code BI software tools utilize in-memory data processing, which significantly speeds up the analysis by storing data temporarily in the system's RAM.
Scalability: Cloud-based no-code BI solutions offer scalability, enabling businesses to increase their data processing capabilities as their data volume grows without the need for physical infrastructure upgrades.
Integration Abilities with Databases and Data Warehouses
Integration with various data sources is critical for BI tools to function effectively across organizational data ecosystems. No-code BI tools excel in this area by offering:
Plug-and-Play Connectivity: These tools provide pre-built connectors for a wide range of databases and data warehouses, including SQL databases, NoSQL databases, and cloud-based storage solutions like Amazon S3, Google Cloud Storage, and more.
Real-Time Data Sync: No-code Business Intelligence software tools often feature real-time data synchronization capabilities, ensuring that the data displayed is always current, which is crucial for timely decision-making.
For more on the user-centric benefits and why your organization might opt for no-code over traditional BI tools, consider exploring the insights in our related blog: "Why Should You Use No-Code Business Intelligence Software?".
Limitations of No-Code BI Tools in Handling Big Data
While no-code BI tools offer numerous benefits, such as ease of use and accessibility, they come with inherent limitations that can impact their effectiveness in certain scenarios, particularly when dealing with very large or complex datasets. Understanding these limitations is crucial for businesses to make informed decisions when selecting the right BI tools for their needs.
Scalability and Performance Limitations
One of the primary concerns with no-code BI tools is their ability to scale when confronted with extremely large datasets or complex data processing requirements. Here are some specific challenges:
Performance Bottlenecks: No-code BI tools can sometimes struggle with performance issues when handling massive datasets or performing complex, resource-intensive operations. This can lead to longer loading times and delays in data refreshes, which might not be acceptable in environments where real-time data analysis is critical.
Limited Handling of Data Complexity: Although no-code Business Intelligence tools are excellent for standard data analysis, they may lack the advanced capabilities needed to manage highly complex data structures or to perform sophisticated statistical or machine learning analyses that require custom coding.
Trade-Off Between Ease of Use and Control/Customization
No-code BI tools are designed to be user-friendly, often at the expense of deeper functionality and customization:
Limited Customization Options: While the simplicity of no-code BI software tools allows for quick deployment and ease of use, it often restricts the ability to perform custom modifications or optimize the system beyond predefined settings. This can be a significant drawback for organizations with specific needs that cannot be met by standard configurations.
Lower Control Over Data Processes: Users of no-code BI tools typically have less control over the backend processes, including data storage, query optimization, and detailed data transformations. This can limit the tool's usefulness for data scientists or analysts who need to fine-tune their data handling for optimal results.
Dependency on Vendor for Updates, Features, and Security
Using no-code Business Intelligence tools often means relying heavily on the tool's vendor for everything from system updates to new features and security:
Dependency on Vendor Updates: Users of no-code BI tools must rely on the vendor to release updates and new features. This can hinder a company's ability to respond to emerging needs or to integrate new technologies that are not supported by the vendor.
Security Concerns: Since the security features are also managed by the vendor, organizations have limited visibility and control over how their data is protected. This could raise concerns, especially for industries that are heavily regulated or that handle sensitive information.
Comparing No-Code and Code-Based BI Tools: Flexibility, Scalability, and Control
Business Intelligence tools are essential for organizations looking to make informed decisions based on their data. The choice between no-code and code-based BI tools can significantly impact the flexibility, scalability, control, and ease of use of the data analysis capabilities of a company. Understanding the differences between these tools is crucial for selecting the right BI solution that aligns with an organization's needs.
Flexibility and Control
No-Code BI Tools: No-code BI software tools are designed for simplicity and speed, catering primarily to business users who need quick insights without deep technical knowledge. These tools typically offer drag-and-drop interfaces and pre-configured templates, which simplify the process of report creation and data visualization. However, this ease of use often comes at the expense of reduced flexibility and control over the data processing and analysis capabilities.
Code-Based BI Tools: Code-based BI tools provide a higher degree of flexibility and control, allowing users to write custom scripts and queries to manipulate data exactly as required. This capability is crucial for performing complex data transformations and integrations that go beyond the capabilities of no-code solutions. Code-based tools are ideal for data professionals who need to conduct in-depth analytics, create customized data models, or integrate BI capabilities into other software applications.
Scalability
No-Code BI Tools: While no-code BI tools are improving in terms of scalability, they still face limitations when handling extremely large datasets or very high query loads, which can lead to performance bottlenecks. The scalability largely depends on the underlying architecture of the tool and the infrastructure provided by the vendor, which may not always meet the highest demands of large enterprises.
Code-Based BI Tools: Code-based tools often provide better scalability options because they can be finely tuned and optimized for performance by skilled developers. They can handle larger datasets more effectively and are better suited for environments where data grows rapidly or where real-time processing of large data streams is necessary.
Learning Curve and Technical Expertise
No-Code BI Tools: No-code Business Intelligence tools are specifically designed to be user-friendly, reducing the learning curve significantly. Non-technical users can often start creating reports and dashboards with minimal training, making these tools highly accessible to business analysts and decision-makers without a background in data science.
Code-Based BI Tools: Conversely, code-based BI tools require a considerable amount of technical expertise, including knowledge of programming languages such as SQL, Python, or R. The learning curve is steeper, but this investment in learning pays off with a greater ability to conduct detailed and customized data analysis.
Preference of Traditional Developers
Traditional developers often prefer code-based BI tools due to several reasons:
Customization and Precision: Developers can exert fine control over the data processes and customize the analytics to fit specific requirements, which is less feasible with no-code solutions.
Integration Capabilities: Code-based tools can be more easily integrated into existing IT infrastructures and customized to interact seamlessly with other applications, which is crucial in complex enterprise environments.
Performance Optimization: Developers have the tools and knowledge to optimize queries and data processing tasks to improve performance, a necessity for handling large scales of data efficiently.
Conclusion
Are No-Code BI Tools Sufficient for Big Data Demands?
As businesses continue to generate vast amounts of data, the choice of the right BI tool becomes crucial. No-code BI tools have demonstrated significant strengths, such as user-friendliness, quick deployment, and accessibility, making them highly appealing to non-technical users who need to make data-driven decisions efficiently. These tools enable companies across various sectors—from healthcare to finance to retail—to harness the power of big data without the need for extensive technical expertise.
However, while no-code BI tools are evolving to handle larger datasets and offer more sophisticated analytical capabilities, there are inherent limitations in terms of scalability, customization, and control compared to their code-based counterparts. Organizations must carefully assess their specific needs, considering not just the volume of data but also the complexity of the analytics required to derive actionable insights.
For those looking to explore the capabilities of no-code BI tools, Grow offers a compelling option. Grow's platform is designed to balance ease of use with powerful analytical capabilities, making it an excellent starting point for businesses aiming to leverage the benefits of no-code BI. With Grow's 14-day free trial, companies can experience firsthand how well these tools integrate with their operations and data systems without any initial investment.
To make an informed decision, we encourage prospective users to read through Grow reviews costs and features GetApp, to see how other businesses have successfully implemented Grow to meet their big data needs. This will provide a comprehensive view of why these tools are the future of of BI and how no-code BI tools like Grow can fit into your data strategy.
0 notes
Text
How No-Code BI Software Manages Large Data Sets with Ease
Have you ever felt overwhelmed by the complexity of managing large data sets across multiple international locations? Imagine a global company like Signagelive, with thousands of customers worldwide and offices in the UK, USA, and Singapore, all needing real-time access to business intelligence. How do you bridge the gap between having robust BI features and maintaining ease of use without breaking the bank?
Jason Cremins, Founder & CEO of Signagelive, faced this very challenge. He found himself caught in a common dilemma: the enterprise-level BI tools that offered extensive features were prohibitively expensive, while more affordable options lacked the necessary capabilities and support.
"We had been using another BI solution and, whilst we liked the pricing, we were frustrated with the lack of features and inability to share dashboards by URL with our teams across the globe,"
Cremins explains.
In a market flooded with tools that either cost a fortune or fall short on functionality, what's the right choice for a business that needs both accessibility and comprehensive data visualization?

With No-Code BI Software—specifically, platforms like Grow, which have revolutionized how companies handle business intelligence. With no-code solutions, the ability to create, customize, and share powerful visualizations becomes straightforward, even for non-technical users. Isn't it remarkable that the low-code platform market is projected to reach $36.43 billion by 2027.
Grow stands out by providing everything Signagelive required in one platform, from sharing dashboards effortlessly via URLs to allowing easy customization of charts for different regional needs. "Grow delivers where others fail. The price and performance is unrivaled," Cremins notes, highlighting how Grow has become the "source of truth" for their teams to pursue their targets aggressively.
So, why continue to juggle multiple tools or settle for less when you can streamline your business intelligence processes with a No-Code BI solution like Grow? Let's dive deeper into how these innovative platforms are changing the game by making data analysis accessible to all, regardless of technical skill or geographic location.
The Power of No-Code BI in Data Integration
Simplifying Data Integration with No-Code BI Software
Data integration, traditionally a complex and technical process requiring specialized skills, is crucial for achieving comprehensive business intelligence. No-Code Business Intelligence Solutions revolutionize this process by enabling the seamless connection of disparate data sources without any coding requirements. This accessibility empowers business users to perform tasks that were once the sole domain of IT departments, significantly speeding up the data-to-decision cycle.
The core of this transformation lies in the intuitive, user-friendly interfaces of No-Code BI Software. These platforms provide tools like drag-and-drop data connectors, visual data pipeline builders, and automated data transformers. Such features simplify the aggregation of data from various sources, including cloud storage, SaaS platforms, on-premise databases, and even spreadsheets. By facilitating this integration without the need for SQL queries or script writing, No-Code Business Intelligence Platforms ensure that users can focus on analysis and decision-making rather than on data preparation.
Scalability and Performance
No-Code Business Intelligence Platforms are designed to manage substantial data volumes while maintaining high performance, ensuring that business users and analysts can gain insights swiftly and effectively. These tools achieve this through sophisticated architectures that optimize data processing—thus removing traditional bottlenecks associated with big data analytics.
A key aspect of this capability is how No-Code BI Software abstracts and simplifies the data handling processes without sacrificing depth or flexibility. Users can query large datasets, merge multiple sources, and generate complex visualizations with minimal delay, which is crucial for timely decision-making in fast-paced business environments. The integration of advanced data management practices ensures that these platforms can scale as data volume grows, without impacting the end user's experience negatively.
Technologies Behind Scalability
Cloud-Native Architectures: Most No-Code Business Intelligence Solutions are built on cloud-native architectures, which naturally support scalability and flexibility. These architectures allow resources to be dynamically allocated based on demand. For instance, during periods of heavy data analysis, additional compute resources can be automatically deployed to handle the increased load, and similarly scaled down during quieter periods. This elastic scalability prevents the system from being overwhelmed and ensures consistent performance regardless of the data volume or user load.
Data Caching Techniques: Data caching is another crucial technology used by No-Code BI tools. By temporarily storing recent or frequently accessed data in a faster-access storage layer, these platforms reduce the time it takes to fetch data for analysis. This is particularly effective for dashboards and reports that are viewed repeatedly throughout the day, as it minimizes the need to repeatedly query the database, thereby speeding up data retrieval and reducing load on the system.
Optimized Query Performance: No-Code Business Intelligence Platforms employ optimized query execution plans to enhance performance. They analyze queries to find the most efficient way to execute them, often utilizing advanced algorithms to parallelize operations and reduce disk I/O operations. This optimization ensures that even complex data queries return results quickly, supporting an interactive analysis experience.
Auto-scaling Capabilities: Auto-scaling is integral to maintaining performance in No-Code BI tools. This feature automatically adjusts the computing power needed based on the real-time use of the BI platform, ensuring that the system remains responsive under varying loads. It's particularly beneficial for businesses with fluctuating BI demands, as it aligns resource use with actual needs, optimizing cost and system performance.
Read Why do unlimited users for your BI matter?
Enhancing Data Accessibility and Democratization
The democratization of data analysis through No-Code BI Software represents a paradigm shift in how organizations approach data-driven decision-making. By empowering non-technical users to perform complex data analysis, No-Code Business Intelligence Solutions effectively broaden the base of data literacy within a company, enabling a more inclusive approach to insights and innovation.
Traditionally, complex data analysis was restricted to data scientists and IT professionals who could navigate the technical hurdles associated with traditional Full-Stack Business Intelligence Software.
However, No-Code Business Intelligence Platforms dismantle these barriers. They provide tools that allow business users, managers, and other non-technical stakeholders to engage directly with data, perform analyses, and generate reports. This empowerment leads to faster decision-making processes and a deeper organizational engagement with data, fostering a culture where every team member can contribute to the dialogue and decision-making process based on real-time data insights.
Intuitive User Interfaces and Accessibility Features
The key to the effectiveness of No-Code BI Tools lies in their user-centric design. Intuitive user interfaces are critical because they ensure that users without technical backgrounds can effectively utilize advanced analytical tools. These interfaces typically feature:
Drag-and-Drop Functionality: Users can create visualizations and assemble reports by simply dragging and dropping data elements onto a canvas. This ease of use removes the intimidation factor often associated with complex BI software.
Guided Analytics: Many No-Code Business Intelligence Platforms guide users through the analytics process with step-by-step prompts, making complex analysis more approachable and less error-prone.
Visual Data Preparation Tools: These tools help users cleanse and prepare data for analysis without needing to write code or understand complex data schemas.
Customizable Dashboards: Dashboards can be easily customized to suit individual or departmental needs, allowing users to create and share views that are most relevant to their roles.
Accessibility Features: These include support for screen readers, keyboard navigation, and color-blind-friendly palettes, ensuring that the tools are usable by people with disabilities, which is an often overlooked aspect of software design.
Real-Time Data Analysis and Reporting
Data Streaming and Continuous Updates: No-Code Business Intelligence Platforms can integrate with various data sources, including IoT devices, web applications, and online transaction systems, to stream data directly into dashboards. This integration allows for the continuous updating of data visualizations without manual intervention, providing a live view of business metrics and performance indicators.
Push Notifications and Alerts: Real-time processing isn't just about visualization; it also includes proactive alerting mechanisms. No-Code BI tools can be configured to send alerts when certain thresholds are met or anomalies are detected. For instance, if sales drop suddenly or website traffic spikes, the system can immediately notify relevant stakeholders, allowing for swift action.
Interactive Dashboards: No-Code Business Intelligence Solutions offer interactive dashboards that allow users to drill down into real-time data. Users can explore data at a granular level, filter results, and manipulate views without waiting for batch processing cycles. This interactivity is crucial for exploring hypotheses and verifying real-time insights on the fly.
Performance Optimization: To support real-time analytics, No-Code BI platforms are optimized for high performance. They employ techniques such as in-memory processing to reduce latency and ensure that the data visualizations are not only accurate but also instantaneous.
Conclusion
As we've explored throughout this blog, No-Code BI Software significantly simplifies the management of large data sets, empowering users across various business levels with the tools to engage directly with data, conduct complex analyses, and make informed decisions quickly and efficiently. From streamlining data integration to enhancing real-time data analysis and reporting, these platforms are transforming the landscape of business intelligence.
For businesses ready to experience the transformative power of No-Code BI, why not start with a solution that exemplifies ease of use and robust functionality? Grow’s Full-Stack Business Intelligence Software offers a comprehensive No-Code Business Intelligence Platform that caters to these needs seamlessly. With features designed to facilitate data democratization and ensure scalability, Grow makes it possible for your business to harness the full potential of your data without requiring deep technical expertise.
Interested in seeing how Grow can make a difference in your business intelligence efforts? Take advantage of the Grow 14-day free trial and experience firsthand the impact of enhanced data accessibility and powerful analytics. Dive deeper into what Grow can offer by checking out the detailed Grow Features & Capabilities on GetApp. Start your journey towards more informed, data-driven decision-making today and see how easy it is to manage large data sets with the right tools at your disposal.
0 notes
Text
Could Your BI Platform Reveal What’s Next for Industry Trends? Here’s How
Did you know that the predictive analytics market is soaring to new heights, triple in value by 2026? Imagine the possibilities if your Business Intelligence platform could tap into that growth. But what if it can do more than just tap into it? What if your BI tool could actually lead the charge in defining future industry trends?
In 2021, the market for predictive analytics was valued at a hefty $10.5 billion. Thanks to the relentless pace of AI and machine learning, by 2026, it's projected to balloon to $28.1 billion. This isn't just growth; it's a revolution in data-driven decision-making. But what does this mean for you, and how can your Business Intelligence software company ensure you're not just riding the wave but actually steering the ship?
Every forward-thinking business is looking to gain that edge, and your Business Intelligence tool holds the key. It's not just about understanding the present—it's about anticipating the future. With the right Business Intelligence platform, equipped with cutting-edge AI and machine learning capabilities, could you not only foresee upcoming trends but also shape them?
In this blog, we’ll unveil how leveraging the power of predictive analytics within your Business Intelligence platforms can transform vast data landscapes into crystal-clear roadmaps for the future.
Are you ready to unlock the predictive power of your BI platform and move from hindsight to foresight? Let's explore how the leaders in Business Intelligence tools are not just keeping up with the trends, but setting them.
Understanding the Predictive Power of BI
In Business Intelligence, predictive analytics is the use of data, statistical tools, and machine learning to figure out how likely it is that something will happen in the future based on what has happened in the past. Essentially, a Business Intelligence platform harnesses predictive analytics to provide forecasts that help businesses anticipate outcomes and trends.
Unlike traditional BI, which focuses solely on what has happened or what is happening, predictive BI is all about what could happen next. This forward-looking approach enables companies to make more informed decisions, taking proactive steps rather than reactive ones.
Key Features of a Predictive BI Platform
1. Data Integration: The Foundation for Predictive Insights
Before a BI platform can predict anything, it needs data—lots of it, from a variety of sources. Data integration capabilities allow your Business Intelligence tool to pull information from internal databases, social media feeds, market research, and industry reports, creating a comprehensive dataset that is rich and varied.
A multinational corporation integrates data from its global sales, customer feedback, and external market conditions into its BI platform. This comprehensive data pool allows for more accurate and encompassing trend analysis, providing insights that are not evident from isolated data sets.
How It Proves Predictive Capability:
By having a holistic view of data, your Business Intelligence platform is better equipped to identify emerging trends that are consistent across different data sources, increasing the reliability of the predictions made.
Ensuring Data Consistency: Integrating data helps standardize information, which is crucial for maintaining consistency. Predictive models require consistent data formats to perform accurately. For instance, integrating customer data from different systems can standardize diverse customer identifiers and purchase histories into a unified format that is more conducive to analysis.
Eliminating Data Silos: Data silos occur when different departments within an organization use data that is not accessible by other parts of the organization. Data integration breaks down these silos, ensuring that all relevant data is available for comprehensive analysis. This is essential for predictive models, which rely on data from multiple business functions to generate accurate forecasts.
Richer Training Datasets: Machine learning models, which are at the heart of predictive analytics, thrive on large, diverse datasets. But, only a handful of Business Intelligence software companies can deliver value in such cases. Data integration provides these models with a variety of data points, which helps in uncovering more complex patterns and interactions between variables. This richness significantly improves the model's accuracy and predictive quality.
2 Advanced Analytics: The Engine for Prediction
With a robust dataset in place, the next step is analysis. Advanced analytics tools like regression analysis, forecasting, and cluster analysis are not just fancy terms—they are powerful techniques that sift through vast amounts of data to spot patterns and predict future outcomes.
Foundations of Advanced Analytics in BI
Regression Analysis: Regression analysis helps in identifying and quantifying the relationships between variables. For instance, a BI platform might use regression analysis to determine the impact of marketing spend on sales revenue. By understanding these relationships, businesses can make more informed predictions about how changes in one area (like budget adjustments) will affect outcomes (such as sales figures).
Forecasting: Forecasting uses historical data to predict future events. This can be as simple as using past sales data to predict future sales or as complex as using economic indicators to forecast market trends. BI tools utilize various forecasting models, from traditional statistical models to more sophisticated machine learning models, to provide businesses with predictions about future conditions.
Cluster Analysis: Cluster analysis groups together similar data points based on their characteristics. In a business context, this can help identify distinct customer segments based on purchasing behavior or demographic similarities. Understanding these segments can aid in predicting trends within each group, allowing for more targeted marketing strategies.
Using time-series forecasting, a retail company's BI platform analyzes 5 years of customer purchase data alongside seasonal trends and economic indicators. The platform predicts a surge in demand for certain products in the upcoming quarter, allowing the company to adjust its inventory and marketing strategies proactively.
How It Proves Predictive Capability:
These sophisticated tools allow businesses to move beyond simple guesswork, providing scientifically-backed predictions based on historical data and analytics models. This capability demonstrates how a BI tool can indeed forecast future industry trends.
Enhanced Forecast Accuracy: Advanced analytics improve the accuracy of predictions by analyzing complex datasets and identifying patterns that are not apparent through simple observation. For example, a Business Intelligence tool might predict customer churn by analyzing patterns in customer activity, transaction histories, and engagement levels. The accuracy of these predictions is often significantly higher than those made using traditional methods, proving the predictive capability of the platform.
Dynamic Adaptation to Market Conditions: Advanced analytics tools enable Business Intelligence Platforms to adapt predictions based on real-time data. For example, during an unforeseen event like a market downturn, forecasting models can adjust predictions for financial performance or consumer behavior based on the latest data, proving the system’s ability to maintain relevance under changing conditions.
Quantifiable Business Outcomes: The ultimate proof of predictive capability is the impact on business outcomes. Advanced analytics in BI platforms can lead to tangible business improvements, such as increased efficiency, reduced costs, and enhanced customer satisfaction. For instance, predictive maintenance can foresee equipment failures before they occur, significantly reducing downtime and maintenance costs.
Real-Time Processing and Visualization: Turning Insights into Action
The real power of predictive analytics is realized when insights can be acted upon quickly. Real-time data processing combined with dynamic visualization tools enables businesses to see and react to trends as they unfold.
Suppose, a financial services firm uses its BI tool to monitor real-time transaction data. The platform quickly identifies an unusual pattern indicating potential fraud. This immediate insight allows the firm to halt suspicious transactions before significant losses occur.
How It Proves Predictive Capability:
Real-time data processing ensures that the insights provided by your BI platform are always relevant and current, allowing businesses to make decisions based on the very latest data. Visualization tools help disseminate these insights across the organization in an understandable format, ensuring swift and informed decision-making.
Real-Time Data Processing in Predictive Analytics
Immediate Data Availability: Real-time data processing ensures that data collected from various sources is immediately available for analysis. This immediacy is crucial in environments where conditions change rapidly, such as financial markets or supply chain management. By processing data as it arrives, BI platforms can quickly identify and respond to emerging trends or anomalies.
Enhanced Model Accuracy: The predictive models in BI tools depend heavily on the freshness of the data they use. With real-time processing, these models are continuously updated with the latest inputs, which helps maintain their accuracy and relevance. This is particularly important for predictive models used in dynamic sectors like retail or online services, where consumer behavior can shift dramatically in a short time.
Visualization for Predictive Insights
Interactive Dashboards and Reports: Visualization tools such as dashboards and interactive reports transform complex datasets into understandable and actionable insights. These tools allow users to see patterns and correlations that might not be evident from raw data alone, making it easier to predict future trends.
Facilitating Faster Decision-Making: By presenting data in an easy-to-digest format, visualization tools enable quicker decision-making. Stakeholders can assess the current state of affairs at a glance and make informed decisions without needing to parse through extensive reports or raw data tables.
A logistics company uses a BI platform that provides real-time dashboards showing vehicle locations, traffic conditions, and delivery statuses. This visualization allows management to predict and mitigate potential delays by rerouting vehicles or adjusting delivery schedules on the fly.
Synergy of Real-Time Processing and Visualization
Combined Impact on Predictive Analytics: When real-time data processing and visualization work together, they amplify the predictive capabilities of BI platforms. Real-time processing feeds fresh data into predictive models, ensuring that the insights drawn are timely and relevant. Visualization then turns these insights into visual formats that are easy to understand and act upon, even for those without deep technical expertise.
Proving Predictive Capability: The ability of a BI platform to combine these features and provide timely, accurate predictions can be seen in industries like finance and health care. For example, real-time stock trading platforms analyze vast amounts of financial data in real-time, allowing traders to predict stock movements based on the latest market trends. Similarly, in health care, real-time data processing and visualization help predict patient care needs, enhancing the ability to provide proactive treatment.
Conclusion
As we've seen, the capabilities of Business Intelligence platforms are transforming businesses into forward-thinking, trend-setting powerhouses. The climb from a $10.5 billion industry to a projected $28.1 billion by 2026 is the value that predictive analytics brings to the table. It's an exciting time to be at the front of data analytics, where every piece of data holds the potential to unlock new opportunities and guide strategic decision-making.
Your BI platform is not just a tool; it's your gateway to understanding and leading in your industry. With the integration of AI and Machine learning, along with real-time data processing and visualization, you're not just keeping pace with industry trends—you're predicting them. Only a limited few Business Intelligence software companies can offer you such cutting-edge technology.
If you're looking to not only participate in this growth but also drive it, consider what a Business Intelligence tool like Grow can offer. With a 14-day free trial, you have the opportunity to experience firsthand how Grow can amplify your data’s value and convert it into actionable insights. Dive into the 'Grow Reviews 2024' to hear from businesses just like yours that have transformed their strategy and operations using Grow's advanced BI capabilities.
Don't let the future be a series of missed opportunities. Instead, make the most of the present with tools that can provide a window into tomorrow’s trends. Start your journey with Grow today, and step into a world where your data doesn't just tell a story—it predicts the sequel.
Your next business breakthrough is waiting—grab it with the right BI platform.
0 notes
Text
Discover Growth with Grow in Just 2 Minutes
Kickstart your journey to increased profitability with Grow’s extensive selection of business intelligence dashboards. From sales metrics to consumer behavior insights, our dashboards deliver a diverse array of data to help you effectively manage your business. Tailored to fit organizations of any size, our solutions are designed to meet your specific needs. Explore how our Business Intelligence dashboards can transform your data into actionable insights.
0 notes
Text
What Makes the Best BI Software Stand Out? Key Factors You Need to Know
How do you ensure that your organization is not just surviving but thriving?
The answer often lies in choosing the best Business Intelligence software. But what exactly sets the top BI tools apart from the rest? Why is choosing the right working BI software not just a necessity but a game-changer for your business?
Imagine having the ability to harness the full power of your data with ease, turning insights into action faster than ever before. Isn't that what every business strives for?
The Business Intelligence tools benefits go beyond simple data analysis—they empower organizations to make strategic decisions that can define their future. From small businesses to large enterprises, the impact of using the best Business Intelligence tools is profound, affecting every aspect of operations and strategic planning.
So, what should you look for in BI software to ensure you're getting the best value and performance?
This blog will dive deep into the essential factors that elevate the best BI software above the competition. Whether you're a seasoned data analyst or a business user eager to understand how BI can transform your operations, understanding these key elements will help you make an informed decision.
Ready to discover how the right BI tools can revolutionize your business? Let's get started.
What Sets Apart the Best Business Intelligence Software?
Integration and Compatibility
The ability of BI software to integrate seamlessly with a variety of data sources, applications, and existing IT infrastructure is a critical determinant of its utility and effectiveness. Seamless integration ensures that data flows smoothly from diverse sources into the BI system, where it can be processed and analyzed. This capability is essential for organizations that rely on real-time data to make informed decisions.
For it to be the best Business Intelligence software, it must support a wide range of data connectors and APIs that allow for easy connections with different databases, ERP systems, and cloud services. This flexibility not only simplifies the initial setup but also reduces potential data silos within an organization, promoting a more unified data environment.
Example: Grow BI Tool stands out as a working BI tool due to its robust integration capabilities with a wide range of applications, including CRMs like Salesforce, ERP systems like NetSuite, and various databases. This enables Grow to provide comprehensive insights across all business operations by consolidating data from disparate sources into one streamlined dashboard, enhancing both visibility and decision-making capabilities.
Compatibility extends beyond mere connectivity; it affects every user interaction with the BI tool. When BI software is compatible with a business’s existing platforms, it minimizes the learning curve and enhances user adoption rates. The best Business Intelligence tools are designed to work within the familiar interfaces and workflows that employees are accustomed to, which significantly improves user experience and operational efficiency.
Moreover, compatibility affects data management in several ways. First, it ensures data integrity by reducing the risk of errors during data transfer. Second, it facilitates better data governance as compatible systems are more likely to adhere to the same standards and protocols, ensuring that data handling remains compliant and secure.
2. Customization and Scalability
Customization: Customization means making the BI software fit your specific business needs. This allows for:
Better adoption: Users are more likely to embrace software that feels familiar and meets their specific needs.
Relevance: Custom features ensure the software provides insights that are directly useful to your business.
Flexibility: As your business evolves, so can your pre-exsiting working BI tools, without needing to start from scratch.
Scalability: Scalability is about the BI software growing with your business. This means:
Future-proofing: As your business grows, your BI system can handle more data and more users without a hitch.
Cost efficiency: You can save money in the long run as you won’t need to keep buying new software to meet increased demands.
Maintained performance: Even as data and usage grow, the system's performance stays strong, ensuring quick and effective decision-making.
Combining Both: The best Business Intelligence software bring both customization and scalability together, making sure the tool not only fits your business perfectly but also grows with it. This approach saves money, enhances efficiency, and keeps your operations agile.
3. User Interface and Experience
The primary goal of an effectively working BI tool UI is to make complex data comprehensible and actionable for all users, regardless of their technical expertise. An intuitive design:
Reduces Training Time: A user-friendly interface decreases the time and resources spent on training employees. Tools that are easy to navigate increase productivity by allowing users to start working with data sooner.
Enhances Data Interaction: Interactive dashboards and drag-and-drop functionalities make it easier for users to manipulate data and generate insights. This hands-on interaction encourages a deeper understanding and exploration of data.
Example: Grow is renowned for its intuitive design and no-code approach, which allows users to easily create and interact with sophisticated visualizations, making complex data analyses more accessible to non-technical users.
Visualization and Dashboard Functionality
Effective BI tools excel in their ability to visualize data in ways that are easy to understand and visually appealing. Good visualization capabilities:
Improve Comprehension: Well-designed charts and graphs help users quickly grasp complex information. Effective visualizations can highlight trends, outliers, and patterns that might be missed in raw data.
Enhance Decision Making: Dynamic and customizable dashboards allow users to focus on metrics that matter most to their specific roles or business needs, supporting better, data-driven decisions.
Example: Grow BI provides users with extensive customization options for dashboards and reports, enabling them to tailor visualizations to meet their specific business requirements.
Real-World Feedback on UI/UX
Feedback from actual users plays a crucial role in shaping the UI/UX of BI tools. BI developers often use this feedback to:
Identify Pain Points: Understanding where users struggle helps developers optimize workflows and interfaces to address those challenges.
Drive Continuous Improvement: Regular updates based on user feedback ensure that your already working BI tools evolves in a way that continues to meet the changing needs of its user base.
Impact on User Adoption and Satisfaction
The UI and UX of a BI tool are critical determinants of its adoption rate and overall satisfaction among users. A well-designed interface and positive user experience lead to:
Higher Adoption Rates: When users find software easy and pleasant to use, they are more likely to utilize it consistently.
Increased ROI: Effective use of BI tools can lead to better insights, more informed decisions, and ultimately, a higher return on investment for the organization.
Read, Do Grow's BI Tool Shows Its True ROI?
4. Advanced Analytics and AI Capabilities
Advanced analytics extends beyond traditional data analysis techniques by incorporating sophisticated statistical models, machine learning, and big data technologies. These capabilities allow businesses to uncover hidden patterns, complex relationships, and potential future trends from their data.
Key Benefits:
Predictive Insights: Advanced analytics enables predictive modeling, which uses historical data to forecast future trends, helping businesses anticipate market changes and customer behavior.
Increased Accuracy: Machine learning algorithms improve over time, learning from new data to refine their predictions and recommendations, which enhances the accuracy of insights.
AI Integration in BI Tools
BI tools with AI can automate routine data analysis tasks, so analysts can work on more complicated and strategic tasks. AI enhances BI tools in several ways:
Automated Data Preparation: AI algorithms can automate the cleaning and preparation of data, a task that traditionally consumes a significant portion of analysts' time.
Natural Language Processing (NLP): AI-powered NLP allows users to interact with BI systems using natural language queries, making data analysis more accessible to non-technical users.
Predictive Analytics and Machine Learning
The integration of predictive analytics and machine learning within BI tools represents a leap forward in how businesses can operationalize data. These technologies not only predict future scenarios but also provide recommendations for optimal outcomes.
Key Benefits:
Proactive Decision Making: With predictive analytics, businesses can take a proactive approach to solving problems and seizing opportunities by anticipating them before they occur.
Personalized Customer Experiences: Machine learning algorithms can analyze customer data to deliver personalized experiences, significantly improving customer satisfaction and retention.
Example: Salesforce Einstein Analytics embeds machine learning to deliver predictive insights directly within its CRM platform, enabling sales and marketing professionals to better predict customer behaviors and tailor their strategies accordingly.
5. Security and Compliance Features
Security features in BI software are designed to protect data from unauthorized access and breaches. Given the vast amounts of sensitive information that BI systems handle, the security of these systems is paramount.
Key Security Features:
Data Encryption: Encryption both at rest and in transit ensures that data is unreadable to unauthorized users. The best Business Intelligence tools employ strong encryption standards to secure data.
Access Controls: Robust access control mechanisms ensure that only authorized personnel have access to specific levels of data. This can be managed through role-based access controls (RBAC), which are critical in minimizing the risk of data exposure.
Audit Logs: Keeping detailed logs of who accessed what data and when helps in monitoring the system for any suspicious activity and is essential for forensic analysis in case of a security incident.
Example: Grow incorporates advanced security protocols, including data encryption and detailed audit trails, to ensure data security and regulatory compliance.
Compliance with Global Data Protection Regulations
Compliance is another cornerstone of BI software, especially for organizations operating in regulated industries or in multiple countries. Compliance with laws like GDPR in Europe or HIPAA in the United States is mandatory and necessitates specific features within BI tools.
Key Compliance Features:
Data Masking and Anonymization: To comply with privacy laws, the best Business Intelligence software offers data masking features which ensure that personal information is obscured or anonymized in reports.
Compliance Reports: Automated tools for generating reports that show auditors and regulators that the company is complying with relevant laws and regulations.
Example: Microsoft Power BI includes features that help organizations comply with GDPR, such as data classification, data loss prevention capabilities, and extensive compliance documentation.
Integrating Security and Compliance in Working BI Tools
The best Business Intelligence tools integrate security and compliance into the core architecture of their products. This integration is crucial for maintaining trust and ensuring that the BI tools can be used effectively without risking data breaches or non-compliance penalties.
Benefits of Integrated Security and Compliance:
Trust and Reliability: When users trust the security and compliance capabilities of their BI tools, they are more likely to use the tool to its full potential.
Reduced Legal and Financial Risk: Effective security and compliance features reduce the risk of costly legal issues and fines related to data breaches or failures to comply with laws.
Example: Grow, recognized as one of the best Business Intelligence tools, offers extensive security features, including user authentication and permission settings, alongside compliance.
Conclusion
Deciding on the right BI software can seem daunting, but understanding the key features that distinguish the best tools is important for leveraging the transformative power of your data. The Business Intelligence tools benefits include enhanced decision-making capabilities, increased operational efficiencies, and the ability to unearth actionable insights that can significantly propel your business forward.
As you weigh your options, consider a tool that not only meets your current needs but also grows with your business. Grow BI tool is an excellent example of such a solution. It blends ease of use with robust analytical capabilities, making it ideal for businesses of all sizes aiming to scale efficiently.
Why not see for yourself? Take advantage of Grow's 14-day free trial to experience firsthand how it can streamline your data analysis processes. And don’t just take our word for it—check out Grow Reviews from Verified Users on Capterra to hear directly from users who have transformed their approach to data with Grow.
Choosing the best BI software is more than just a technological upgrade—it's a strategic decision that impacts every layer of your organization. With the right tools, your data doesn’t just inform you—it drives you forward. So why wait? Start your trial with Grow today, and take the first step towards unlocking the full potential of your Business Intelligence.
0 notes
Text
Struggling with Data Accuracy? Implement These Data Cleansing Techniques in Your BI Software
Data quality issues often manifest as duplicate records, incorrect entries, and missing values, among other discrepancies.
For instance, a retail company might find that sales data discrepancies due to duplicate entries are causing an overestimation of inventory needs, leading to overstocking. Poor data quality like this can skew the analytics in Business Intelligence software, resulting in flawed business decisions.
The cost of ignoring such issues can be substantial, not only in monetary terms but also in lost opportunities and diminished trust in data-driven initiatives.
Key Data Cleansing Techniques for Enhanced BI
Normalization
Data is often sourced from various systems each with its unique structure and format. Without normalization, this data diversity can lead to inconsistencies that hinder accurate data analysis and reporting. For example, date formats can vary widely (MM/DD/YYYY, DD/MM/YYYY, YYYY-MM-DD), and without a standardized format, sorting and comparing dates accurately across systems would be problematic.
Benefits of Data Normalization
Consistency: Uniform data formats across all systems and datasets allow for reliable data aggregation and comparison.
Accuracy: Reduces errors during data analysis by ensuring that all data adheres to the same format and scale.
Efficiency: Streamlines BI processes by simplifying data integration, storage, and retrieval, thereby enhancing performance.
Improved Analytics: Facilitates more sophisticated analytics, as standardized data can be more easily subjected to various analytical techniques in Business Intelligence software.
Scalability: As organizations grow and data becomes more complex, normalization ensures that new data sources can be seamlessly integrated into existing BI frameworks.
Normalization Techniques
The approach to normalization typically involves several key steps, each tailored to the specific requirements of the data and the intended use within the BI system:
Assessment of Data Format Variability: Begin by cataloging the various data formats present in your datasets. This could involve different units of measurement, date formats, or categorical labels that vary across sources.
Development of Standardization Rules: Define clear rules for how different data types should be formatted. This includes deciding on standard units of measure, date formats, text casing (e.g., all caps, title case), and numerical representations (e.g., decimal places).
Application of Transformation Functions: Use functions within your BI tools to convert data to the chosen formats. For instance, SQL functions like CAST or CONVERT can change data types or formats, and string functions can adjust text data.
Automating Normalization Processes: Implement automation scripts or use built-in features in BI software to apply these transformations routinely as new data loads into the system.
Continuous Monitoring and Updating: Regularly review and refine the normalization rules to accommodate new data types or sources, ensuring ongoing consistency and accuracy.
2. Deduplication
Duplicate records often arise during data collection and integration from multiple sources, such as merging customer databases from different departments or importing historical data into a new BI software. These duplicates can distort analytics, such as inflating customer counts or misrepresenting sales figures, leading to erroneous business insights and decisions.
Benefits of Implementing Deduplication
Improved Data Accuracy: By eliminating redundancies, deduplication enhances the precision of the data analytics performed by Business Intelligence tools.
Enhanced Decision Making: Clean, non-redundant data ensures that business decisions are based on accurate and reliable data insights.
Increased Efficiency: Reduces the data volume that BI solutions need to process, which can speed up analysis and reduce the load on system resources.
Cost Savings: Lower storage requirements by eliminating unnecessary data duplication, thus optimizing infrastructure costs.
Better Customer Insights: In scenarios involving customer data, deduplication helps in providing a unified view of each customer, which is crucial for effective customer relationship management and personalized marketing.
Deduplication Techniques and Methodologies
Implementing deduplication involves a series of strategic steps within BI environments:
Data Identification: Use algorithms to scan through the dataset and identify potential duplicates. This might involve matching records based on key attributes such as names, addresses, or unique identifiers.
Record Linkage: Establish rules for how records are linked. This might include exact match criteria or more complex fuzzy matching techniques that can identify non-identical duplicates (e.g., 'Jon Smith' vs. 'Jonathan Smith').
Review and Resolution: Once potential duplicates are identified, data managers must decide whether to delete redundant records or merge them. Merging involves consolidating multiple entries into a single record while preserving important unique data from each.
Automation of Deduplication Processes: Implement automated tools and scripts within your BI software that continuously perform deduplication. This is especially important in dynamic environments where new data is constantly added. Read Data Deduplication With AI.
Continuous Monitoring and Improvement: Regularly update deduplication rules and processes to adapt to new data sources and changing business requirements.
3. Validation and Verification
Validation and verification are essential for maintaining high data quality by confirming that data inputs and outputs meet predefined standards and rules. In BI systems, where decision-making is heavily reliant on data, even minor inaccuracies can lead to significant financial losses, strategic missteps, and erosion of trust in data systems. Ensuring data integrity through rigorous validation and verification is, therefore, a key concern for business users, data analysts, and BI professionals.
Key Benefits of Robust Validation and Verification
Enhanced Accuracy: Ensures that data used in BI analytics is correct and reliable, leading to more accurate business forecasts and strategies.
Improved Compliance: Meets regulatory and internal standards, which is crucial for industries such as finance and healthcare where data handling is heavily regulated.
Increased User Confidence: Builds trust among users in the reliability of the BI software, encouraging data-driven decision-making across the organization.
Risk Reduction: Minimizes the risks associated with data errors, such as incorrect customer data leading to poor customer service experiences.
Effective Techniques for Validation and Verification in BI Systems
Implementing validation and verification within BI tools involves several strategic and technical measures designed to ensure data integrity at various stages of the data lifecycle:
Data Input Validation: Ensures that incoming data into a BI solution adheres to specific format, type, and value constraints. This can be achieved by:
Setting up data type checks (e.g., ensuring numeric inputs are not accepted as text).
Implementing format validations (e.g., dates in YYYY-MM-DD format).
Applying range validations (e.g., discount rates between 0% and 50%).
Data Output Verification: Verifies that outputs from Business Intelligence tools are consistent and accurate relative to the input data. This is particularly important after data transformation processes. Techniques include:
Cross-referencing outputs with external trusted datasets to confirm accuracy.
Using checksums and hashes to verify large datasets without needing to compare all data manually.
Automated Testing: Incorporates automated tests that regularly validate and verify data within the Business Intelligence software. Automation ensures ongoing compliance and integrity, significantly reducing the manual effort required and the potential for human error.
Data Quality Audits: Regular audits of data quality within BI tools, checking for consistency, accuracy, and adherence to business rules and standards.
Missing Data Handling: Managing Incompleteness in BI Systems
Missing data can arise from various sources, such as errors in data entry, differences in data collection methods, or integration issues between disparate systems. In BI contexts, incomplete data can lead to biased decisions, misinformed strategies, and ultimately financial losses. Hence, robust handling of missing data is essential to leverage the full potential of Business Intelligence tools in driving organizational success.
Benefits of Effective Missing Data Management
Improved Data Quality: Filling or properly handling missing data reduces biases and errors in BI reports.
Enhanced Decision Making: Accurate and complete data ensures that decisions are based on the most comprehensive view of available information.
Increased Reliability: BI software that reliably handles missing data builds confidence among users in the insights it generates.
Regulatory Compliance: Adequate handling of gaps in data can also help meet compliance standards, which often require complete and accurate reporting.
Techniques for Managing Missing Data in BI Software
Effective management of missing data involves selecting the right strategy based on the nature of the data and the analytical goals of the BI solution. Here are several approaches commonly used in Business Intelligence software:
Deletion:
Listwise Deletion: Removes all data records that contain any missing values, used when the missing data is random and sparse.
Pairwise Deletion: Utilizes available data in the analysis without deleting entire records, suitable for correlations where missing data is not pervasive.
Imputation:
Mean/Median/Mode Imputation: Replaces missing values with the mean, median, or mode of the column, ideal for numerical data where additional data nuances are less critical.
Regression Imputation: Estimates missing values using linear regression, useful in scenarios where data relationships are strong and predictable.
K-Nearest Neighbors (KNN): Imputes values based on the 'k' closest neighbors to a given record, effective in more complex datasets where patterns can indicate missing data points.
Using Algorithmic Approaches:
Multiple Imputation: Generates multiple versions of the dataset with different imputations, providing a comprehensive analysis of possible outcomes.
Maximum Likelihood Techniques: Utilizes a statistical model to estimate the most likely values of missing data, optimizing the overall data set's statistical properties.
Also, read Solving Data Inconsistencies: How Coalesce Transform Enhances BI Reporting
Data Enrichment
Data enrichment is a crucial process in the realm of Business Intelligence (BI) that involves augmenting internal data with external data sources. This technique enhances the depth and breadth of datasets, providing more detailed insights that are critical for sophisticated analysis and decision-making. Effective data enrichment can transform BI software from a simple data reporting tool into a powerful decision support system.
Benefits of Data Enrichment in BI Software
Enhanced Decision-Making: Enriched data provides a more complete view of the business landscape, enabling more informed decisions.
Improved Customer Insights: Adding demographic and psychographic data to customer records helps in creating more targeted marketing campaigns and personalized customer experiences.
Increased Data Value: External data can reveal trends and patterns not visible with internal data alone, adding value to existing BI analytics.
Risk Mitigation: Incorporating external data such as market trends and economic indicators can help companies anticipate changes and adjust strategies accordingly.
Strategies for Data Enrichment in BI Tools
Implementing data enrichment involves several key steps to ensure that the external data enhances the existing BI system effectively:
Identifying Relevant Data Sources:
Determine what external data could complement the internal datasets. Common sources include social media feeds, economic reports, demographic information, and third-party databases.
Evaluate the credibility and reliability of these sources to ensure they meet the organization’s standards for data quality.
Integrating Data:
Use APIs or data integration tools to automate the flow of external data into the BI solution. This integration must be secure to protect data integrity and privacy.
Match the external data with internal datasets accurately, which might involve techniques like record linkage, entity resolution, or fuzzy matching.
Maintaining Data Quality:
Regularly validate and cleanse the integrated data to ensure it remains accurate and relevant. This is crucial as external data sources can change, impacting the quality and reliability of insights derived from Business Intelligence tools.
Monitor the external data sources for changes in data provision policies or quality to adjust the integration processes as necessary.
Conclusion
The accuracy and integrity of your data can make or break the insights derived from BI software. As we've explored throughout this blog, implementing robust data cleansing techniques is not just an option but a necessity for any business that relies on data to inform its decisions. From normalization and deduplication to validation, verification, and data enrichment, these strategies ensure that your data is not only accurate but also actionable.
If you're ready to take your BI capabilities to the next level and significantly reduce data accuracy issues, why not start with a tool designed to facilitate and streamline this process? Grow offers a comprehensive BI solution that integrates seamlessly with your existing systems, equipped with advanced features to help automate and manage data cleansing tasks efficiently.
Start your journey towards cleaner data and clearer insights today with Grow's 14-day free trial. Experience firsthand how easy and impactful cleaning your data can be when using the right tools.
Don't just take our word for it; check out the Grow.com Reviews & Product Details on G2 to see how other businesses like yours have transformed their data handling practices using Grow. Enhance your decision-making process, ensure data accuracy, and push your business forward with confidence.
Take action now to harness the full potential of your BI software with Grow. Sign up for your free trial and begin exploring the possibilities of a cleaner, more efficient data environment.
Your data deserves the best treatment, and with the right techniques and tools, you can ensure it supports your business effectively. Let Grow help you make the most of your data, starting today!
0 notes
Text
5 Essential SQL Queries for Dynamic Data Analysis
The speed and accuracy of your data analysis can mean the difference between staying ahead of the competition or falling behind. Data is growing at an unprecedented rate; according to Forbes, over 2.5 quintillion bytes of data are produced by humans every day. In such a landscape, having the right business analytics tools at your disposal is not just valuable—it's essential. SQL, or Structured Query Language, is the key to unlocking the potential of this data, offering precision, efficiency, and the flexibility needed to perform complex analyses and derive actionable insights.
Whether you're a business analyst at a data analytics company grappling with ever-changing market dynamics, a data scientist seeking to fine-tune predictive models, or a business leader striving to make data-backed decisions with sophisticated business analytics solutions, mastering a handful of essential SQL queries can transform your approach to data analysis. This blog post is dedicated to demystifying five crucial SQL queries that stand out for their ability to handle dynamic data analysis needs. These queries will help you not only to enhance your reporting capabilities but also to adapt more swiftly to the evolving demands of the business landscape, ensuring you make the most of your tools for business analytics.
Prepare to dive into the core of SQL techniques that will empower your data analysis, ensuring you remain agile and informed in a world where data never sleeps.
5 Basic SQL Queries for Dynamic Data Analysis
1. Dynamic Date Ranges for Time-Sensitive Analysis
Decision-making often hinges on having the most current data at your fingertips. Dynamic date ranges are essential for ensuring that the information used to guide decisions is both relevant and timely. By leveraging dynamic SQL queries, businesses can automate the process of data extraction over variable periods, such as the last 30 days, the previous month, or year-to-date. This capability not only streamlines workflows but also ensures that the data reflects recent trends and events, making it indispensable for real-time analysis.
The utilization of dynamic date ranges is particularly crucial in industries where conditions change rapidly, such as retail, finance, and online services. Here, the ability to quickly adapt and respond to information can be the difference between capitalizing on opportunities and falling behind competitors. This is where advanced business analytics tools come into play, providing the agility needed to navigate these changes effectively.
Example: Automating Reports with SQL
To illustrate the practical application of dynamic date ranges, consider a SQL query designed to automate the generation of reports for the last 30 days.

This SQL script is designed to fetch sales data from the past 30 days, grouping the results by product name and ordering them by the total sales in descending order. It provides clear, actionable insights into which products are performing best, enabling businesses to adjust their strategies accordingly.
2. Conditional Aggregations for Multi-Dimensional Analysis
When it comes to data analysis, conditional aggregation stands as a potent technique that enables businesses to uncover nuanced insights from their datasets. This method involves the application of conditions within aggregation functions like SUM() and AVG(), allowing analysts to segment data dynamically based on specific business scenarios. By adopting this approach, companies using advanced business analytics tools can achieve a more granular understanding of their data, leading to more precise decision-making.
The importance of conditional aggregations extends across various business functions, from marketing and sales to finance and operations, highlighting its versatility and critical role in enhancing business analytics solutions. This technique is particularly valuable in environments where data-driven insights are necessary to optimize performance and respond effectively to market dynamics.
Example: Segmenting Data with SQL
Consider an SQL code snippet that segments sales data by product category to calculate the average sales, but only for those products achieving a minimum sales volume threshold. This segmentation allows businesses to focus on significant categories while excluding outliers or underperforming segments that might skew overall insights.
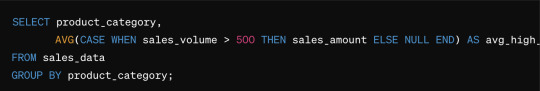
In this example, the CASE statement within the AVG() function calculates the average sales amount only for those entries where the sales volume exceeds 500 units. This method ensures that the averages reflect the performance of core product categories, thus providing a more accurate and relevant measure of success.
Business Impact: Tailoring Analytics to Business Needs
Conditional aggregations provide a customizable framework for data analysis that can be finely tuned to meet the specific needs of different business scenarios. This adaptability is crucial for companies striving to maintain precision in their strategic analyses and operational reports.
Enhancing Reporting Accuracy: By filtering and aggregating data based on predefined conditions, businesses ensure that their analytics outputs are not only accurate but also highly relevant to their specific operational contexts. This precision is essential for maintaining the integrity of business analytics reports and supports confident decision-making.
Tailoring to Market Needs: Different market segments and product lines may perform differently under varying conditions. Conditional aggregations allow businesses to dissect these differences and adapt their strategies accordingly. For instance, a data analytics company can help a retail client analyze seasonal performance variations across products, enabling targeted inventory strategies that align with anticipated demand.
Optimizing Business Strategies: By leveraging tools for business analytics with capabilities for conditional aggregation, companies can optimize their approaches to marketing campaigns, product development, and customer segmentation. This tailored analysis supports more effective targeting and resource allocation, ensuring that efforts are concentrated where they can generate the most significant impact.
3. Rolling Averages and Moving Sums for Trend Analysis
Understanding how metrics evolve over time is essential. Rolling averages and moving sums are critical tools for analyzing these trends over moving time windows, providing businesses with a smoothed view of data fluctuations. This smoothing effect helps in minimizing the noise associated with short-term variations, allowing for clearer trend analysis and better decision-making. Integrating these methodologies into tools for business analytics facilitates more dynamic and responsive business strategies.
Example: SQL for Calculating Rolling Averages and Moving Sums
To put these concepts into practice, consider a SQL query that calculates a 7-day rolling average and moving sum for daily sales. Such calculations are instrumental in identifying sales trends, helping businesses anticipate changes in consumer behavior.
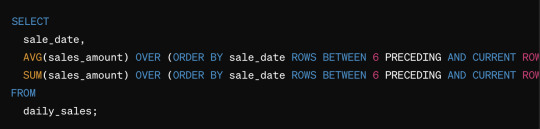
This query uses the OVER() clause with ORDER BY to specify the window of records used for each calculation, effectively creating a moving window that updates with each new record. The ROWS BETWEEN clause is key to defining the size of this window, in this case, the current day and the six preceding days.
Once the rolling averages and moving sums are calculated, visualizing these trends can vastly improve their interpretability. Business analytics tools often provide advanced visualization capabilities that can be leveraged to present these trends.
Business Impact: Strategic Forecasting and Operational Planning
The application of rolling averages and moving sums significantly impacts forecasting and operational planning. These metrics allow businesses to predict future trends based on historical data, facilitating more informed strategic decisions.
Forecasting: By smoothing out variances, rolling averages provide a more reliable basis for forecasting sales, budget needs, or resource requirements. This is particularly useful in industries like retail or manufacturing where anticipating market demand can lead to optimized inventory management.
Operational Planning: Moving sums give a cumulative picture over the specified period, which can be crucial for operational decisions such as staffing and logistics. For example, a sudden increase in the moving sum of customer service calls might prompt a business to allocate more resources to their call centers.
Adaptive Strategies: With these insights, businesses can adapt more swiftly to market changes. This agility is often a competitive advantage, allowing firms to adjust pricing, promotions, and stock levels dynamically.
4. Recursive Queries for Hierarchical Data Exploration
In many sectors, from retail to manufacturing to corporate management, data is not flat but hierarchically structured. Understanding these hierarchical or nested relationships is crucial for effective data analysis and operational efficiency. Recursive queries, particularly through Common Table Expressions (CTEs), are powerful tools for business analytics that navigate and make sense of these complex data structures. They enable businesses to traverse and manipulate hierarchical data efficiently, which is essential for accurate reporting and strategic decision-making.
Example: Recursive CTE for Organizational Hierarchy
A practical example of a recursive CTE can illustrate how to explore an organizational hierarchy or product category structure. This type of query is invaluable for businesses that need to analyze data across various levels of granularity.

This SQL snippet initiates with the root of the hierarchy (e.g., the CEO who has no manager) and recursively joins the employee table to itself to fetch all subsequent levels of employees under each manager. The result is a comprehensive view of the organizational structure.
Business Impact: Enhancing Management and Operational Strategies
Understanding hierarchical relationships through recursive queries can significantly enhance various business operations by providing deep insights into organizational structure, product categories, and more.
Inventory Management: For retailers, recursive queries can map the entire product hierarchy, from broad categories down to individual SKUs. This detailed view supports better inventory decisions, helping managers understand which items are underperforming or overstocked, and how they relate to other items in the hierarchy.
Organizational Structure Analysis: In corporate settings, understanding the organizational hierarchy helps in optimizing management strategies and improving communication flows. It allows HR and management teams to ensure that resource allocation is aligned with company objectives and that every department or team is structured optimally to support its function.
Resource Allocation: By visualizing complex relationships, businesses can allocate resources more effectively. For example, in project management, understanding the dependencies between tasks (hierarchically related) is crucial for effective scheduling and resource allocation.
Strategic Planning: Recursive queries assist strategic planners by providing a clear view of the organizational or product structures. This insight is vital for planning expansions, reorganizations, or product line enhancements.
5. Pivot Tables for Dynamic Data Structuring and Reporting
Pivot tables in SQL offer a transformative approach to data analysis, providing the flexibility to convert row-based data into a column-based format for easier comparison and more intuitive insights. This capability is particularly valuable in environments where data needs to be quickly reorganized for various analytical purposes, enabling dynamic reporting and decision-making. As a crucial component of tools for business analytics, pivot tables help businesses manipulate and present data in customized views, thus enhancing the effectiveness of data-driven strategies.
Example: Creating a Pivot Table with SQL
To illustrate the practical use of SQL for generating pivot tables, consider a scenario where a business needs to analyze monthly sales data by product categories across different regions. The following SQL query demonstrates how to create a pivot table that summarizes this data, providing a clear overview of sales performance by region and category.
This query first selects the necessary data from the sales data table and then uses the PIVOT operator to transform this data into a format where each row represents a product category and each column represents a region, with the cells showing the sum of sales for each category-region pair. This transformation allows for quick cross-regional comparisons and trend identification.
Business Impact: Using Pivot Tables in Different Business Scenarios
Dynamic Financial Reporting: Pivot tables are indispensable in financial analysis, providing a structured way to display financial data, such as monthly revenues or expenses by department or region. This structure helps financial analysts and business leaders quickly assess financial health and make informed budgeting decisions.
Sales Data Analysis: In sales, pivot tables can be used to segment data in various ways, such as by product, time period, or demographic. This segmentation enables sales teams to identify which products are performing well in which markets, helping to tailor marketing strategies and optimize sales efforts.
Marketing Performance Metrics: For marketing teams, pivot tables offer a way to measure the effectiveness of different campaigns across various channels. By organizing campaign data into a pivot table format, marketers can compare the performance metrics (like conversion rates and ROI) across different campaigns, identifying the most successful strategies and areas for improvement.
Strategic Advantages: With the ability to quickly reorganize and summarize large datasets, pivot tables enhance the agility of business analytics solutions. This flexibility is crucial for adapting to market changes, enabling businesses to respond quickly with data-supported strategies. The use of pivot tables in business analytics tools helps companies maintain a competitive edge by allowing them to pivot their strategies based on real-time data analysis.
Conclusion
In this blog, we've explored five essential SQL queries that are important for dynamic data analysis, each serving as a key to unlocking deeper insights and enhancing business operations. From dynamic date ranges to sophisticated pivot tables, mastering these queries allows business users, data analysts, and BI professionals to leverage data in powerful, strategic ways. However, even with SQL expertise, the real magic happens when you combine these skills with advanced, user-friendly business analytics tools.
For those looking to streamline their data analysis further, Grow’s full-stack, no-code BI tools offer a compelling solution. Grow simplifies the complexity of data analytics by providing a no-code platform that integrates seamlessly with your existing data sources. Whether you're looking to implement rolling averages, recursive queries, or dynamic pivot tables, Grow’s intuitive interface and powerful functionality make it accessible to users at all technical levels.
Interested in seeing how Grow can transform your data analysis process? Take advantage of Grow's 14-day free trial to experience firsthand how easy and impactful data analytics can be when you have the right tools at your disposal. Dive into Grow's capabilities and discover why it is highly rated on platforms like Capterra Grow.com.
Don't miss out on the opportunity to enhance your business intelligence capabilities. Visit grow.com and start your free trial today. Empower your business with data insights that drive success – with Grow, you're not just running reports; you're growing your business.
0 notes
Text
Why Most BI Reporting Tools Fail at Real-Time Analytics
As leaders, how often do we find ourselves deeply immersed in the hustle and bustle of our day-to-day operations, working closely with our teams to navigate the complex landscape of business data? Do you ever stop to wonder if you're really making the most of the vast amounts of data at your disposal?
Consider the experience of John Hawkins, founder and owner of Hawkins Law Firm, a seasoned personal injury and worker’s compensation firm in South Carolina. John and his team were no strangers to data; they had it in abundance. Yet, he openly admits,
“Before Grow, it was a challenge trying to use the large amount of data that we had available to us.”
They had the data, but the clarity and insights were missing. Their struggle isn’t unique. Like many businesses, they knew that visualizing their data could unlock understanding and drive strategic action—but how?
This is where the tool 'Grow' stepped in, transforming not just the Hawkins Law Firm but offering a glimpse into why many BI reporting tools fail at real-time analytics. Grow didn’t just collect data; it made data instantly understandable and actionable. “We were immediately able to track leads and status on current cases,” Hawkins reveals. Suddenly, the entire team—from attorneys to finance members—were not just seeing data but interacting with it in meaningful ways to stay on target with their goals.
Why do most BI reporting tools fall short where Grow succeeds? Many tools can gather and report data, but they falter in real-time processing and visualization, failing to offer the insights that businesses need when they need them.
Let’s delve deeper into this issue and discover how we can overcome these common pitfalls in BI reports to make real-time analytics a basis of successful business intelligence.
What is Real-Time Analytics
In business intelligence, real-time data analytics refers to the ability to process and analyze data as soon as it enters the system, providing immediate insights and enabling instant decision-making. Unlike traditional methods that involve periodic updates, real-time analytics ensures that BI reports are always updated with the latest data. This capability is crucial in dynamic environments where conditions change rapidly, such as financial markets, online retail, and supply chain management.
Real-time data processing in BI reporting is marked by several distinctive characteristics:
Speed and Timeliness: The foremost attribute of real-time analytics is the speed with which data is processed and made available. It's not just about fast processing but also about minimizing the latency between data creation and data usability.
Continuous Analysis: Unlike batch processing, which runs at scheduled intervals, real-time processing involves continuous analysis of data streams. This ongoing process ensures that the data available in Business Intelligence reports is reflective of the most current state of affairs.
Automated Triggers: Real-time systems often utilize triggers that automatically initiate actions based on specific data patterns or thresholds. For example, in fraud detection, a transaction that seems unusual can immediately trigger an alert or a preventive action.
Scalability: Handling vast volumes of data in real-time requires systems that can scale rapidly without degrading performance. Effective real-time BI reporting tools must be able to manage fluctuations in data volume seamlessly.
The integration of real-time analytics into BI reporting tools is not without its technical challenges.
Data Volume and Velocity
One of the foremost challenges in real-time BI reporting is handling the massive volume and high velocity of incoming data. In real-time environments, data flows continuously, requiring BI tools to process and analyze data at speeds that traditional systems are often not designed to handle.
Impact on Systems: Traditional Business Intelligence reporting tools may struggle with this influx, leading to slow query responses and delayed reports. Such delays can undermine decision-making processes that rely on speed and accuracy.
Solutions: Optimizing data architecture with technologies such as in-memory databases and stream processing can help. These technologies allow for faster data ingestion and querying by reducing reliance on disk-based storage and handling data in a near real-time stream.
Integration Complexity
Real-time BI reporting requires the integration of various data sources, including IoT devices, customer interaction systems, and operational data stores. Each source may use different data formats and standards, complicating the integration process.
Challenges: The diversity of data types and sources can lead to significant integration hurdles. Mismatched data formats and incompatible systems can prevent the seamless flow of data, essential for accurate real-time analytics.
Strategies for Integration: Employing middleware solutions or adopting an API-first approach can facilitate smoother integration. These approaches help standardize data exchanges between different systems and platforms, ensuring that Business Intelligence report are both comprehensive and reliable.
Learn How Grow's KPI Dashboard Uses REST API
Performance and Scalability Issues
As organizations grow and data volumes increase, maintaining performance while scaling BI tools becomes a critical challenge. The ability of BI systems to scale effectively is crucial for sustaining the quality of real-time analytics.
Performance Bottlenecks: Without proper scalability, systems may experience bottlenecks that can lead to data latency and reduced operational efficiency.
Scalability Solutions: Cloud-based Business Intelligence reporting tools offer scalable solutions that can dynamically adjust resources based on demand. Adopting distributed architectures can also distribute the load across multiple nodes, enhancing both performance and reliability.
Limitations of Traditional BI Tools for Effective Real-Time Analytics
Insufficient Real-Time Data Processing Capabilities
Stream processing is crucial for real-time data as it allows for continuous input and output of data streams. Without it, traditional BI tools must rely on periodic batch processing, which can delay insight generation and decision-making.
This inability to process data in real time can lead to outdated insights, potentially causing businesses to miss out on immediate opportunities or fail to respond to emerging threats swiftly.
Limited Access to Advanced Analytics
Advanced analytics, including predictive analytics and machine learning, are increasingly important in real-time BI contexts. They enable predictive decision-making and trend spotting, which are crucial for proactive business strategies. However, traditional Business Intelligence reports often lack seamless integration with these advanced analytical tools.
Predictive analytics use historical data to forecast future outcomes, providing businesses with a predictive edge in their decision-making processes. Without these capabilities, businesses are less equipped to anticipate market changes.
Machine learning can significantly enhance real-time analytics by continuously improving data analysis processes based on incoming data. Traditional Business Intelligence reporting tools often do not support these integrations natively, hindering their ability to adapt and learn from new data effectively.
Inadequate Visualization Options
Visualization is a critical component of data analytics, providing an intuitive way for users to understand complex data. However, real-time data visualization demands are significantly different and more complex than those for static data.
Real-time operations require dynamic visualizations that update automatically and instantly as new data flows in. Traditional BI tools often only provide static or slowly updating visuals, which are not suitable for real-time decision-making.
Effective real-time visualization tools should also offer interactive user interfaces that allow users to drill down into live data for deeper insights. Many traditional tools lack this level of interactivity, which can impede the user's ability to make informed decisions quickly.
Business Implications of Ineffective Real-Time Analytics
Delayed Decision Making
When real-time analytics are not effectively integrated into BI reporting tools, the lag in data processing and reporting can lead to delayed decision-making. In fast-moving sectors such as finance, retail, or technology, delays can be particularly detrimental, affecting everything from customer satisfaction to revenue generation.
Operational delays can escalate, affecting supply chain management, customer service response times, and even real-time pricing adjustments, all of which rely heavily on timely data insights.
Strategically, delays in decision-making can mean missed opportunities. For instance, a delayed market entry or an untimely stock purchase can result in significant financial losses or missed market share gains.
Risk of Data Overload
Ineffective real-time analytics often struggle to filter and prioritize the deluge of incoming data, leading to data overload. Without the ability to extract actionable insights swiftly, businesses can become overwhelmed, which obscures critical decision-making pathways.
The phenomenon of analysis paralysis, where decision-makers are overwhelmed by too much information and unable to act, is a common consequence of data overload. Effective Business Intelligence reports must not only present data but also highlight actionable insights.
Even the quality of insights can be compromised if BI reporting tools are not tailored to discern relevant data quickly. This scenario often leads to making decisions based on incomplete or irrelevant data, affecting the overall business efficacy.
Competitive Disadvantage
Perhaps the most significant impact of ineffective real-time analytics is the competitive disadvantage it creates. Companies that fail to leverage real-time insights effectively find themselves trailing behind competitors who are more adept at navigating the data-driven landscape.
In industries that are particularly volatile, such as e-commerce or telecommunications, the ability to adapt to market changes based on real-time data is crucial. Lack of adaptability can result in losing market share to more agile competitors.
Effective real-time analytics are often the backbone of innovation within companies, particularly those dealing with products and services that require rapid iteration based on user feedback and behavior. Inefficient real-time BI reports can stifle these innovations, preventing companies from evolving and meeting their customer's needs.
Conclusion
The challenges inherent in traditional BI reporting—ranging from insufficient real-time data processing capabilities to inadequate visualization options—highlight why many of these tools fall short of supporting effective real-time analytics. As businesses increasingly rely on immediate data insights to make informed decisions, the need for more capable and flexible solutions becomes undeniable.
Recognizing these needs, Grow offers a robust alternative that is designed to overcome the typical limitations of traditional BI reporting tools. With advanced data integration capabilities, dynamic visualization features, and real-time processing, Grow equips businesses to harness the power of their data without the common delays and complications associated with other platforms.
If your organization is experiencing the pitfalls of ineffective real-time analytics and you're looking for a solution that can provide comprehensive insights with minimal latency, consider exploring what Grow has to offer. With Grow's free trial, you have the opportunity to test out its features and see firsthand how it can streamline your data analysis processes and enhance your decision-making speed.
Don't let outdated BI tools slow down your business. Sign up for Grow's 14-day free trial today and start experiencing the benefits of real-time analytics done right.
Learn more about how Grow can fit into your budget by checking the "Grow Pricing 2024 Capterra" for detailed pricing information and customer reviews.
Embrace the future of business intelligence with Grow BI reporting and turn real-time data into real-time growth.
0 notes
Text
How Visualization Software Betters Data Interpretation in Real-Time Analytics
Have you ever wondered how a high-end business like Edit Suits Co., known for its made-to-measure menswear and exceptional customer service, keeps up with the fast-paced demands of the fashion industry? How do they manage sprawling operations across continents while ensuring every customer feels uniquely catered to? Imagine being able to see your business data unfold in real time, turning every piece of information into an opportunity for growth. How dynamic would that be for your business?
Patrick Jungo, the co-founder of Edit Suits Co., faced a similar dilemma. With operations split between London and Singapore, the challenge wasn't just about managing teams or inventory—it was about harnessing and interpreting scattered data efficiently to make informed decisions swiftly. As the business grew, so did the complexity of managing data from various sources.
"Information started to become more scattered,"
Patrick noted, as he realized the pressing need for a tool that could consolidate and track their data sources comprehensively.
Enter Grow—the data visualization software that became a game-changer for Edit Suits. With Grow, Patrick and his team could integrate all essential business aspects from marketing and sales to operations and customer service into one dynamic platform. Real-time inventory dashboards became particularly crucial. These dashboards allowed Edit Suits to monitor fabric levels actively, integrating directly with suppliers and significantly reducing the time spent on phone calls and manual checks. This integration not only streamlined operations but also ensured that they could meet customer demands without delay.
But how does this relate to you and your business? Whether you're managing a global enterprise or a local startup, the ability to visualize and act on your data in real time can redefine how you navigate challenges and seize opportunities. Are you ready to transform how you interact with your business data? Let’s explore how visualization software like Grow can help you keep your finger on the pulse of your business, ensuring you're not just responsive, but proactive in your industry.
The Role of Visualization Software in Real-Time Analytics
Data visualization software is a tool that enables businesses to convert raw data into graphical representations, leading to easier interpretation and quicker decision-making. At its core, it extracts data from various sources, processes it, and displays it in a visual context, such as graphs, charts, or maps. This type of software is crucial in real-time analytics because it allows businesses to see analytics visualized immediately as data flows in, enabling instant feedback and action.
For business intelligence data visualization, these tools are not just about presenting data attractively; they are about making data comprehensible at a glance. The power of data visualization software lies in its ability to highlight trends, outliers, and patterns that might go unnoticed in raw numerical data.
Moreover, with the growth in no-code data visualization platforms, these tools have become accessible to non-technical users, democratizing data and empowering a broader base within an organization to engage with analytics directly.
Types of Data Visualizations Typically Used in Real-Time Scenarios
In real-time analytics, certain types of visualizations are preferred due to their ability to update dynamically and display changes as they happen. Here are some of the most effective types:
Dynamic Dashboards: These are among the most common tools in business intelligence data visualization. Dynamic dashboards offer a real-time view of business metrics and performance indicators. They are highly customizable and can include a variety of widget-like components such as gauges, charts, and graphs that update continuously as new data arrives. Dashboard visualization is crucial for roles that require constant monitoring of systems, such as network operations centers or live digital marketing campaigns.
Interactive Charts: Unlike static charts, interactive charts allow users to manipulate the view of the data to better understand different aspects of the information presented. This might include zooming in on a specific time frame, or drilling down into the data to view more detailed subcategories. Interactive charts are particularly valuable in financial services for tracking market movements in real time.
Geospatial Maps: For industries like logistics or regional sales, geospatial maps provide real-time tracking of vehicles, goods, or sales performance across different regions. These visualizations are useful for optimizing routes in real time or responding to sales trends as they develop.
Heat Maps: Often used in website analytics and retail, heat maps show areas of intensity and can be updated in real time to reflect visitor behavior on a website or customer movements within a store.
Each of these visualization types is supported by no-code data visualization platforms, which allow even non-technical users to create and customize real-time analytics tools without the need for programming skills. This democratization of data tools extends the power of data insights across the organizational hierarchy with a more informed decision-making culture.
Benefits of Data Visualization Software in Real-Time Data Analysis
Immediate Data Comprehension
Data visualization software revolutionizes how businesses interpret vast amounts of information by converting complex data sets into intuitive visual formats. This transformation is crucial in real-time data analysis, where the speed of understanding can directly influence operational success. Visualization software facilitates immediate comprehension in several ways:
Visual Simplicity: Complex numerical data and metrics are simplified through visual means such as graphs, charts, and maps, making them accessible at a glance. This simplicity is crucial during high-pressure situations where time constraints do not allow for detailed analysis of raw data.
Pattern Recognition: Humans are naturally visual creatures, and visualization aids in quickly identifying trends and anomalies. For instance, a sudden dip in a line graph can indicate performance issues that need immediate attention, while a spike might highlight unexpected successes or opportunities.
Contextual Awareness: Good visualization provides context, essential for understanding the 'why' and 'how' behind data points. Dashboard visualization, a common feature in business intelligence data visualization platforms, integrates data from multiple sources into a single interface, offering a holistic view of operations.
These capabilities, especially when enhanced by no-code data visualization platforms, enable not just data scientists but also non-technical business users to access, understand, and react to data promptly.
Enhanced Decision-Making
Real-time data visualization not only accelerates the comprehension of data but also enriches the decision-making process. Enhanced decision-making is observed in various scenarios, such as operational adjustments, strategic pivots, and crisis management, among others. Below are some examples where real-time data visualization has directly improved business decisions:
Operational Efficiency: In manufacturing, real-time dashboard visualizations monitor assembly line performance, allowing managers to identify bottlenecks or malfunctions immediately. This quick identification and resolution of issues prevent prolonged downtime and optimize production flow.
Customer Interactions: Retail businesses use heat maps to track customer movements within stores. This real-time data helps adjust staffing and merchandising decisions on the fly, enhancing the customer experience and increasing sales.
Financial Trading: In financial markets, traders use interactive charts to monitor live data streams of market conditions. The ability to visualize and analyze trends in real-time enables traders to make quicker, more informed trading decisions, potentially leading to significant financial gains.
Emergency Response: Visualization tools aid emergency response teams by providing real-time geographic data visualization of incidents and resource deployment, improving response times and resource allocation.
These examples demonstrate how real-time data visualization can transform decision-making processes, providing businesses with the agility to respond effectively to both opportunities and threats as they arise.
Key Features of Effective Visualization Tools
Real-Time Updating and Responsiveness
The ability of data visualization software to update and respond in real-time is fundamental in today's fast-paced business environments. This feature ensures that the data displayed is not only current but also reflective of the very latest changes and inputs. The technical underpinnings that enable these capabilities include:
Streaming Data Integration: Effective visualization tools are equipped with capabilities to handle streaming data. This allows the software to continuously receive and process data as it comes in, which is crucial for industries like finance and telecommunications where conditions change second by second.
Performance Optimization: To manage large volumes of data updating in real-time, visualization software must be optimized for high performance. This involves advanced data caching, efficient data indexing, and the use of just-in-time data loading techniques to ensure that the visualization remains fluid and responsive without overwhelming system resources.
Responsive Design: Visualization tools must display data correctly across different devices and platforms. This adaptability ensures that decision-makers can access insights on the go, using any device, without delays or distortions in data presentation.
These features collectively ensure that business intelligence data visualization remains a reliable cornerstone for decisions that depend on the latest information.
Interactivity and User Control
Interactivity in data visualization software allows users to engage with data more deeply by manipulating what they see to uncover different layers of analysis. Key aspects of interactivity and user control include:
Drill-Down Capabilities: Users can click on visual elements to explore underlying data. For instance, clicking on a segment of a sales performance dashboard might reveal individual transaction details, allowing analysts to investigate anomalies or trends more thoroughly.
Dynamic Filtering: This feature enables users to change the parameters of the data they are viewing. For example, a user could adjust a dashboard visualization to display data for a specific time period, region, or product category, enabling tailored analysis without needing to exit the interface.
Customization Options: Effective tools offer extensive customization options, from changing visual types (e.g., from bar charts to scatter plots) to altering how data is grouped or summarized. No-code data visualization platforms particularly excel in this area, providing powerful customization without requiring users to write any code.
These interactive features empower users to explore data from multiple angles and derive insights that are most relevant to their specific needs or questions.
Integration Capabilities
The ability to integrate seamlessly with existing data systems and workflows is crucial for any data visualization tool, ensuring that it acts as a natural extension of the business’s analytical capabilities rather than as a standalone element. Integration capabilities include:
Compatibility with Multiple Data Sources: Effective visualization tools can pull data from various sources, such as databases, cloud storage, and third-party applications. This is crucial for businesses that store data across different platforms.
APIs and Embedding Features: Many advanced visualization platforms provide APIs that allow developers to integrate visualization features directly into existing systems or workflows. Similarly, embedding features let organizations place interactive visual dashboards within internal or customer-facing applications.
Collaboration Features: Integration isn’t just about data; it’s also about people. Tools that support real-time collaboration enable teams to work together on data analysis tasks, share insights quickly, and make decisions more efficiently.
Conclusion
In an era where data is continually generated and decisions need to be made at unprecedented speeds, visualization software has proven indispensable. By transforming complex data sets into clear, intuitive visual representations, such tools not only streamline the process of data interpretation but also significantly enhance the ability of organizations to respond to real-time challenges and opportunities. The use of data visualization software in real-time analytics allows businesses to not just keep pace with their data, but to lead with it, driving better decisions, faster actions, and ultimately, greater success.
If you're looking to empower your business with these capabilities, consider exploring the solutions offered by Grow. With Grow's advanced data visualization tools, you can gain the clarity and insight needed to navigate your business through the complexities of today's data-driven landscape.
Start with Grow’s 14-day free trial to experience firsthand how effective and user-friendly these tools can be. Also, to make an informed decision, look up “Grow Cost & Reviews on Capterra” to see what other users are saying about their experiences.
0 notes
Text
How Marketing Dashboards Can Help With Market Trends & Consumer Preferences
Are you struggling to keep up with the rapid shifts in consumer behavior and market trends? Do you find it challenging to determine which marketing strategies are truly driving your business forward? In a world where data is king, staying ahead requires more than just guesswork—it demands a deep, data-driven understanding of your market and customers.
Marketing dashboards are your ultimate tool for navigating the complex marketplace with precision and insight. These dashboards, a crucial component of modern BI dashboard software, offer a real-time snapshot of your marketing's effectiveness, presenting complex data in an easily digestible format. But what makes them truly indispensable in today's digital landscape?

Using advanced Business Intelligence dashboard software, these dashboards not only help you track key performance indicators but also enable you to slice through the noise to focus on what matters most. How are your current campaigns performing across different platforms? Are your marketing efforts aligning with consumer expectations?
With robust Business Analytics dashboard capabilities, you can gain an unparalleled view into consumer preferences and emerging market trends. This isn't just about seeing the numbers; it's about understanding the story they tell and reacting swiftly and strategically.
Are you ready to transform your approach to marketing with tools that enable not just visualization but also foresight and adaptability? Let’s explore how marketing dashboards can change the game for your business, helping you to not only meet but anticipate the needs and desires of your customers.
What are Marketing Dashboards?
A marketing dashboard is an interactive tool that visually tracks, analyzes, and displays key marketing metrics, KPIs, and other data points related to marketing performance. By consolidating data from various sources—like social media, CRM systems, and email marketing campaigns—into a cohesive dashboard, businesses can assess their performance against their marketing goals swiftly and effectively.
The Role of Marketing Dashboards in Identifying Market Trends
Real-Time Data Analysis
Real-time data visualization is a key feature of sophisticated Business Intelligence dashboard software, allowing companies to monitor market dynamics as they unfold. This immediate insight is crucial for identifying and capitalizing on emerging trends before they become widely recognized.
For instance, a marketing dashboard can display live data streams from social media and website interactions, providing marketing professionals with instant feedback on campaign performance and consumer engagement levels. This capability enables marketers to tweak campaigns in real-time, enhancing their effectiveness and relevance to the target audience.
A practical example is the use of real-time dashboards in e-commerce during high-traffic events like Black Friday. By monitoring live data, retailers can see which products are trending, adjust promotions instantaneously, and manage inventory more efficiently, thus maximizing sales opportunities.

Comparative Analysis
Comparative analysis involves juxtaposing historical data against current metrics to discern patterns and shifts in consumer behavior. Marketing dashboards excel in this area by aggregating data over various periods, presenting a clear view of performance trends over time. Business Intelligence dashboard software can display year-over-year growth, compare seasonal sales, and benchmark current campaign performance against past efforts.
For example, a company might use its business analytics dashboard to compare the success of two different marketing campaigns for the same product launched at different times of the year. Insights gleaned from such comparisons could reveal that campaigns launched in the summer yielded higher engagement rates compared to those in winter, prompting a strategic realignment to capitalize on peak interest seasons.
Predictive Analytics
Predictive analytics in marketing dashboards uses machine learning models to analyze existing data and predict future market trends. This proactive approach allows businesses to anticipate market developments and align their strategies accordingly, rather than merely reacting to past events. Business Intelligence dashboard software can analyze patterns from historical data and consumer interactions to forecast future behaviors with a reasonable degree of accuracy.
A compelling application of predictive analytics can be seen in the retail sector, where marketing dashboards analyze customer purchase history and online behavior to predict upcoming purchasing trends. This might involve anticipating an increase in demand for certain products and adjusting marketing strategies to focus on those items before the demand actually arises.
Enhancing Understanding of Consumer Preferences through Marketing Dashboards
Segmentation and Targeting
Segmentation and targeting are fundamental in crafting effective marketing strategies, and marketing dashboards provide the necessary tools to achieve this with precision. By integrating data from various sources—such as social media analytics, online shopping behaviors, and demographic information—BI dashboard software allows marketers to create detailed consumer profiles.
For instance, a business intelligence dashboard can segment consumers based on age, location, purchasing habits, and even engagement levels with previous marketing campaigns. This segmentation enables marketers to identify which demographic groups are most likely to respond to specific marketing initiatives.
A dashboard might reveal that millennials in urban areas show a high engagement rate with digital ads for tech gadgets, guiding a tech company to target similar products specifically to this group.
Personalization Opportunities
Personalization is a key driver of marketing success in the digital age, and insights from marketing dashboards are invaluable in this regard. Business analytics dashboards can analyze consumer behavior patterns to tailor marketing messages, offers, and product recommendations. This level of personalization not only improves customer satisfaction but also enhances the effectiveness of marketing campaigns.
Using BI dashboard software, marketers can craft personalized email marketing campaigns that address consumers by name, reference their past purchases, and suggest similar products they might enjoy. This approach not only increases the likelihood of repeat purchases but also fosters a deeper connection between the brand and the consumer, as customers feel recognized and valued on an individual level.
Feedback Loops
Feedback loops are essential for continual improvement in product offerings and marketing strategies. Marketing dashboards facilitate this by incorporating consumer feedback directly into the data visualization tools, enabling companies to quickly adapt to consumer needs and preferences.
A practical example of this is in product development. Suppose a dashboard shows a consistent decline in sales for a particular product line while customer feedback collected via surveys and social media points to specific dissatisfaction with certain features. The company can use this information to make informed decisions about product improvements or to develop new products that align better with consumer expectations.
Moreover, feedback loops can also refine marketing strategies. If dashboard data indicates that a particular marketing channel is underperforming, and customer feedback suggests a lack of engagement with the content delivered through that channel, marketers can adjust their strategies accordingly—perhaps by changing the messaging, the medium, or even the timing of ads.
Conclusion
By integrating sophisticated BI dashboard software and comprehensive data analytics, marketing dashboards provide a clearer, more accurate view of the market. They enable businesses to swiftly identify emerging trends, understand complex consumer behaviors, and refine marketing strategies with precision—ensuring that every decision is data-driven and every strategy is optimized for success.
For those looking to leverage the full potential of marketing dashboards, Grow offers an intuitive solution that can help transform your data into actionable insights. With Grow's data dashboard, businesses can enjoy seamless integration with existing systems, robust data analytics, and user-friendly visualizations that make interpreting complex datasets easy.
Take the first step towards revolutionizing your marketing strategies by signing up for Grow's 14-day free trial. Experience firsthand how Grow can enhance your ability to track, analyze, and respond to market trends and consumer preferences.
Additionally, to see how others have successfully implemented and benefited from Grow, check out the reviews on "Grow data dashboard Trustradius." Here, you'll find comprehensive user feedback and ratings that highlight the effectiveness and versatility of Grow dashboards.
Don't wait to adapt to market changes—anticipate them with a reliable marketing dashboard from Grow. Start your free trial today and begin your journey toward more informed, effective marketing decisions.
0 notes
Text
Trouble Visualizing Data? The Best Dashboard Software Can Change Your Perspective
Have you ever wondered how some companies seem to effortlessly manage their data, spotting opportunities and optimizing operations on the fly? What if you could unlock similar potential in your data, discovering insights that could transform your business’s cash flow and decision-making?
Imagine, in just 60 days, significantly cutting down on unpaid invoices, just like Altaworx did, ultimately freeing up $40,000 in cash flow that was previously untapped.
“Even if that were the only metric I had for our experience with Grow, I’d use it just for that,” states Forrest Derr, Director of Finance and Automation at Altaworx.
In this era where data drives decisions, the right tools can make all the difference. Altaworx uses Grow BI dashboards not just to monitor data but to revolutionize how they manage their business.
From swiftly updating dashboard metrics without the need for extensive coding to improving visibility across their accounts receivable, the impact of effective dashboard software like Grow is profound and multifaceted.
They’ve optimized their revenue funnel, redirected their marketing strategies, and ensured that every team member from the break room to the boardroom is aligned and informed.
Are you ready to explore how the best dashboard software can change your perspective on data visualization and business management? Let’s dive into how tools like Grow can transform data from a static metric into a dynamic tool for growth and strategic advantage.
Understanding Data Visualization Challenges
1. The Complexity of Modern Data
As businesses evolve, they generate vast amounts of data at unprecedented speeds and in various formats. The sheer volume of data (big data) can overwhelm traditional systems, while the velocity demands rapid processing and analysis. Variety adds another layer of complexity with data coming in structured, semi-structured, and unstructured forms. This triad challenges even the best dashboard software, pushing the limits of conventional data visualization tools.
Conventional tools often lack the scalability and agility to manage this complex data efficiently. They struggle with large datasets, resulting in slow load times and frequent system crashes, which impede the visualization process. As the data grows in volume and complexity, these tools often require manual intervention to handle diverse data types, leading to delayed insights. In contrast, the best Business Intelligence dashboards are designed to handle this complexity by leveraging advanced data integration, processing, and visualization technologies.
2. Integration Issues
In today’s interconnected world, businesses use various applications and systems, each generating data in different formats. Integrating this data into a unified view is crucial for comprehensive analysis yet poses a significant challenge. Traditional tools often lack the capability to connect seamlessly with multiple data sources, forcing companies to invest in additional middleware or custom solutions, which can be costly and inefficient.
When data remains siloed or improperly integrated, the resulting insights are fragmented and possibly inaccurate. This disjointed data can lead businesses to make decisions based on incomplete or outdated information, significantly impacting operational efficiency and strategic planning. The best data dashboard software excels in integrating data from multiple sources, providing a holistic view that ensures the accuracy and timeliness of insights.
3. Limitations of Conventional Tools
With the increasing need for on-the-go decision-making, mobile accessibility has become crucial. Traditional visualization tools often fail to provide real-time updates or seamless mobile experiences. This limitation hinders the ability of decision-makers to access vital business insights from anywhere, at any time.
Features of Advanced Dashboard Software
Real-Time Data Processing
Advanced dashboard software harnesses the power of real-time data processing, enabling businesses to monitor operations as they happen. This capability is crucial in environments where conditions change rapidly, such as financial trading floors or supply chain operations. By processing data the moment it is received, the best dashboard software ensures that the visualizations are always current, reflecting the latest available information.

The immediate advantage of real-time data visualization is the ability to react swiftly to emerging trends or issues before they escalate. For instance, in manufacturing, real-time data can signal a production fault that, if addressed promptly, could prevent costly downtime. Additionally, marketing teams can monitor campaign performance live and tweak strategies to maximize effectiveness. Such timely insights can be pivotal in maintaining a competitive edge.
Integration Capabilities
One of the key strengths of the best Business Intelligence dashboards is their robust integration capabilities. These tools are designed to seamlessly aggregate data from diverse sources—be it CRM systems, ERP software, or social media analytics—into a coherent dashboard. This integration is facilitated through APIs and connectors that are built to handle various data formats and sources without requiring extensive manual input.
Leading BI dashboard tools like Tableau and Grow offer extensive integration options. These platforms come equipped with pre-built connectors that link directly to popular data sources, enabling businesses to start visualizing their data almost immediately.
User-Centric Design and Customizability
The effectiveness of a BI dashboard tool hinges significantly on its usability. Advanced dashboard software is designed with a user-centric approach, ensuring that the interface is intuitive enough for users at all levels of technical expertise. This accessibility is crucial for building a data-driven culture within an organization, as it empowers more employees to derive insights independently, without constant IT support.
The best data dashboard software offers extensive customization options, allowing businesses to tailor their dashboards to meet specific operational needs and user preferences. Users can modify layouts, choose from various visualization tools, and even set up personalized alerts. Such customizability not only enhances the user experience but also ensures that the insights generated are relevant and actionable.
Mobile Accessibility and Cloud-Based Solutions
Decision-makers often need to access data and insights while away from their desks. Mobile accessibility has become a critical feature of the best dashboard software, enabling users to view and interact with their dashboards through smartphones and tablets. This flexibility allows for immediate decision-making, anytime and anywhere, which is essential for maintaining operational continuity and responsiveness.
Cloud-based BI dashboard tools offer significant advantages, especially in a remote work context. These solutions allow users to access data and tools online without the need for local installations, facilitating collaboration among dispersed teams.
Moreover, cloud solutions ensure that all data is centrally stored and updated in real-time, reducing the risk of discrepancies and ensuring consistency across all user interactions.
The Business Impact of Effective Dashboard Software
Enhanced Decision-Making
Effective visualization provided by the best dashboard software translates complex data into comprehensible visuals, facilitating quicker and more informed decision-making. These tools enable users to identify trends, anomalies, and patterns that might be overlooked in raw data. By presenting data in a visual context, dashboards help decision-makers synthesize information rapidly and make well-informed choices with greater confidence.
Let’s look at this example.
The introduction of Grow as a comprehensive dashboard tool helped Patrick and Edit Suits Co. consolidate various data sources into a single platform. The executive dashboard, nicknamed "the Force," enabled the management team to monitor the main KPIs for each department in one place, significantly enhancing the decision-making process by providing a unified and instant overview of critical business metrics.
Improved Collaboration
Shareable dashboards, a key feature of the best Business Intelligence dashboards, facilitate seamless collaboration across teams by providing a unified data view accessible to all relevant stakeholders. This shared access eliminates information silos, aligns team objectives, and encourages a collaborative approach to problem-solving and project management.

For example-
A manufacturer of industrial equipment used dashboard software to link production line data with supply chain management. The shared dashboard allowed for real-time adjustments in production based on supply chain updates, enhancing responsiveness and efficiency.
Increased ROI
Investing in the best data dashboard software typically yields a high return on investment by streamlining processes, reducing errors, and uncovering revenue-enhancing opportunities. These tools minimize the time spent on data collection and analysis, thus freeing up resources for strategic tasks that directly contribute to business growth.
Cost-Benefit Analysis of Investing in High-Quality Dashboard Software:
Costs Involved: Initial setup, licensing fees, training, and maintenance.
Benefits Gained: Increased operational efficiency, reduced downtime, improved decision-making speed and accuracy, and enhanced customer satisfaction.
"Grow has allowed us to be far more proactive," states Tim Langford, VP of Operations at Comapi, noting that easy visibility of customer revenue figures and the ability to take action immediately helps maintain and increase financial performance.
Conclusion
The ability to quickly interpret and act on information is important for any business seeking to maintain a competitive edge. The challenges associated with data visualization are real, from integrating multiple data sources to ensuring real-time data processing and mobile accessibility.
The best dashboard software, such as Grow, addresses these challenges head-on, providing businesses with the tools they need to transform raw data into actionable insights effortlessly.
Grow's dashboard software stands out by offering seamless integrations, real-time data updates, and user-friendly interfaces that cater to all levels of technical expertise. Whether you're looking to enhance decision-making, improve collaboration across teams, or increase your return on investment, Grow provides a comprehensive solution that meets the complex demands of modern businesses.
If you're ready to change your perspective on data visualization and see how advanced dashboard tools can streamline your operations, we invite you to try Grow for yourself.
Sign up for a 14-day free demo at Grow.com and experience the difference firsthand. For unbiased reviews and business experiences, visit "Grow with Grow.com TrustRadius" to see how other businesses like yours have transformed their data practices.
Unlock the full potential of your data—start growing with Grow today!
0 notes
Text
Why Your Business Analytics Tool Isn’t as Smart as You Think
Are you confident that your Business Intelligence tool is as smart as it claims to be?
How often do you encounter discrepancies between the insights generated by your BI reporting tools and the actual outcomes? In the fast-evolving world of data analysis, having a Business Analytics tool that genuinely meets your needs is more crucial than ever. While hopes are high, reality often falls short.
While 97% of organizations are investing in big data and AI, only 29% of those surveyed believe they have derived actionable insights from their data. This gap is a critical disconnect between the capabilities of Business Analytics solutions and their practical applications.
As we dive deeper, we'll explore the complexities and limitations of current Business Analytics tools. From overestimated automation capabilities to the nuances of data quality and context, we will uncover why these tools might not be as intelligent or as universally applicable as you might think.
Join us as we dissect the myths and realities of Business Intelligence tools, setting the stage for a more informed approach to leveraging these technologies in your business.
Key Limitations of Current Business Analytics Tools
Data Quality and Integrity
One of the most significant challenges faced by Business Intelligence tools is the quality of the data they process. BI reporting tools are only as good as the data fed into them. Poor data quality—be it incomplete data sets, incorrect entries, or outdated information—can lead to inaccurate outputs and misguided business decisions.
For instance, a common issue in BI implementations is the failure to maintain clean and updated data repositories. When Business Analytics tools process this compromised data, the insights generated can lead to flawed strategic decisions. This was the case for a retail chain that relied on outdated customer data, resulting in a marketing campaign that targeted the wrong demographic, wasting substantial resources and opportunities.
Lack of Contextual Understanding
While Business Analytics tools excel at processing large volumes of data, they often lack the ability to understand the context behind the data. This limitation is critical because data without context can mislead rather than guide.
For example, during an economic downturn, a sudden drop in sales might be interpreted by a Business Intelligence tool as a performance issue rather than a market-wide trend. Without the ability to contextualize data, companies might wrongly penalize certain departments or make poor strategic decisions. This lack of contextual understanding emphasizes the need for human oversight in interpreting what the analytics tools report.
Over-Reliance on Automation
Automation in Business Analytics solutions is intended to streamline processes, reduce labor costs, and improve efficiency. However, an over-reliance on automation can lead to significant issues, particularly when unexpected anomalies or new trends occur in the data.
A relevant case involved an automated BI system that failed to flag a gradual but significant decline in product quality, which was reflected in customer feedback and return rates. The system was programmed to monitor sales volumes and revenue but not customer satisfaction metrics directly. This oversight led to a continued decline in brand reputation and customer loyalty, which took months to identify and address.
The Misconception of 'One-Size-Fits-All' Business Analytics Solutions
Businesses frequently deploy the same BI reporting tools across various departments without considering the unique analytical needs and data processing requirements of each. For instance, the marketing department and the finance department have vastly different data analytics needs. Marketing might require deep insights into consumer behavior and campaign performance, involving lots of unstructured data and sentiment analysis, which are less critical for finance, which focuses on cost, revenue, and economic forecasts.
Using a uniform Business Analytics tool across these departments can lead to scenarios where the tool does not fully support the sophisticated data visualization required by marketing or the regulatory compliance needed by finance. This can result in suboptimal data insights and potentially misguide strategic decisions.
For example, a Business Analytics solution that excels in financial forecasting may not necessarily be the best tool for analyzing customer behavior or managing supply chain logistics. When organizations adopt a one-size-fits-all approach, they often miss out on features that are more suited to specific types of data analysis, leading to suboptimal outcomes.
Commonly Misunderstood and Misapplied Advanced Features
Feature Complexity and Interface Challenges
Advanced features like machine learning models or complex data integrations in Business Intelligence tools can intimidate users due to their perceived complexity. For example, the use of R or Python scripts within BI reporting tools to run predictive models requires a level of programming knowledge that not all business analysts possess.
Solution: Implement user-friendly interfaces that provide guided analytics and simplified access to complex functionalities. For instance, BI tools could incorporate natural language processing (NLP) to allow users to make complex queries without needing to write code. Additionally, providing access to pre-built models and wizards that guide the user through the analytics process can help demystify these features.
Technical Breakdown of Misunderstood Features
Predictive Analytics
Technical Barrier: The integration of predictive analytics often requires a deep understanding of statistical modeling and data science principles, which goes beyond traditional BI competencies.
Solution: Develop a suite of template-driven analytics models tailored for specific industries and departments. For instance, create retail-specific models that automatically adjust for seasonal trends and promotional impacts, or finance-specific models that are attuned to economic cycles.
Data Mining
Technical Barrier: Effective data mining requires not just an analysis across broad data sets but also the ability to clean and preprocess data effectively, which involves handling missing values, outlier detection, and ensuring data normalization.
Solution: Enhance BI reporting tools with automated data preprocessing modules that can detect and correct common data issues before the mining process begins. Integrate visual data mining tools that allow users to easily segment data and visualize patterns without requiring extensive statistical knowledge.
Real-Time Data Processing
Technical Barrier: Real-time data processing demands robust infrastructure and the capability to integrate streaming data effectively with batch-processing data systems.
Solution: Leverage cloud-based BI solutions that offer scalability to handle large streams of real-time data. Implement hybrid transactional/analytical processing (HTAP) capabilities to enable real-time analytics on transactional databases without the need for additional data movement.
Conclusion
As we have explored throughout this discussion, the perceived intelligence of your Business Analytics tool might not fully align with reality. From the challenges of maintaining data quality to the pitfalls of over-reliance on automation, it's clear that while these tools are powerful, they are not infallible. They require a keen understanding of their capabilities, careful integration into business processes, and ongoing management to truly deliver on their promises.
The key takeaway is not to dismiss your current analytics solutions but to enhance how you use them. It’s about recognizing their limitations and proactively filling the gaps—be it through better data practices, enhanced training, or more tailored solutions. This approach will not only improve your current analytics outcomes but also pave the way for more sophisticated use of these technologies.
For those looking to explore new analytics solutions or enhance their current tools, consider experimenting with advanced platforms that offer more customization and integration flexibility. For instance, Grow provides a dynamic Business Intelligence tool tailored to meet specific business needs, allowing for more precise and actionable insights.
With Grow, you can take advantage of a 14-day free trial to see how its capabilities align with your business goals. Check out Grow.com Reviews & Ratings 2024 on TrustRadius for unbiased user feedback and see how Grow stands out in the marketplace.
Remember, the goal of business analytics is not just to collect data but to drive meaningful business decisions. As you move forward, take a moment to reassess your tools, refine your strategies, and ensure that your business intelligence is as smart as you need it to be. Explore, experiment, and expand your analytics capabilities with Grow, and take your data-driven decision-making to the next level.
0 notes
Text
What Are the Game-Changing BI Trends That Will Shape the Next Decade?
Are you curious about the future of Business Intelligence?
Which BI trends will transform how we work, and how are leading Business Intelligence software vendors preparing for these changes? If you're interested in how these trends might impact your business, you're in the right place.
Take the example of 2 Brothers Moving & Delivery, a data-driven company that found traditional data tools too complex for their dynamic needs. By partnering with Grow, a notable BI software vendor, they managed to simplify their data processes and make crucial information accessible and engaging for their team. And what is Business Intelligence if not making data easier to manage. Grow BI dashboards helped motivate their staff by making performance metrics clear and actionable.
According to the BARC Data, BI, and Analytics Trend Monitor 2024, the top five BI trends include enhancing data security, improving data quality, cultivating a data-driven culture, strengthening data governance, and increasing data literacy. These trends are reshaping industries worldwide, proving that sophisticated, user-friendly Business Intelligence technologies are becoming essential in today’s data-centric business environment.
So, what are the game-changing Business Intelligence trends that will shape the next decade?
Let’s move right in!
Game-Changing BI Trends That Will Shape the Next Decade
Trend #1: The Rise of Artificial Intelligence and Machine Learning in BI
AI and ML are increasingly becoming integral to Business Intelligence technologies, enhancing the capabilities of BI software in profound ways. Initially, BI tools primarily focused on descriptive analytics, providing insights into past and current business operations.
However, the introduction of AI and ML in Business Intelligence trends has expanded these capabilities to include predictive and prescriptive analytics, enabling businesses to forecast future trends and effectively plan their strategies.
Modern Business Intelligence software vendors leverage AI algorithms to automate complex data analysis processes, allowing them to handle large volumes of data with speed and accuracy that human analysts cannot match. For instance, Machine Learning models can identify patterns and anomalies in data that might indicate critical business events, such as potential sales declines or operational disruptions.
Key Developments:
Automated Machine Learning (AutoML): This technology democratizes ML by enabling non-experts to create predictive models without needing extensive programming knowledge, which is a significant advancement touted by leading Business Intelligence software vendors.
Natural Language Processing (NLP): Integrated into BI systems, NLP allows users to interact with their data in conversational language, making data analytics more accessible to a broader range of business users.
Predictions on AI Advancements in BI for the Next Decade
Looking ahead, the next decade promises even greater integration of AI and ML in Business Intelligence technologies, driven by several emerging trends:
Explainable AI (XAI): As businesses demand more transparency from AI systems, XAI will become crucial in BI. This advancement aims to make AI decisions more understandable to humans, which is essential for maintaining trust and ensuring compliance with regulatory standards.
Augmented Analytics: This area will continue to evolve, using AI to automate data insights generation and expanding the accessibility of analytics to non-technical users, thus promoting a data-driven culture throughout organizations.
Edge AI: With the rise of IoT devices and mobile computing, AI capabilities are being pushed to the edge of the network where data is generated. For BI, this means faster insights with less reliance on central processing, crucial for industries requiring real-time decision-making like manufacturing and logistics.
Federated Learning: As privacy concerns mount, federated learning offers a way to train AI models on decentralized data, helping businesses comply with data privacy laws while still benefiting from shared machine learning insights.
Trend #2: Increased Emphasis on Data Quality Management
Data quality management in BI refers to the processes involved in ensuring the data is accurate, complete, timely, and consistent across all systems. Quality data must be reliable and should accurately represent the real-world constructs it is supposed to depict. The significance of data quality management in BI has risen sharply with the realization that poor data quality can lead to erroneous conclusions, ineffective business strategies, and potential financial loss.
Predictions for Data Quality Management in BI
Increased Automation: More tasks related to data quality will be automated using AI and machine learning, making these processes faster and more accurate.
Tighter Integration with BI Tools: Data quality tools will be more seamlessly integrated into BI platforms, allowing for real-time cleaning and updating of data within BI workflows.
Stronger Data Governance: As data privacy regulations tighten, organizations will adopt robust data governance frameworks to manage data access, quality, and compliance effectively.
Data Quality as a Service (DQaaS): Cloud-based data quality services will become popular, offering affordable and scalable solutions for managing data quality without heavy IT investments.
Focus on Ethical AI: There will be a greater emphasis by Business Intelligence software vendors and BI users on ensuring the data used in AI systems is accurate and unbiased to prevent ethical issues in automated decision-making.
Proactive Data Quality Measures: Predictive analytics will be used to foresee and address potential data quality issues before they impact BI systems.
Cross-Organizational Strategies: Companies will collaborate more on data quality initiatives, especially in sectors like supply chains and healthcare, where data sharing is crucial.
Advanced Visualization Tools: New visualization tools will help businesses monitor and understand data quality more effectively through intuitive and interactive BI dashboards.
Trend #3: The Integration of BI and Blockchain Technology
Blockchain technology operates as a decentralized digital ledger that records transactions across many computers in such a manner that the registered transactions cannot be altered retroactively. This inherent design of blockchain offers two key features for Business Intelligence:
Security: Due to its cryptographic hashing and decentralization, blockchain significantly reduces the risks of data tampering and cyber-attacks.
Transparency: Every transaction on a blockchain is visible to all participants and requires consensus before it is recorded, creating an environment of trust and accountability.
Predictions for the Future:
Widespread Adoption Across Industries: Industries that rely heavily on the credibility and authenticity of data, such as pharmaceuticals, healthcare, and finance, are likely to pioneer the integration of blockchain in their BI systems.
Enhancement of AI and ML Models: Blockchain could provide a reliable data foundation for AI and ML models, enhancing their accuracy and dependability.
Regulatory Compliance and Governance: With its ability to maintain secure and transparent records, blockchain will become a key tool in addressing the growing regulatory demands for data privacy and management.
Trend #4: The Expansion of Self-Service BI Tools
Self-service BI tools facilitate the democratization of data by enabling users across various roles within an organization to access, analyze, and utilize data independently. This shift is a critical aspect of modern Business Intelligence trends, moving away from a centralized model where only IT professionals or data analysts handle data queries and reports.
Key Features Supporting Democratization:
User-Friendly Interfaces: Modern Business Intelligence technologies offer intuitive drag-and-drop interfaces and interactive dashboards that non-technical users can easily navigate.
Access Controls: These tools provide robust access management features, ensuring data security while allowing diverse user groups to access the data they need.
Predictions for Self-Service BI Tools
Wider Adoption: More industries, including small businesses and non-profits, will start using self-service BI tools due to their ease of use.
Smarter Tools: AI and machine learning will be integrated more deeply, making these tools even more user-friendly and capable of performing complex analyses automatically.
Better Data Management: There will be enhanced features for data governance and quality control to help ensure data accuracy and security.
Customizable Features: Users will be able to customize and personalize their BI tools more extensively, tailoring them to meet specific needs.
Enhanced Collaboration: Self-service Business Intelligence technologies will include better features for teamwork, allowing users to share insights and collaborate in real-time, even from remote locations.
Mobile Enhancements: These tools will become fully functional on mobile devices, supporting decision-making anytime, anywhere.
Focus on Education: There will be a greater emphasis on educating users in data literacy to ensure they can fully leverage BI capabilities.
Industry-Specific Tools: More tailored BI solutions will be available for specific industries, making it easier to address unique challenges.
Trend #5: Predictive and Prescriptive Analytics Becoming Mainstream in Business Intelligence
Predictive Analytics primarily focuses on forecasting future events based on historical data. It uses statistical models and machine learning techniques to identify trends, patterns, and potential outcomes. This form of analytics is crucial for scenarios where understanding the likelihood of future occurrences is key, such as demand forecasting in retail or risk assessment in finance.
Prescriptive Analytics goes a step further by not only predicting outcomes but also suggesting courses of action and showing the potential effects of each decision. It combines the insights from predictive analytics with optimization and simulation algorithms to advise on possible outcomes. For example, in supply chain management, prescriptive analytics can suggest the best distribution routes based on anticipated weather conditions, traffic, and cost implications.
Also read, What are the various types of Data Analysis?
Predictions for Predictive and Prescriptive Analytics in BI
Widespread Use Across Industries: These analytics will be standard in all sectors, not just data-heavy ones like finance or retail.
Real-Time Analytics: Technologies will evolve to offer instant insights, enabling businesses to make quicker decisions based on current data.
Integration with IoT Devices: Predictive analytics will be used more with IoT devices to anticipate maintenance needs and optimize operations.
User-Friendly Tools: Analytics tools will become easier to use, allowing non-experts to perform advanced data analysis.
Advanced Machine Learning Models: Machine learning models will improve, becoming capable of learning from smaller data sets and providing more precise predictions.
Focus on Ethical AI: There will be a greater emphasis on ensuring that AI decisions are transparent and adhere to ethical standards.
Growth of Cloud Analytics: More businesses will access predictive and prescriptive analytics through cloud services, making these tools more accessible.
Cross-Functional Teams: Companies will form teams that combine IT, data science, and business operations to maximize the use of analytics.
Industry-Specific Solutions: Custom analytics solutions will be developed to meet the unique needs of different industries.
Trend #6: Ethical AI and Responsible Data Use in Business Intelligence
Ethical AI involves developing and using AI technologies in a manner that is morally sound and respects user rights. In the context of Business Intelligence, ethical AI deployment ensures that decisions made by AI systems are fair, transparent, and accountable. This is crucial as AI systems increasingly handle more decision-making processes in business environments, influencing everything from customer relations to internal operations.
Predictions for Ethical AI and Responsible Data Use in BI
Stricter Regulations: Expect tougher global laws on data privacy and AI ethics, impacting how businesses use AI.
Focus on Transparency: Companies will need to be more transparent about how their AI systems work and the data they use.
Privacy Technologies: Privacy-preserving technologies like federated learning will become more popular, helping businesses use data without compromising individual privacy.
Ethical AI Roles: New professional roles, such as Ethical AI Officers, will emerge to oversee AI ethics within companies.
Ethics as Advantage: Businesses with strong ethical AI practices will gain a competitive edge, attracting more customers.
Ethics Education: Training on AI ethics will become essential in organizations, preparing professionals to integrate ethics into their work.
Ethical Frameworks: Companies will develop detailed ethical guidelines for AI, ensuring systems are fair and accountable.
Government Involvement: Expect increased government action in promoting ethical AI through funding and policy-making.
Conclusion
Embracing these game-changing Business Intelligence trends will not only ensure that your organization stays ahead of the curve but also maximizes efficiency, innovation, and competitive advantage in an increasingly data-driven world.
To stay on the leading edge of these developments, consider adopting sophisticated BI tools like Grow. Grow’s platform offers a seamless experience that aligns with the latest Business Intelligence trends, providing tools and features that cater to the evolving needs of modern businesses. Whether you're looking to enhance data quality management, integrate AI into your analytics, or ensure ethical data use, Grow provides a robust solution tailored to your needs.
Don't just take our word for it—check out "Grow Reviews Cost & Features on GetApp" to see how other businesses are benefiting from their features and services. Ready to see how Grow can help transform your business intelligence strategy? Sign up for a 14-day free trial today a
0 notes
Text
How Data Aggregation Supports Strategic BI Dashboard Development
With the growing complexity in our digital age, where approximately 2.5 quintillion bytes of data are created every single day, the ability to consolidate and make sense of this data has never been more important.

Data aggregation—the process of collecting and summarizing data from various sources into a coherent whole—is at the heart of transforming raw data into actionable insights. But why is this process so critical for businesses striving to develop effective Business Intelligence dashboards?
The Critical Role of Data Aggregation in BI
In the world of Business Intelligence tools, benefits from data aggregation are many. It refers to the process of collecting and summarizing data from various sources to provide a consolidated view. This process is pivotal in transforming raw data into actionable insights, a feature that stands at the heart of every effective Business Intelligence dashboard.
For data aggregation to truly serve its purpose within a business dashboard software, it must start with high-quality, accurate data. The integrity of aggregated data is key; even the most advanced BI dashboard tool is rendered useless if it’s based on flawed or inaccurate data. Thus, rigorous data cleaning and validation are non-negotiable steps in the data aggregation process.
Types of data aggregation: temporal, spatial, and categorical
Temporal Data Aggregation: Time as a Lens for Insight
Definition and Importance: Temporal aggregation involves summarizing data over specific time intervals—such as hours, days, weeks, or years—to identify trends and patterns over time. This type of aggregation is crucial for any Business Intelligence dashboard focusing on historical analysis, forecasting, and trend identification.
Application in BI: By leveraging temporal aggregation, BI tools can provide businesses with insights into sales performance over different periods, customer behavior changes throughout the year, or operational efficiency trends. For instance, a retail company could use a BI dashboard tool to aggregate sales data by week to plan for inventory stocking better.
Benefits: The primary benefit of temporal data aggregation within business dashboard software lies in its ability to highlight trends and seasonality, which are critical for forecasting and strategic planning. This temporal insight enables businesses to allocate resources more efficiently, anticipate market changes, and strategize promotions or product launches with greater precision.
Spatial Data Aggregation: Understanding Geographic Patterns
Definition and Importance: Spatial data aggregation summarizes data based on geographic or spatial variables, such as regions, cities, or GPS coordinates. It’s indispensable for businesses that operate in multiple locations or need to understand geographic influences on their data.
Application in BI: Spatial aggregation in a Business Intelligence dashboard can uncover regional performance trends, market penetration, and customer distribution patterns. For example, a logistics company could use spatial aggregation to analyze delivery times across different cities, optimizing routes and improving service levels.
Benefits: The advantage of using spatial data aggregation in BI dashboard tools is the ability to visualize data geographically, offering a clear view of regional trends and disparities. This insight is crucial for location-based planning, market analysis, and resource allocation, allowing businesses to tailor strategies to specific geographic contexts.
Categorical Data Aggregation: Segmenting for Strategic Insight
Definition and Importance: Categorical aggregation groups data based on categories or segments, such as customer demographics, product types, or sales channels. This form of aggregation is essential for segment-specific analysis and targeted strategy development.
Application in BI: Utilizing categorical aggregation, a BI tool can segment customer data by demographics to tailor marketing strategies or analyze sales by product category to identify high-performing products. This type of aggregation helps in customizing offerings and strategies to meet the specific needs and preferences of different segments.
Benefits: The key benefit of categorical data aggregation in business dashboard software is its ability to provide a segmented view of the market, customers, or products. This detailed insight facilitates more personalized and effective strategies, enhances customer satisfaction, and optimizes product portfolios.
Building Blocks for Effective Data Aggregation
Data Integrity and Accuracy: The Foundation of Insightful Aggregation
Ensuring Clean, Accurate Data: The accuracy of insights derived from a Business Intelligence dashboard hinges on the integrity and cleanliness of the underlying data. Effective data aggregation begins with rigorous data cleaning and validation processes, removing inaccuracies, duplicates, and irrelevant entries to establish a reliable dataset for analysis.
Tools and Techniques: Modern business dashboard software uses advanced data-cleaning tools and algorithms that automatically detect and correct errors.
Techniques such as anomaly detection, pattern recognition, and consistency checks are instrumental in maintaining data quality. Additionally, validation procedures ensure that data adheres to predefined formats and standards, critical for accurate aggregation and analysis.
Scalability and Performance: Catering to Evolving Data Demands
Handling Large Datasets: As organizations grow, so too does the volume and complexity of their data. Scalability in data aggregation ensures that a BI dashboard tool can accommodate large datasets without compromising performance. This is paramount for businesses that rely on real-time data to inform rapid decision-making processes.
Modern Data Processing Frameworks and Cloud Technologies: To achieve efficient data aggregation at scale, leveraging modern data processing frameworks and cloud technologies is essential. These platforms offer the computational power and flexibility needed to process and aggregate large volumes of data quickly, ensuring that business dashboard software remains responsive and efficient.
Flexibility and Customization: Aligning Aggregation with Business Objectives
Tailoring Aggregation to Dashboard Goals: The effectiveness of a Business Intelligence dashboard is significantly enhanced when data aggregation is tailored to meet specific organizational goals and requirements. This involves customizing aggregation parameters and methodologies to reflect the unique needs and objectives of the business.
Dynamic Aggregation for User Queries: Advanced BI dashboard tools offer dynamic aggregation capabilities, allowing for real-time data aggregation based on user queries or specific dashboard focuses. This level of flexibility ensures that users can extract the precise insights they need, when they need them, enhancing the decision-making process.
Security and Compliance: Safeguarding Data Throughout Aggregation
Protecting Sensitive Information: In the process of data aggregation, the security of sensitive information must be a major concern. Encryption, access controls, and secure data storage and transmission methods are essential components of a secure aggregation process, ensuring that data remains protected against unauthorized access or breaches.
Adhering to Data Privacy Laws and Industry Regulations: Compliance with data privacy laws and industry regulations is non-negotiable in data aggregation. BI tools must be designed to comply with regulations such as GDPR, HIPAA, and others, depending on the geographical location and sector of operation. This not only protects the organization from legal repercussions but also builds trust with customers and stakeholders.
Strategic Dashboard Development with Data Aggregation
Aligning Aggregation Strategies with Business Goals
Strategic Alignment: The first step in leveraging a BI dashboard tool effectively is ensuring that data aggregation strategies are in lockstep with the organization's business goals. This alignment means that every piece of aggregated data presented on the dashboard serves a purpose, whether it's driving sales, improving customer satisfaction, or optimizing operations. Business dashboard software excels when it translates vast data sets into focused insights that address specific strategic questions.
Translating Data into Strategy: Aggregating data with an eye toward business objectives involves identifying key performance indicators (KPIs) that directly influence those objectives. By tailoring aggregation processes to these KPIs, businesses ensure that their Business Intelligence dashboard becomes a reflection of their strategic priorities, providing a clear path from data to decision-making.
The Role of Aggregated Data in Predictive Analytics and Forecasting
Predictive Power: Aggregated data is not just about understanding the past; it's a springboard into the future. Within a Business Intelligence dashboard, aggregated data serves as the foundation for predictive analytics and forecasting models. By identifying patterns and trends within the aggregated data, BI tools can forecast future outcomes, providing businesses with a predictive lens through which to view potential scenarios.
Driving Proactive Decision Making: The ability to predict future trends allows businesses to shift from reactive to proactive strategies. Whether it's anticipating market shifts, consumer behavior changes, or supply chain disruptions, the insights garnered from predictive analytics enable organizations to make informed decisions ahead of time, leveraging the Business Intelligence tools benefits to their fullest.
Enhancing User Experience with Aggregated Data: Customization and Interactivity
Customization Is Key: One size does not fit all when it comes to data analysis and presentation. A BI dashboard tool that excels in customization allows users to tailor the dashboard to their specific needs and preferences, ensuring that the aggregated data is relevant and actionable. This level of customization enhances the dashboard’s utility across different departments and roles within the organization.
Interactivity Engages: Beyond customization, interactivity plays a crucial role in enriching the user experience. Interactive BI dashboard tools empower users to explore data, drill down into specifics, and manipulate variables to see different scenarios. This hands-on approach not only makes the data more accessible but also encourages deeper engagement and understanding, further amplifying the Business Intelligence tools benefits.
Conclusion
As we conclude, it's clear that the Business Intelligence tools benefits, especially when powered by effective data aggregation, are vast and varied. Whether it's driving sales, improving customer satisfaction, or optimizing operations, a well-developed BI dashboard is an indispensable tool for any organization striving to harness the power of data for strategic advantage.
For those looking to explore the transformative potential of BI dashboards further, Grow offers a robust BI dashboard tool designed to cater to your business's unique needs.
With Grow's 14-day free trial, you have the opportunity to experience firsthand the power of strategic dashboard development with advanced data aggregation capabilities.
Dive into Grow Features & Capabilities GetApp and discover how you can leverage Grow to turn data into your most valuable strategic asset.
Take the first step towards unlocking the full potential of your data with Grow's BI dashboard tool and pave the way for informed, data-driven decision-making that propels your business forward.
0 notes
Text
Five Steps to Achieve Seamless Data Integration with Your Dashboard Tool
“Not being on the ground meant that the information started to become more scattered and I didn’t have the same feel for the sales numbers, ops stats, and customer service figures.”
Have you ever felt like Patrick Jungo, co-founder of Edit Suits Co., when trying to manage your business's data?
As businesses grow and expand, it's common to find your data spreading out as wide as your operations. But what happens when this scattered data starts affecting your ability to make informed decisions?
Imagine having operations in two different continents, like Edit Suits Co. did, with showrooms in London and Singapore. How do you keep track of everything when your data feels like it's everywhere? The challenge Edit Suits faced is not unique; it's something many businesses encounter. The question then becomes, how do you bring all this scattered information together to get a clear picture of your business?
This is where the importance of seamless data integration in your dashboard tool comes into play. Wouldn't it be a game-changer to have all your essential data in one place, easily accessible and ready to inform your decisions? That's precisely the journey we're about to embark on with this blog.
Ready to find out how you can keep your finger on the pulse of your operations, no matter where you or your data are? Let's dive in and discover how seamless data integration in dashboard Business Intelligence can be your business's new superpower.
Five Steps to Achieve Seamless Data Integration with Your Dashboard Tool
Step 1: Evaluate and Understand Your Data Landscape
Data Integration Architecture: Begin with a detailed architectural assessment of your data ecosystem. Implement a metadata management strategy to catalog data sources, schemas, and lineage. This foundational step ensures that your BI team can trace data back to its origin, critical for diagnosing issues or understanding the context of the data within your Business Intelligence dashboards.
Advanced Data Quality Techniques: Beyond basic quality checks, employ statistical and machine learning algorithms to identify anomalies, patterns, and trends in your data. Techniques such as predictive modeling and sentiment analysis can enrich your understanding of the data, providing deeper insights for more sophisticated dashboard Business Intelligence.
Step 2: Choose the Right Dashboard Tool
BI Tool Evaluation Metrics: When selecting a dashboard tool, consider advanced metrics such as the tool's ability to support complex data models, its performance under heavy query loads, and the flexibility of its data visualization capabilities. The integration of OLAP (Online Analytical Processing) cubes for multi-dimensional analysis can significantly enhance the analytical power of your Business Intelligence dashboards.
Custom Development and APIs: Evaluate the extent to which a dashboard tool supports custom development, including the availability of APIs for integrating custom data sources or embedding dashboard components into other applications. This flexibility is crucial for organizations with unique or evolving BI needs.
Step 3: Establish a Robust Data Integration Framework
Data Warehousing Solutions: Discuss the role of modern data warehousing solutions like Snowflake, BigQuery, or Redshift in supporting your BI dashboards. These platforms offer massive scalability and speed, enabling real-time data analysis and integration without the traditional overhead of on-premise data warehouses.
Data Transformation Technologies: Delve into specific data transformation technologies and frameworks, such as Apache Spark or Talend, which can process large volumes of data efficiently. Highlight the importance of streamlining the data transformation process to ensure that data is dashboard-ready, focusing on transformations like normalization, deduplication, and aggregation for optimal dashboard performance.
Step 4: Ensure Data Security and Compliance
Advanced Security Protocols: Explore advanced security protocols and encryption standards, such as TLS (Transport Layer Security) for data in transit and AES (Advanced Encryption Standard) for data at rest. Discuss how role-based access control (RBAC) and attribute-based access control (ABAC) can be implemented to fine-tune access rights to the Business Intelligence dashboards and underlying data.
Grow prioritizes data security by employing advanced protocols like TLS for data in transit and AES for data at rest, ensuring robust protection. Each Grow account benefits from a dedicated Data Pod, enhancing both performance and security through isolation, with it’s advanced security measures integrated within Business Intelligence dashboard tools. Committed to maintaining the highest security standards, Grow is SOC 2 compliant, independently audited to safeguard your data meticulously, underscoring its reliability among BI dashboard tools.

Compliance Automation Tools: Highlight the use of compliance automation tools and services that help manage the data governance landscape, ensuring continuous compliance with ever-changing regulations. Business Intelligence dashboard tools that automatically map data flows and identify sensitive information can greatly reduce the compliance burden.
Step 5: Train Your Team and Build a Data-Driven Culture
BI Competency Centers (BICC): Advocate for the establishment of a BI Competency Center or similar entity within your organization. This team leads BI initiatives, ensuring that BI practices are aligned with business objectives, and plays a crucial role in fostering a data-driven culture by serving as a hub for BI resources, best practices, and support.
Continuous Learning Platforms: Emphasize the importance of investing in continuous learning platforms and resources for your team. Platforms offering courses on data analytics, visualization best practices, and the latest BI technologies can keep your team at the forefront of BI developments, ensuring your dashboards continue to deliver actionable insights.
Conclusion
Navigating the complexities of integrating data into Business Intelligence dashboards can transform raw data into strategic business insights, propelling your decision-making processes into new realms of efficiency and accuracy. These five detailed steps provide a roadmap for businesses to harness their dashboard tools, not just for aggregating data but for unlocking actionable insights that drive strategy, ensure operational security, and amplify the overall impact of their BI initiatives.
In embracing this strategic approach to data integration, businesses position themselves to outpace competitors, cultivate a deeply ingrained culture of data-driven decision-making, and chart a course toward achieving their expansive strategic goals. The journey towards enhanced data utility and dashboard effectiveness is both a commitment and an investment in your organization's future.
To embark on this journey with confidence, consider leveraging cutting-edge tools like Grow. Grow's BI dashboard tools are designed to simplify complex data integration, offering intuitive, powerful solutions that empower businesses to visualize their data landscape vividly. With Grow, real-time insights and informed decision-making are within reach, ensuring that your data not only informs but also transforms your business strategy.
Why not experience the transformative power of Grow firsthand? Take advantage of Grow's 14-day free trial to explore how seamless data integration can elevate your BI dashboards. Dive into the world of data-driven decision-making with no commitments and discover the impact of actionable insights on your business operations.
For those on the fence, consider exploring "Grow Reviews 2024". Check out the experiences of over 20000 businesses like yours, detailing how Grow has revolutionized their data integration and BI efforts. Let their stories guide your decision, illustrating the tangible benefits and competitive edge that Grow's Business Intelligence dashboard tools can bring to your organization.
0 notes
Text
5 Data Visualization Techniques You Aren't Using But Should
Founded in 2011, RedShelf strives to simplify access to digital content for readers everywhere. But as RedShelf CFO & Co-Founder Tim Haitaian discovered, managing such a massive repository of digital information was anything but simple.
Data was there, but it was scattered and elusive. Have you ever felt overwhelmed by the sheer volume of data at your disposal, knowing its potential but unable to harness it effectively? This was the challenge at RedShelf.
The need for a robust, accessible, and transparent dashboard visualization platform became apparent. "We really started trying to create some sort of data visualization ourselves," Haitaian recalls. But frustration and limitations quickly set in. Can you relate to the feeling of hitting a wall with your data visualization efforts?
The quest for an alternative led RedShelf to Grow—a platform that promised and delivered immediate, company-wide visualization at a low cost. Suddenly, revenue figures, sales pipelines, and areas for improvement were not just numbers in a spreadsheet; they were insights that could be visualized and understood by the entire team. But why stop there?
Imagine taking this concept further, exploring business data visualization techniques beyond the basics—techniques that could transform your data into a compelling narrative, driving informed decisions and innovative strategies. What if there were tools and methods you haven't yet leveraged that could change the way you see your data?
From underutilized techniques to powerful insights, are you ready to discover what your data could truly reveal?
5 Data Visualization Techniques You Aren't Using But Should
Sankey Diagrams: Visualizing Flow Data
What is data visualization if not a means to uncover and understand the often complex flow of information within a business? Sankey diagrams are a prime example of this, providing a bird's-eye view of how resources, information, or even capital move through various stages in a process. These diagrams are especially useful in highlighting inefficiencies in workflows or pinpointing areas in customer journeys that need improvement.
For a business data visualization dashboard, incorporating Sankey diagrams means offering a clear view of how elements are interconnected, promoting a deeper understanding of system dynamics.
Sankey diagrams are not just visual tools but analytical instruments that can significantly impact resource management and operational efficiency. By visualizing the flow and quantity of resources through different processes or stages, businesses can pinpoint exactly where inefficiencies lie. A step further, integrating these diagrams into BI platforms allows for dynamic querying and real-time flow analysis.
For instance, using Python libraries such as Matplotlib or Plotly, BI developers can create interactive Sankey diagrams that update automatically with new data feeds, enabling ongoing optimization of processes like supply chain management, energy consumption, or budget flows.
When constructing a Sankey diagram, it's crucial to pay attention to the width of the links, which represent the quantity of flow, ensuring they accurately reflect the scale of data. Additionally, color coding can be used to differentiate between types of flows or stages, making the diagram not only informative but instantly interpretable.
Radar Charts for Multi-Dimensional Analysis
Radar charts allow analysts to present multiple variables of a subject in a way that's both comprehensive and easy to digest. They excel in scenarios where comparing a wide range of factors is essential, such as evaluating employee performance across several metrics simultaneously.
When integrated into a data visualization dashboard, radar charts provide a compact yet detailed analysis tool. Radar charts excel in environments where balancing a portfolio of products, services, or skills is crucial. For BI applications, they are invaluable for conducting SWOT analysis (Strengths, Weaknesses, Opportunities, Threats) across different business units or for competitor analysis. Advanced uses involve overlaying multiple radar charts to compare performance over time or against industry benchmarks.
The key to leveraging radar charts effectively in BI is normalization of data. Given that radar charts compare multiple variables, each with potentially different units and scales, normalizing data ensures that each axis is comparably scaled, allowing for meaningful comparisons. BI tools like SAS Visual Analytics offer advanced options for data normalization and customization of radar charts, enabling analysts to tailor the visualization to specific business contexts.
Heat Maps for Advanced Pattern Recognition
Heat maps are powerful tools for dashboard visualization, offering an intuitive means of identifying trends, behaviors, and outliers across large datasets. Whether it's tracking user interaction on a website or analyzing geographic data for market trends, heat maps transform numbers into a color-coded canvas of insight.
Using tools such as Grow, analysts can incorporate heat maps into their data visualization dashboards, elevating the narrative quality of the data and uncovering patterns that might otherwise go unnoticed.
Heat maps can be extended beyond simple color density representations to analyze variations over time or space, making them particularly useful for time series analysis or geographic data visualization. In BI contexts, heat maps can be employed to visualize sales performance across different regions, website traffic patterns, or product usage intensity among different customer segments.
Advanced heat mapping involves integrating time-series data, allowing businesses to track changes over different periods. This can be particularly insightful when integrated into dashboard visualization tools like Grow, where users can interact with the data, drilling down to see how patterns evolve on a daily, monthly, or yearly basis. Using gradient colors to represent growth or decline, analysts can quickly identify emerging trends or areas needing attention.
Network Graphs: Uncovering Relationships and Structures
Understanding the relationships and structures within data is crucial, and network graphs serve this purpose brilliantly. These visuals are indispensable for illustrating the connections within complex systems, from social networks to organizational hierarchies.
By incorporating network graphs into your dashboard visualization, you're not just presenting data; you're telling a story of interconnectivity and influence. Tools like Neo4j make the creation of these graphs more accessible, allowing BI professionals to explore and communicate the nuanced dynamics within their data.
In a BI setting, network graphs are invaluable for uncovering the hidden structure within complex sets of relationships, whether among people, products, or transactions. They can be used to identify influencers in social networks, understand cross-selling opportunities in transaction data, or map out the interdependencies in project management.
The real power of network graphs in BI comes from their ability to incorporate node and link attributes, such as size, color, and weight, to represent additional dimensions of data. For example, node size could represent a person's centrality within a network, while link color could indicate the strength of the relationship.
Tools like D3.js not only allow for the creation of these visualizations but also enable interactive exploration, where users can zoom in on nodes, explore connections, and dynamically filter the network based on various criteria.
Treemaps for Hierarchical Data Presentation
Treemaps offer a space-efficient way to display hierarchical data and part-to-whole relationships through nested rectangles.
For any business data visualization need, treemaps can be a game-changer, especially when dealing with product categories or organizational structures. They fit exceptionally well on a data visualization dashboard, where space is at a premium, and clarity is king.
With tools such as D3.js, creating treemaps that are both informative and aesthetically pleasing is straightforward, providing a powerful means to digest complex hierarchies at a glance.
Treemaps are particularly useful in BI for breaking down complex hierarchical data into digestible chunks. For example, they can show how different product categories contribute to overall sales, or how various expenses contribute to total costs. Advanced implementations can layer additional data points onto each rectangle, such as profitability or year-on-year growth, using color and size variations.
The sophistication of treemaps in BI applications lies in their ability to adapt to real-time data changes, offering a dynamic view of hierarchical relationships. Incorporating interactive elements, such as tooltips or drill-down capabilities, enhances their utility, allowing users to explore layers of data in depth. BI tools like IBM Cognos Analytics provide advanced treemap visualization options, including dynamic resizing and re-coloring based on underlying data changes, offering a powerful way to monitor and analyze business performance metrics.
Conclusion
In our journey through the diverse landscape of dashboard visualization, we've uncovered five powerful techniques that could significantly enhance your insights and decision-making processes. While understanding and implementing these techniques can seem daunting, there's a simple way to incorporate them into your business intelligence strategy without becoming overwhelmed by complexity.
Enter Grow, a game-changer in the BI and data visualization sphere. Grow stands out from the crowd with its full-stack, no-code approach, designed specifically to empower users across all levels of technical expertise. This means you don't need to be a data scientist to create stunning, insightful visualizations. With Grow, everyone from marketers to CEOs can easily harness the power of advanced data analysis.
But why choose Grow over other tools? The answer lies in its unique ability to simplify complex data tasks. Whether you're intrigued by the flow dynamics of Sankey diagrams, the comparative insights of radar charts, the deep analysis provided by heat maps, the intricate relationships highlighted by network graphs, or the hierarchical clarity offered by treemaps, Grow brings these sophisticated visualization techniques within reach. Its intuitive platform allows you to craft these complex visuals with just a few clicks, making your data analysis both more profound and accessible.
Imagine transforming raw data into actionable insights without getting tangled in coding or complex software. That's the convenience and power the Grow data visualization dashboard offers. It's not just about making data visualization easier; it's about making it more accessible and actionable for your entire team.
Convinced to see how Grow can transform your data visualization strategy? We invite you to start with a 14-day free trial. Experience firsthand the simplicity and power of Grow, and discover how it can elevate your data storytelling.
And don't just take our word for it. Check out "Grow Reviews from Verified Users on Capterra" to read real stories of how businesses like yours have revolutionized their data analysis and decision-making processes with Grow.
Ready to unlock the full potential of your data with minimal effort and maximum impact? It's time to let Grow do the heavy lifting for your BI and data visualization needs.
0 notes