
Last Seen Blogs

slippersandsmoke
three wips, one blog

coracj1819
CJ_18_cprfetish

gryfficons
gryfficons

geminiiviolets
ੈ✩‧₊˚
yaalibizappln
YAALI BIZAPPLN SOLUTIONS
Text
Evaluation
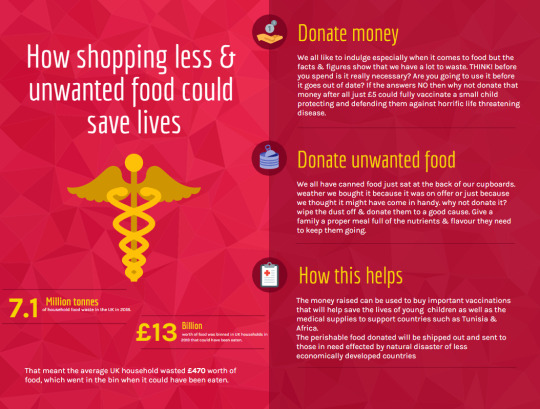
For this brief we were given lots of different briefs and had to choose one. I chose a brief to do with the weather. The aim what's to provide a solution to do with the brief that we had chosen. In my case this was to using social media to help raise awareness and money to help with the causes of natural disasters I then went want to research where countries most needed help with things that we take granted each day such as medical help and food I wanted to make this advertisement personal and relatable to everyone that watched it and giving the ordinary person a sense of how they are able to give to charity. I did this by using a big problem in the UK which food waste by using an infographic I displayed information about how much food we waste in the UK and how much money this amounted to. I also created too short animations do you also get this message across.
Once I actually decided what I wanted to do it was easy tow go ahead with it and start to design my adverts and what I wanted to do I really enjoyed putting it altogether and creating what I have and again being able to develop my after effects skills further as well as using more of my drawing skills to actually create all of the assets that I have. However due to me taking so long to actually decide what I wanted to do I feel as if I drifted away from the aims of the brief and kind of went off from the brief that I had chosen but I do feel as if it doesn’t really fit that brief as well as it could this is as I’ve explained because of me struggling to actually come up with an idea that was fitting for the brief. I also find that I do get carried away with the first idea that I get and straight away just start to develop it without actually assessing my other options and this effectively means that I am wasting time developing an idea further that I’m not even going to use or that might not even be fitting for the brief. What didn’t go to plan was also me expecting to much of myself and aiming to do things at an impossibly high standard compared to what my actual skills are I defiantly do expect a lot from myself and with the project I defiantly thing that that that came through by what I was hoping to produce and then what I actually produced.
Things that I would have done differently of course is my time management this always seems to be an issue for me and the fact that I never leave myself enough time to the more important things such as the final product or that I spend to much time on things such as drawing all of my assets. I would have also planned my ideas out as in put them all down on paper as a collective and then decided what I want to do so as well as my time management I would have also done all of my planning defiantly as I never actually wrote out what I needed to do in a time like.
0 notes
Text
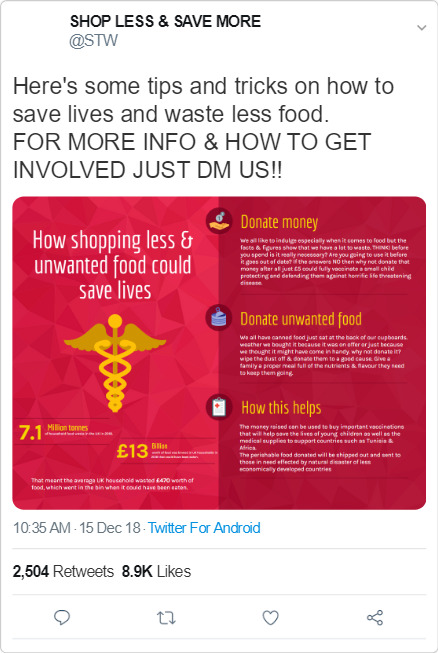
Social Media
making my fake social media posts. i did this by using the info graphic i had created and the also using a website that makes fake social media posts this is so that i was able to make the post look as professional as possible.
TWITTER POST
INSTAGRAM POST

SNAPCHAT POST

0 notes
Text
Assets for my other animations
so recently it came to light that i had to create 3 animations instead of 1 so i had to start collecting assets
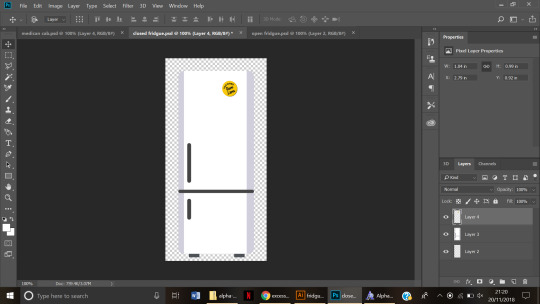

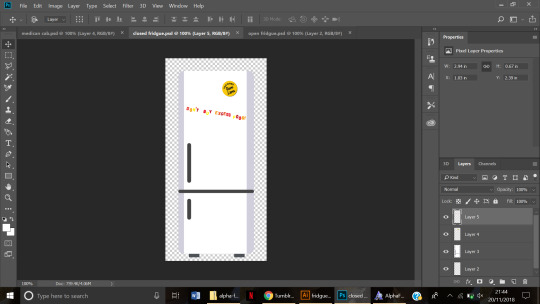
again looking at more and more reference photos i then also went on to create the food that would go into the fridge.
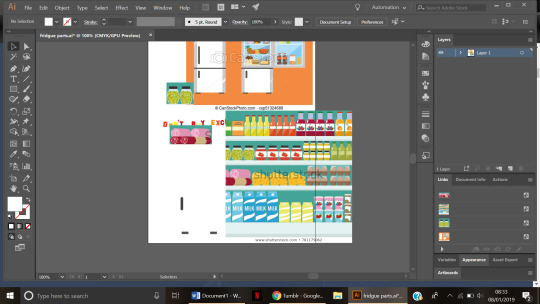
once i had found an image with pictures of food that i wanted to use i would the crop the image down to the section that i wanted to use and then paste this into Photoshop where the image of the open fridge was made and start to get rid of the background to make it look as if the food was placed actually into the fridge after repeating this process several times once the fridges was full i then exported the image that i had made this is the image displayed at the bottom.


0 notes
Text
creating my animation

once i have come up with all of my assets i am then going to export them and the import them into after effects. once imported ill then start to animate. looking at my storyboards and also going along with what flows
videos ivve used:
https://www.youtube.com/watch?v=tQ5wqg10x_I
https://www.youtube.com/watch?v=IhpgNKEH-Wk
0 notes
Text
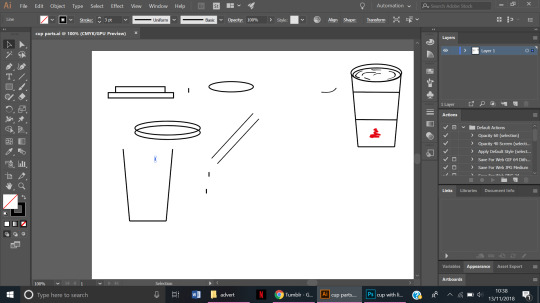
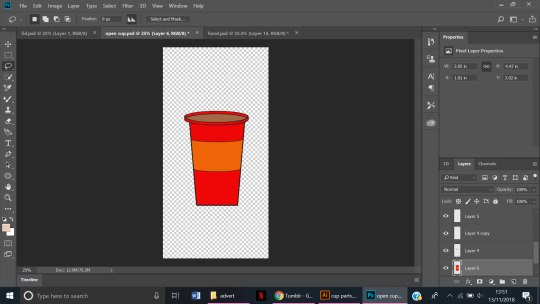
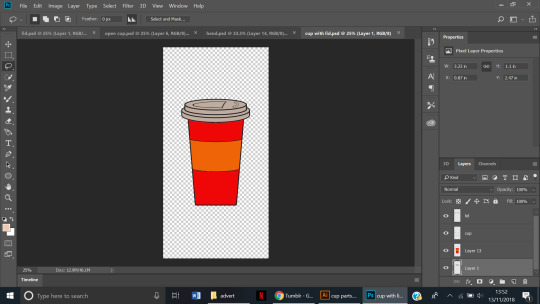
creating the parts of my animation
using a mix of illustration and Photoshop i am going to be creating the parts that i need for my animation the things that i need to create are:
coffee cup
coffee cup lid
water
steam
string stick
here are some screenshots of this process


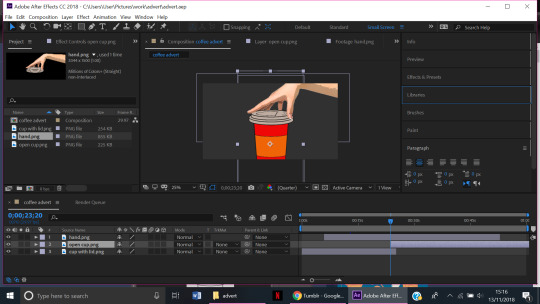
making my hand look more cartoon to fit in with the style of the rest of the animation

0 notes

Text
Iconography
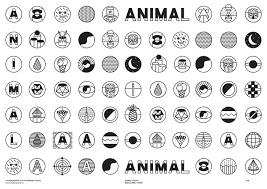


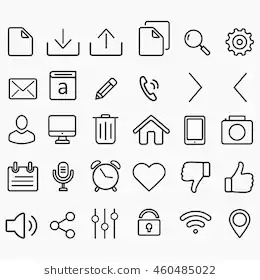

I want to keep my iconography really simple and not too cartoonie they also have to be simple enough so that people know what it is.
https://iconsflow.com/dashboard
I have now selected all of the icons that i want to go ahead and use in my info graphic. because the quality is so poor of them when the file is downloaded i will have to go over them in Photoshop


here is an example of some of the few i have downloaded.
0 notes

Text
Statistics
Donating to Charitable Causes
Most people have donated to charity in the last year (61%).1
Most people report giving to charity from time-to-time (51%) or monthly (25%).1
The average donation amount in 2016 was £18.1
Approximately £185 million was raised in 2015 by bake sales alone.2
Overall charitable giving was up 2.9% among UK nonprofits in 2017.3
Who Gives
Women are more likely than men to give to animal charities (30% vs. 19%) and children's charities (26% vs. 22%).1
Young people are more likely to give to physical and mental health care charities, homeless people, housing and refugee shelters, and educational institutions, while the oldest age group are more likely to favour hospitals, hospices, and religious charities.1
Online Giving
Online giving increased in 2017 by 12.1% compared to 2016.3
Online giving increased 18.5% among UK nonprofits in 2017.3
About 7.6% of overall fundraising revenue, excluding grants, was raised online in 2017—a record high percentage.3
Of all online donations in 2016, 10% were £800 or more, and 40% of nonprofits received at least one online donation of £800 or more.4
The average online donation in the UK increased 20% (£63.69 vs. £52.87) from Jan 2010 to Dec 2014.4
The largest increases in online giving between 2016 and 2017 were seen in Faith-Based nonprofits (18.1%), Environment/Animal Welfare (17.6%), and Arts and Culture (17.2%).3
21% of all online donations in 2017 were made using a mobile device.3
Donations made via websites, social media and apps account for 26% of donations in the UK.5
Websites, social media and apps account for £2.4 billion in donations in the UK annually.5
A 2014 survey of not-for-profits found 15% of all private giving came from online donations.6
More than half (55%) of surveyed not-for-profits reported increased online giving within the past 12 months of being surveyed.6
Why We Give
Medical research (26%), animal welfare (25%) and children or young people (24%) were the most popular causes to donate money to in 2016.1
Religious organisations receive the largest share of donations by monetary value: 20%.1
The average donation to religious causes is £60. The overall average donation was £40.1
70% of potential donors agreed they would be more inclined to give to charity if they knew how money was directly helping.2
In a survey of high-value donors (donations >£1,000), 97% listed their personal values as a motivator for giving.11
The top motivators: personal values (97%), sense of morality/ethics (96%), particular belief in a specific cause (75%), faith (71%), personal experiences (61%).11
How We Give
Most donors prefer cash donations: 58% of donors made a cash donation in past 12 months.1
Other popular methods of donation include: buying goods (40%), raffle/lottery (40%), direct debit (31%), online (26%), fundraising event (22%).1
Organisations & Foundations
There were 165,801 voluntary organisations/general charities in the UK in 2014/2015.7
The top 300 independent foundations represent 90% of all giving by value of the 10,000+ independent foundations in the UK.8
Grant spending by the top 300 foundations in 2014/2015 reached a record £2.7 billion.8
Between 2012/13 and 2014/15, the largest organisations increased in income while the smaller organisations stayed the same or decreased slightly.7
An estimated £6.1 billion of annual grants were transacted through grant-making foundations in 2013/2014.6
Publicly-funded foundations make more than £1 billion of foundation grants, accounting for 17% of all grant-making.6
The income of 'super-major' organisations (income over £100m) increased from £6.4bn to £8.6bn between 2012/13 and 2014/15.7
The number of ‘super-major’ organisations increased from 33 to 42 between 2012/13 and 2014/15, indicating that some ‘major’ organisations received sufficient growth in income to push them over the £100m threshold.7
The income of 'major' organisations (income over £10m) also saw an increase from £13.6bn to £14.6bn over the same period.7
Volunteering
70% of survey participants reported volunteering at least once in last 12 months.9
More than half (56%) of British corporate professionals would volunteer overseas if they had a job to come back to.10
47% of survey participants reported volunteering at least once per month in 2015-2016.9
Large Donations
There were 355 donations of £1m+ in 2015, a 19% increase compared to 2014.12
Large donations (£1m+) totaled £1.83bn in 2015, the highest figure since the financial crisis of 2008-2009.12
The average size of a large donation (£1m+) was £5.1m in 2015, a slight decrease compared to 2014 (£5.3m).12
The largest single donation was £60.75m in 2014.12
Large donations (£1m+) from Foundations totaled £1.01bn in 2015, accounting for 55% of all £1M+ giving for the calendar year.12
Large donations (£1m+) from individuals totaled £431m in 2015, accounting for 24% of all £1M+giving for the calendar year.12
Large donations (£1m+) from corporations totaled £368m in 2015, accounting for 20% of all £1M+ giving for the calendar year.12
Of the 355 large donations made in 2015, London accounted for 260 gifts 71% of £1M+ giving.12
There were 267 total recipients of large donations (£1m+) in 2015. Of these, 218 received one large gift, and 49 recipients received multiple gifts, of which 16 received three or more gifts during 2015.12
The breakdown of large gift giving (£1m+) in 2015 by sector.12
Foundations: £500m, 79 gifts
Higher Education: £639m, 85 gifts
Overseas (recipient was based outside of UK): £242m, 67 gifts
Arts, Culture & Humanities: £135m, 37 gifts
International (international development): £88m, 20 gifts
Human Services: £75m, 24 gifts
Health: £46m, 14 gifts
Public & Societal Benefit: £42m, 10 gifts
Religious: £30m, 6 gifts
Environment & Animals: £14m, 5 gifts
Education (non-university): £13m, 7 gifts
Unknown / Other: £2.29, 1 gift
0 notes
Link
0 notes

Photo


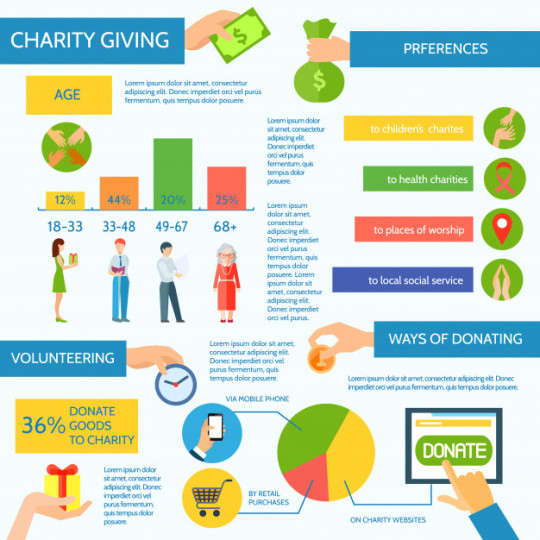
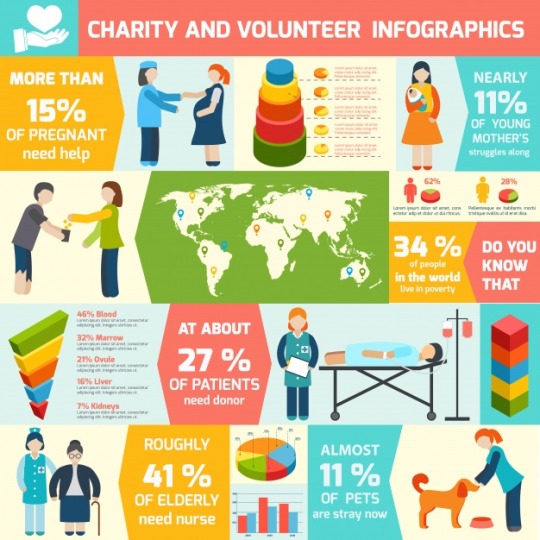
looking at info graphics and the style that i want to go with. I want to keep it simple and very easy to understand
0 notes
Photo

Why, What & Who: I've answered these questions to really give an idea of where i want to go with this project i think my next step is going to be researching a little further into what i want my posters and other promotional materiel to look like
0 notes