
karanshah1910
Karan Shah 1910
Developer | Programmer ; | { Coder }
3 posts
Don't wanna be here? Send us removal request.
Last Seen Blogs

loopistyle
Loopistyle

germanyvisaukblog
Germany Visa

martazardetto
Marta Zardetto

sunncord
sun

zenithlux
Full-Time Dreamer
Text
10 Minutes to Data frames in Pandas
Learn and Become a Master of one of the most used Python tools for Data Analysis.

Introduction:-
Pandas is an open source, BSD-licensed library providing high-performance, easy-to-use data structures and data analysis tools for the Python programming language.
The Data Structures provided by Pandas are of two distinct types :-
Pandas DataFrames &
Pandas Series
We’ll look at Pandas Dataframes in this post.
What is Data frames ?
A Data frame is a two-dimensional data structure, i.e., data is aligned in a tabular fashion in rows and columns.
A Data frame is a two-dimensional data structure, i.e., data is aligned in a tabular fashion in rows and columns. Pandas DataFrame consists of three principal components, the data, rows, and columns.
Features of DataFrame
Potentially columns are of different types.
Size — Mutable.
Labeled axes (rows and columns).
Can Perform Arithmetic operations on rows and columns.
Diffrence between Series and DataFrame

You can think of it as an SQL table or a spreadsheet data representation.
How to Create a Dataframe ?
A pandas DataFrame can be created using the following constructor −

The parameters of the constructor are as follows −
Data : data takes various forms like ndarray, series, map, lists, dict, constants and also another DataFrame.
index : For the row labels, the Index to be used for the resulting frame is Optional Default np.arange(n) if no index is passed.
columns : For column labels, the optional default syntax is — np.arange(n). This is only true if no index is passed.
dtype : Data type of each column.
copy : This command (or whatever it is) is used for copying of data, if the default is False.

Reading the data and first insights
The first thing we should do, once we have downloaded or collected some data is to read such data into a pandas DataFrame. This is one of the main Pandas objects, along with the Series, and like I mentioned before, it resembles a table with columns and rows. Before, as always, we should import the library.

The method read_csv, reads data from a csv file that is located in the same directory as the script or notebook that we are running the code from. Pandas also has functions for reading from Excel sheets, HTML documents, or SQL databases (although there are other tools that are better for reading from databases)
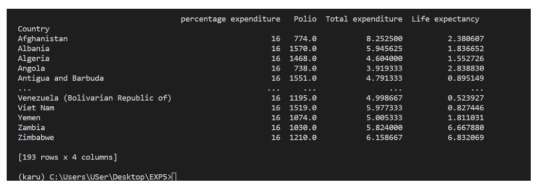
We can check out the first n rows of our dataframe using the head method. There is also a tail method to look at the last n. By default if no n is given to these methods they return the first 5 or last 5 instances.

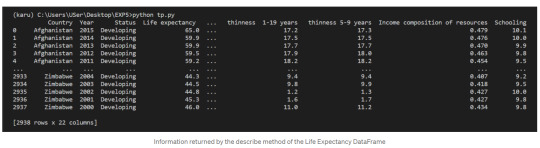
Using the head method without a parameter returns the following block:

After successfully reading our data and creating our dataframe, we can start getting some information out of it with two simple methods:
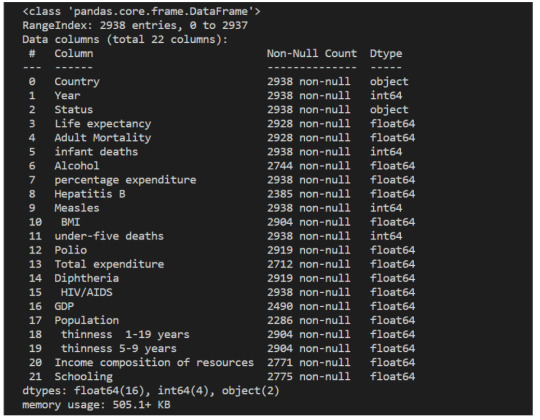
info: the info method returns the number of rows in the dataframe, the number of columns, the name of each column of the dataframe along with the number of non-null values of such column, and the data type of each column.

2. describe: the describe method returns some useful statistics about the numeric data in the dataframe, like the mean, standard deviation, maximum and minimum values, and some percentiles.

The next step after getting this global view of our data is learning how to access specific records of our dataframe. Like a python list, pandas dataframes can be sliced, using exactly the same notation as for the lists.
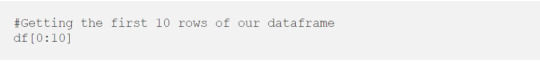
So if we want to select the first 10 rows of our dataframe, we could do something like:

Indexing and selecting data
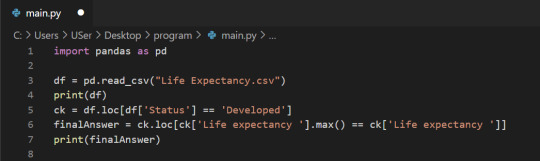
With loc and iloc you can do practically any data selection operation on DataFrames you can think of.
1. loc is label-based, which means that you have to specify rows and columns based on their row and column labels.
2. iloc is integer index based, so you have to specify rows and columns by their integer index.
After successfully understanding theory behind the loc and iloc , Let’s get started to implement it.
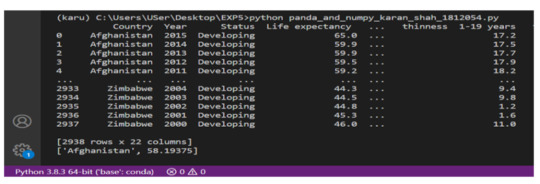
Average Life Expectancy over 15 Years in Afghanistan.

2. Highest Life Expectancy in Developed Country over 15 years.

Any groupby operation involves one of the following operations on the original object. They are −
Splitting the Object
Applying a function
Combining the results
eg :- Showing data of all Country having avg total expenditure, sum of polio and standard deviation of life expectancy with the method called groupby —

We have seen what Pandas is, and some of its most basic uses. In the following posts we will see more complex functionalities and dig deeper into the workings of this fantastic library!
To check it out follow me on tumblr, and stay tuned!
That is all, I hope you liked the post. Feel Free to follow me on tumblr
Also, you can take a look at my other posts on Data Science and Machine Learning here. Have a good read!
#python#data analysis#data visualization#pandas#data science#machine learning#data mining#missing values
0 notes
Link
Master NumPy Library for Data Analysis in Python | By Karan Shah
0 notes
Text
Master NumPy Library for Data Analysis in Python in 10 Minutes
Learn and Become a Master of one of the most used Python tools for Data Analysis.

Introduction:-
NumPy is a python library used for working with arrays.It also has functions for working in domain of linear algebra, fourier transform, and matrices.It is an open source project and you can use it freely. NumPy stands for Numerical Python.
NumPy — Ndarray Object
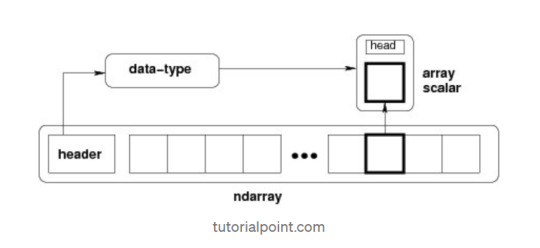
The most important object defined in NumPy is an N-dimensional array type called ndarray. It describes the collection of items of the same type. Items in the collection can be accessed using a zero-based index.Every item in an ndarray takes the same size of block in the memory.
Each element in ndarray is an object of data-type object (called dtype).Any item extracted from ndarray object (by slicing) is represented by a Python object of one of array scalar types.
The following diagram shows a relationship between ndarray, data type object (dtype) and array scalar type −
It creates an ndarray from any object exposing array interface, or from any method that returns an array.
numpy.array(object, dtype = None, copy = True, order = None, subok = False, ndmin = 0)
The above constructor takes the following parameters −
Object :- Any object exposing the array interface method returns an array, or any (nested) sequence.
Dtype : — Desired data type of array, optional.
Copy :- Optional. By default (true), the object is copied.
Order :- C (row major) or F (column major) or A (any) (default).
Subok :- By default, returned array forced to be a base class array. If true, sub-classes passed through.
ndmin :- Specifies minimum dimensions of resultant array.
Operations on Numpy Array
In this blog, we’ll walk through using NumPy to analyze data on wine quality. The data contains information on various attributes of wines, such as pH and fixed acidity, along with a quality score between 0 and 10 for each wine. The quality score is the average of at least 3 human taste testers. As we learn how to work with NumPy, we’ll try to figure out more about the perceived quality of wine.
The data was downloaded from the winequality-red.csv, and is available here. file, which we’ll be using throughout this tutorial:
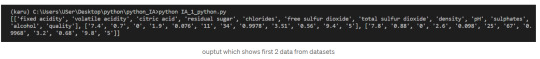
Lists Of Lists for CSV Data
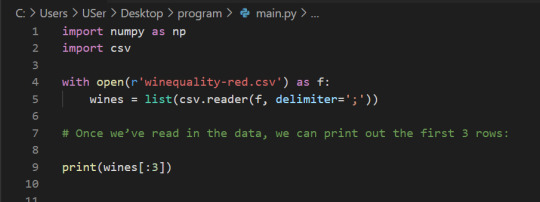
Before using NumPy, we’ll first try to work with the data using Python and the csv package. We can read in the file using the csv.reader object, which will allow us to read in and split up all the content from the ssv file.
In the below code, we:
Import the csv library.
Open the winequality-red.csv file.
With the file open, create a new csv.reader object.
Pass in the keyword argument delimiter=";" to make sure that the records are split up on the semicolon character instead of the default comma character.
Call the list type to get all the rows from the file.
Assign the result to wines.
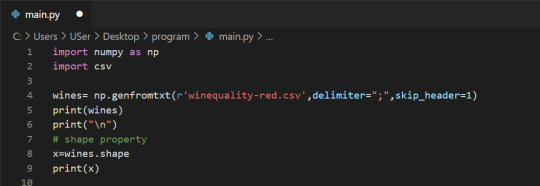
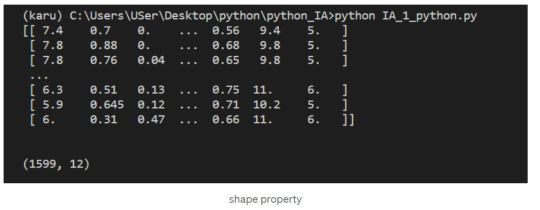
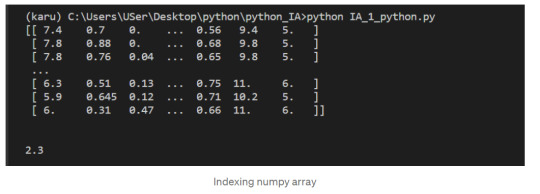
We can check the number of rows and columns in our data using the shape property of NumPy arrays:
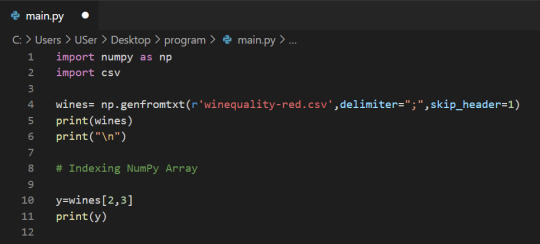
Indexing NumPy Arrays
Let’s select the element at row 3 and column 4. In the below code, we pass in the index 2 as the row index, and the index 3 as the column index. This retrieves the value from the fourth column of the third row:
1-Dimensional NumPy Arrays
So far, we’ve worked with 2-dimensional arrays, such as wines. However, NumPy is a package for working with multidimensional arrays. One of the most common types of multidimensional arrays is the 1-dimensional array, or vector.
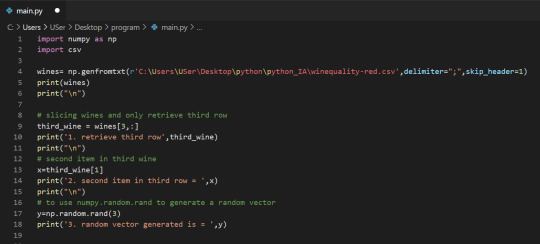
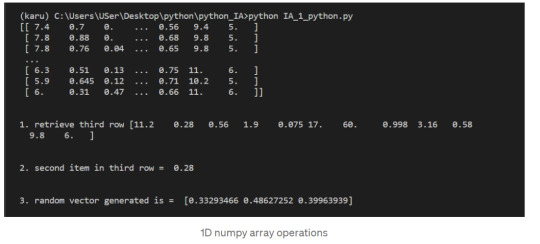
1.Just like a list of lists is analogous to a 2-dimensional array, a single list is analogous to a 1-dimensional array. If we slice wines and only retrieve the third row, we get a 1-dimensional array:
2. We can retrieve individual elements from third_wine using a single index. The below code will display the second item in third_wine:
3. Most NumPy functions that we’ve worked with, such as numpy.random.rand, can be used with multidimensional arrays. Here’s how we’d use numpy.random.rand to generate a random vector:
After successfully reading our dataset and learning about List, Indexing, & 1D array in NumPy we can start performing the operation on it.
The first element of each row is the fixed acidity, the second is the volatile ,acidity, and so on. We can find the average quality of the wines. The below code will:
Extract the last element from each row after the header row.
Convert each extracted element to a float.
Assign all the extracted elements to the list qualities.
Divide the sum of all the elements in qualities by the total number of elements in qualities to the get the mean.
NumPy Array Methods
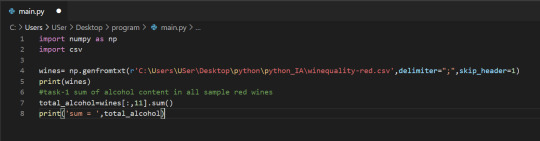
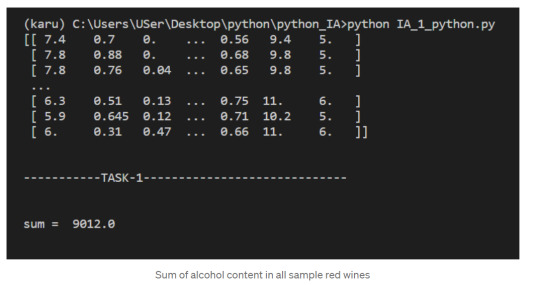
In addition to the common mathematical operations, NumPy also has several methods that you can use for more complex calculations on arrays. An example of this is the numpy.ndarray.sum method. This finds the sum of all the elements in an array by default:
2. Sum of alcohol content in all sample red wines
NumPy Array Comparisons
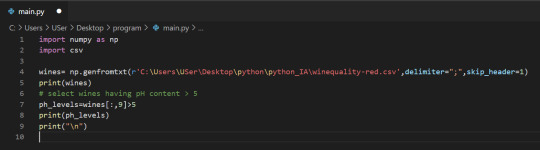
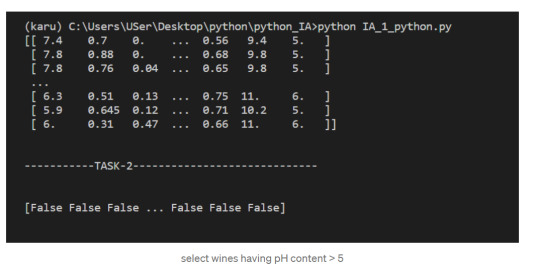
We get a Boolean array that tells us which of the wines have a quality rating greater than 5. We can do something similar with the other operators. For instance, we can see if any wines have a quality rating equal to 10:
3. select wines having pH content > 5
Subsetting
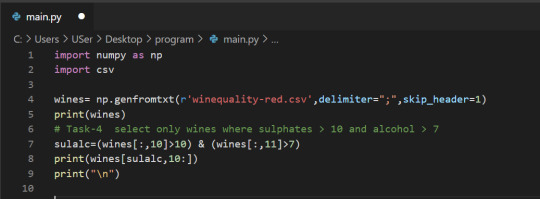
We select only the rows where high_Quality contains a True value, and all of the columns. This subsetting makes it simple to filter arrays for certain criteria. For example, we can look for wines with a lot of alcohol and high quality. In order to specify multiple conditions, we have to place each condition in parentheses, and separate conditions with an ampersand (&):
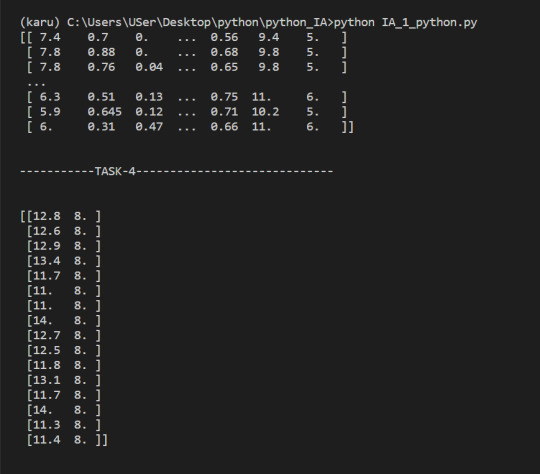
4. Select only wines where sulphates >10 and alcohol >7
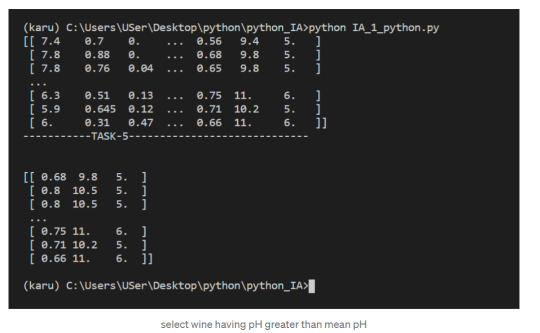
5. select wine having pH greater than mean pH
We have seen what NumPy is, and some of its most basic uses. In the following posts we will see more complex functionalities and dig deeper into the workings of this fantastic library!
To check it out follow me on tumblr, and stay tuned!
That is all, I hope you liked the post. Feel Free to follow me on tumblr
Also, you can take a look at my other posts on Data Science and Machine Learning here. Have a good read!
1 note
·
View note