#Top weighted Nifty50 stock
Text
Market Talk - September 7, 2022

ASIA:
US Trade Representative Katherine Tai suggested on Wednesday that punitive tariffs on Chinese imports will not drop until Beijing adopts more market-oriented trade and economic principles. Speaking at a discussion organized by the Carnegie Endowment for International Peace, Tai elaborated on US President Joe Biden’s economic strategy with regard to China, characterizing it as the result of an “awakening” to different histories and principles of governance that have prevented Beijing from accepting what Washington expects from members of the World Trade Organization . While Biden maintains Trump-era tariffs on Chinese goods, industry experts say punitive taxes don’t carry the same weight they once did, calling them “totally political, not economic.” The four-year expiration date on some of Washington’s punitive tariffs on Chinese imports came and went on Tuesday, leaving a 25 percent tariff on about $16 billion worth of goods in place despite ambivalence from the administration of US President Joe Biden.
The major Asian stock markets had a mixed day today:
- NIKKEI 225 decreased 196.21 points or -0.71% to 27,430.30
- Shanghai increased 2.85 points or 0.09% to 3,246.29
- Hang Seng decreased 158.43 points or -0.83% to 19,044.30
- Kospi decreased 33.56 points or -1.39% to 2,376.46
- ASX 200 decreased 97.20 points or -1.42% to 6,729.30
- SENSEX decreased 168.08 points or -0.28% to 59,028.91
- Nifty50 decreased 31.20 points or -0.18% to 17,624.40
The major Asian currency markets had a mixed day today:
- AUDUSD increased 0.00160 or 0.24% to 0.67494
- NZDUSD increased 0.00190 or 0.31% to 0.60557
- USDJPY increased 0.988 or 0.69% to 144.090
- USDCNY decreased 0.00080 or -0.01% to 6.96880
Precious Metals:
l Gold increased 14.01 USD/t oz. or 0.82% to 1,715.16
l Silver increased 0.287 USD/t. oz or 1.59% to 18.340
Some economic news from last night:
China:
Exports (YoY) (Aug) decreased from 18.0% to 7.1%
Imports (YoY) (Aug) decreased from 2.3% to 0.3%
Trade Balance (USD) (Aug) decreased from 101.26B to 79.39B
Australia:
AIG Services Index (Aug) increased from 51.7 to 53.3
GDP (QoQ) (Q2) increased from 0.7% to 0.9%
GDP (YoY) (Q2) increased from 3.3% to 3.6%
GDP Capital Expenditure (Q2) decreased from 0.7% to 0.2%
GDP Chain Price Index (Q2) decreased from 4.9% to 4.3%
GDP Final Consumption (Q2) decreased from 2.3% to 1.3%
Some economic news from today:
China:
FX Reserves (USD) (Aug) decreased from 3.104T to 3.055T
Hong Kong:
Foreign Reserves (USD) (Aug) decreased from 441.80B to 431.80B
Japan:
Coincident Indicator (MoM) (Jul) decreased from 3.3% to 1.4%
Leading Index (MoM) (Jul) decreased from -0.3% to -0.7%
Leading Index decreased from 100.3 to 99.6
EUROPE/EMEA:
Bank of England Governor Andrew Bailey and other top central bank officials spoke to lawmakers on Wednesday about last month’s decision to raise interest rates to the highest since 2008 in the face of double-digit inflation. The central bank accelerated the pace of growth in borrowing costs in an effort to limit damage to the world’s fifth-largest economy from a jump in inflation above 10%, even as it expects a recession to begin later this year. The BoE forecast in August that inflation would top 13%, and some economists said it could top 20% if gas prices – pushed up by Russia’s invasion of Ukraine – remain high. BoE governor Andrew Bailey, who also spoke to parliament’s finance committee, said Truss’s impending announcement would provide useful clarity to markets.
The major Europe stock markets had a mixed day:
- CAC 40 increased 1.31 points or 0.02% to 6,105.92
- FTSE 100 decreased 62.61 points or -0.86% to 7,237.83
- DAX 30 increased 44.53 points or 0.35% to 12,915.97
The major Europe currency markets had a mixed day today:
- EURUSD increased 0.00939 or 0.95% to 0.99929
- GBPUSD increased 0.00005 or 0.00% to 1.15129
- USDCHF decreased 0.00598 or -0.61% to 0.97832
Some economic news from Europe today:
UK:
Halifax House Price Index (YoY) decreased from 11.8% to 11.5%
Halifax House Price Index (MoM) (Aug) increased from -0.1% to 0.4%
Germany:
German Industrial Production (MoM) (Jul) decreased from 0.8% to -0.3%
France:
French Reserve Assets Total (Aug) increased from 241,892.0M to 242,728.0M
Italy:
Italian Retail Sales (MoM) (Jul) increased from -1.1% to 1.3%
Italian Retail Sales (YoY) (Jul) increased from 1.3% to 4.2%
Euro Zone:
Employment Change (QoQ) (Q2) decreased from 0.7% to 0.4%
Employment Change (YoY) (Q2) decreased from 3.1% to 2.7%
Employment Overall (Q2) increased from 163,412.6K to 164,098.0K
GDP (QoQ) (Q2) increased from 0.5% to 0.8%
GDP (YoY) (Q2) decreased from 5.4% to 4.1%
US/AMERICAS:
The demand for mortgages is on the decline in the US as rates continue to rise. Applications fell by 1% for the week but declined by 23% from the year prior. The 30-year fixed-rate mortgage rose to 5.94% last week, a sharp rise from the 5.8% rate the week prior. Due to higher rates, it comes as no surprise that refinances are steeply declining. Refinance applications fell 83% from the same period one year ago when the rate was beneath 3%.
Fed Gov. Michael Barr is set to be nominated for the role of banking regulator by the Biden Administration. Barr, who also acted as assistant Treasury secretary under Obama, announced he will prioritize climate-related financial risks as well as cryptocurrency regulation. He plans to implement climate risk scenario analyses at the central bank and further transparency over the crypto marketplace.
US Market Closings:
- Dow advanced 436.35 points or 1.4% to 31,581.65
- S&P 500 advanced 71.8 points or 1.84% to 3,979.99
- Nasdaq advanced 246.99 points or 2.14% to 11,791.9
- Russell 2000
Canada Market Closings:
- TSX Composite
- TSX 60
Brazil Market Closing:
- Bovespa
ENERGY:
The oil markets had a negative day today:
- Crude Oil decreased 4.511 USD/BBL or -5.19% to 82.369
- Brent decreased 4.17 USD/BBL or -4.49% to 88.660
- Natural gas decreased 0.24 USD/MMBtu or -2.95% to 7.9050
- Gasoline decreased 0.0998 USD/GAL or -4.13% to 2.3161
l Heating oil decreased 0.0127 USD/GAL or -0.36% to 3.5611
The above data was collected around 13:29 EST on Wednesday
- Top commodity gainers: HRC Steel (3.23%), Wheat (3.83%), Lumber (2.51%) and Butter (2.80%)
- Top commodity losers: Cocoa (-4.84%), Crude Oil (-5.19%), Gasoline (-4.13%) and Brent (-4.49%)
The above data was collected around 13:35 EST on Wednesday.
BONDS:
Japan 0.245%(+0.5bp), US 2’s 3.46% (-0.037%), US 10’s 3.2597% (-8.03bps); US 30’s 3.40% (-0.081%), Bunds 1.575% (-3bp), France 2.154% (-5.2bp), Italy 3.869% (-9.6bp), Turkey 11.18% (-25bp), Greece 4.144% (-2.9bp), Portugal 2.65% (-4.8bp); Spain 2.724% (-7.7bp) and UK Gilts 3.0320% (-6.4bp).
Original Article
Original Article Here:
Read the full article
0 notes
Text
latest news
SC ISSUES NOTICE TO STATES OVER REPEATED USE OF SECTION 66A OF IT ACT
The Union Ministry of Home Affairs had written to states, asking them not to enlist cases under the revoked arrangement and pull out any such case that might have been documented.
The Supreme Court Monday gave notification to all states, Union domains and Registrar Generals of all high courts regarding a request over the proceeded with utilization of the
area 66A of Information Technology (IT) Act, regardless of it being struck down in March 2015.
In a request by the NGO, People Union for Civil Liberties, a seat of Justices RF Nariman and BR Gavai expressed that they "will pass far reaching request so that question of booking individuals
under rejected area 66A of IT Act is settled for the last time."
The request expressed that the rejected area kept on being used at police headquarters as well as in preliminary courts the nation over. To which, the seat reacted,
"Legal executive we can deal with independently however police is likewise there. There should be one legitimate request since this can't proceed."
Prior, the Union Ministry of Home Affairs had written to states asking them not to enroll cases under the canceled arrangement and pull out any such case that might have been recorded.
"The Union Ministry of Home Affairs (MHA) has mentioned States and Union Territories (UTs) to coordinate all police headquarters under their locale not to enroll cases under
the revoked Section 66A of the Information Technology Act, 2000. It has additionally asked the States and UTs to sharpen law requirement offices for the consistence of the
request gave by the Supreme Court on 24.03.2015," an assertion gave by the MHA said.
The move came after the Supreme Court on July 5 communicated its shock over the proceeded with utilization of segment 66A of the IT Act.
"Stunning. What is happening is horrendous," commented Justice Nariman as Senior Advocate Sanjay Parikh caused the court to notice how cases have expanded consistently finished
the years in spite of the March 24, 2015, administering in the Shreya Singhal v. Association of India case that struck down segment 66A for "being violative of Article 19(1)(a) and not
saved under Article 19(2)."
Segment 66A enabled police to make captures over what cops, as far as their abstract caution, could understand as "hostile" or "threatening" or for the reasons for
causing irritation, bother, and so on
Realty partakes popular; Oberoi, IB Realty, Prestige Estates, Sobha up 5%
Portions of land organizations were sought after in Monday's meeting, pushing Nifty Realty and the S&P BSE Realty to their individual multi-year highs on assumptions for
further developed viewpoint.
At 10:25 am, Nifty Realty Index (up 3.9 percent) and the S&P BSE Realty Index (up 3.8 percent) were up almost 4%, when contrasted with a 0.6 percent rise each in the
Nifty50 and the S&P BSE Sensex. In the previous three months, realty records have flooded 35% contrasted and a 8.4 percent acquire in the benchmark files.
Oberoi Realty, Prestige Estates Projects, Indiabulls Real Estate and Sobha were up 5% each while Brigade Enterprises, Godrej Properties, Sunteck Realty and DLF were
up between 2% to 4 percent on the BSE in intra-day exchange.
As indicated by ICICI Direct, the realty file and its constituents have quite recently recorded a solid breakout from a long term base arrangement and are put on the cusp of the following
major underlying positively trending market. "We anticipate that the sector should beat in coming years wherein organizations like DLF, Oberoi Realty, Godrej Properties, Phoenix Mills, Brigade endeavors,
Indiabulls Real Estate and Sobha, which by and large contribute 87% of Nifty Realty Index, are ready to create better than expected returns in years to come and ought to be
considered as long haul speculation wagers in portfolios," it said.
Among singular stocks, Macrotech Developers, the as of late recorded land organization, flooded 6% to Rs 905.70 on the BSE in the intra-day exchange on Monday.
The stock was exchanging at its most significant level since its posting on April 19, 2021. In the previous one month, the stock has zoomed 32% as against a 0.75 percent ascend in the
benchmark record.
In the April-June quarter (Q1FY22), Macrotech Developers timed an absolute deals booking of Rs 957 crore, of which Rs 654 crore came in June. Bullish on the viewpoint for lodging interest,
Lodha said: "Significance of claiming a house has expanded essentially since the flare-up of Covid-19 pandemic. Individuals are utilizing their investment funds to purchase homes. Financing costs on home
credits are at an authentic low."
On Friday, Macrotech Developers revealed a solidified net benefit of Rs 161 crore for the quarter finished June. It had posted a total deficit of Rs 134 crore in the year-prior period.
All out pay developed to Rs 1,712 crore in the main quarter of this financial year from Rs 573 crore in the comparing time of the earlier year.
Oberoi Realty, the top gainer, was up 7% and hit another high of Rs 720.45 after it detailed deals volume of 0.9 lakh sq ft (up 6.5x YoY on waste of time base of Q1FY21 however down
91% QoQ) generally because of the subsequent wave effect and high base of Q4FY21, which a few dispatches including a major dispatch at Goregaon. The business esteem was up 5.9x YoY,
down 91% QoQ at Rs 170 crore. On the monetary front, detailed incomes grew 141% YoY yet were down 64% to Rs 284.3 crore. Edges at 43.9 percent were down
334 premise focuses (bps) QoQ.
The administration said the land area is going through significant combination as not many engineers have the monetary steadiness to embrace huge capital-escalated projects.
In this manner, the portion of the overall industry of rumored brands with solid execution capacities will keep on developing, it said.
THE AFFECT OF UNSOLD INVENTORY ON REAL ESTATE
"Offload, offload, offload – dispose of your inventories" – This was the exhortation last year from Hardeep Singh Puri, the Housing and Urban Affairs Minister, for the Indian land engineers. This suggestion approached closely following a comparative explanation made by Piyush Goyal, the Minister of Commerce and Industry, as the lockdowns had pushed the realty area's recuperation from a multiyear droop back to the beginning line.
The decisions accessible to designers, as per Mr. Goyal, were straightforward: auction their expensive inventories at lower winning rates or default on advance reimbursements as there is absence of liquidity on the lookout. This Catch-22 circumstance frames the core of the weight that stock shades present for the land area in India – burdened by Rs 3.7 lakh crore worth of unsold lodging units in the main 7 urban communities.
Be that as it may, auctioning off unsold units won't be as speedy an answer as these assertions will have you accept. Property advisor Jones Lang LaSalle (JLL) has announced that the unsold stock in India will take around 3.3 years to sell, particularly with the interest shock that came about because of pandemic-related confusions.
This carries us to one of the essential difficulties looked by engineers: the more established their stock gets, the more it takes to exchange. This makes an endless loop where, if engineers decide to sit tight for a willing purchaser to pay a property's actual worth, they face the danger of additional deterioration in its worth. Simultaneously, offering potential homebuyers high limits to create the deal can bring about enormous misfortunes for designers.
Yet, stock shades don't simply affect the engineers' benefit; they have other falling impacts too. With the designer's capital restricted in existing ventures that will not sell, any new undertaking dispatch normally gets affected, driving them to slow down their development pipelines. This effects purchaser notion contrarily, as the dread of deferral in projects stops new homebuyers from making an enormous speculation.
This expanding liquidity emergency antagonistically affects the land area, which has stayed frustrated for liquidity for quite a while because of a progression of emergencies and strategy changes like the 2016 banknote demonetization and the 2018 IL&FS emergency. The pandemic has additionally exacerbated this issue.
A basic decrease in costs to animate interest won't address this problem, as it opens designers to Income Tax punishments that outcome from the infringement of the Ready Reckoner Rate (RRR). To address this, Finance Minister Nirmala Sitharaman permitted designers and homebuyers a 10% safe harbor limit beneath the stamp obligation circle rate in Budget 2019-20, which was subsequently expanded to 20% in Budget 2021-22.
Notwithstanding, this is only a brief fix legitimate just till 30 June, 2021. Besides, the protected harbor limit just reaches out to private units worth a limit of Rs 2 crore. The move leaves out the extravagance lodging section that records for a huge lump of this unsold stock – an expected 7,364 units evaluated at Rs 3 crore or more, dispatched as far back as December 2016, that are as yet unsold and devaluing.
Engineers are likewise commanded to pay charges on the unsold stock, in view of their notional rental pay, if the stock is more established than two years. This conveys a one-two punch to land players, particularly in business sectors that order high information and land securing costs. Take the instance of Mumbai, the country's most costly property market, which additionally represents the best lump of its unsold stock. Engineers in Maharashtra pay heavy expenses, demands, and other duties that can represent 33% of the general undertaking cost in the state. Sometimes, expenses can surpass the expense of development. For engineers of such properties, tax assessment on unsold stock and limits for potential homebuyers can together end up being too exorbitant to even consider bearing.
Eventually, unsold stock seatedly affects each partner in the land business, making income interruptions for designers and a stale market for financial backers and likely property holders. Taking into account that land in India is set to represent a heavy 13% of the economy by 2025, stock shades have the capability of affecting the economy, whenever left unaddressed.
Regardless of these difficulties, engineers can take trust from improving homebuyer slant, proven by a sharp uptick in realty deals in the third and fourth quarters of 2020. Moreover, in November 2020, HDFC Bank, the country's biggest home lender, detailed its second-most elevated month to month payment ever. This development popular has been pushed by record-low home advance loan costs, the extending reasonable home market, government drives like the decrease in stamp obligation in Maharashtra, and the developing significance of claiming a home in the wake of the pandemic. The disconnected to online progress of the realty area, combined with engineers' drive to embrace liquid planning standards, is additionally prone to support financial backer assumption.
An accommodative monetary strategy, as kept up with by the Reserve Bank of India, and coming about repo rate cuts are likewise giving a fillip to home advances in the country. The Central Bank's choice to concede term credit and working capital advance installments has likewise assisted with lessening the weight of home and development advances on designers, facilitating their liquidity imperatives. More current speculation roads like Real Estate Investment Trusts are likewise assisting with carrying truly necessary liquidity to engineers.
The public authority has likewise found a way a few ways to support homeownership like giving interest appropriations to center and lower-pay bunches under the Pradhan Mantri Awas Yojana (PMAY). In November 2019, the public authority even declared a Rs 25,000 crore Alternative Investments Fund to carry help to 1,600 slowed down projects, which were assessed to represent 4.58 lakh deficient lodging units. The move demonstrated advantageous for some engineers, and confined conceivable outcomes of misrepresentation because of a severe consistence cost as it was open just to projects that were RERA-enrolled and total assets positive. The public authority can additionally consider allowing the framework status to land and presenting truly necessary estimates like single-window clearances and a supported GST to assist with bringing down engineers' expense of capital. Once again introducing the GST Input Tax Credit will likewise help by bringing down the assessment obligation borne by engineers. The Confederation of Real Estate Developers' Associations of India (CREDAI) has likewise encouraged the public authority to assemble extra institutional financing for engineers through banks and NBFCs.
The onus of overseeing liquidity limitations, notwithstanding, will eventually fall on designers and their capacity to change their techniques. Over the previous year, in the light of the public authority's push to auction existing stock, engineers have offered homebuyers appealing limits, gifts, and adaptable installment intends to drive deals. More modest realty players, who can't give such concessions, can consider tie-ups with bigger designers to finish their activities. Then again, engineers of both private and business activities can likewise offer their business improvements to homegrown or abroad private value assets to acquire liquidity. A few designers even believer their private tasks to business ones to work on their possibilities.
More than request and deals, it is industry overhangs that mirror the genuine strength of the housing market. Perceive how the Delhi-NCR market saw a sharp log jam in costs after 2013 because of melting away financial backer premium and developing stock shade. In any case, around 2018, as unsold stock levels diminished by 15% on the rear of interest restoration of private and business realty in Gurugram, Greater Noida, and Ghaziabad, the housing market in the locale saw a 35% increment in new dispatches. This supported land development as well as set out work and financial freedom.
This, then, at that point, is the financial, business, and social effect that unsold stock has on the housing market. By tending to the problem areas referenced above, industry partners can tackle the 'overhang' issue and open its actual potential. For a nation taking a gander at the land area to lead its post-pandemic resurgence, not making a mediation is presently not an alternative.
https://indianexpress.com/article/india/sc-notices-states-uts-high-courts-section-66a-of-it-act-7434332/
https://www.business-standard.com/article/markets/realty-shares-in-demand-oberoi-prestige-estates-indiabulls-sobha-up-5-121080200316_1.html
https://www.financialexpress.com/money/the-impact-of-unsold-inventory-on-real-estate/2298530/
For more news like this click
https://rrskartikeyaembedded.blogspot.com/
#unsoldinventory#financialexpress#OberoiReality#PrestigeEstatesProjects#IndiabullsRealEstate#Sobha#Brigade Enterprises#Godrej Enterprises#Macrotech#RealEstate#Stocks#Nifty#Nariman#Gavai#66A#MHA#IndianExpress#BusinessStandard
0 notes
Text
reliance shares: RIL no more king, loses crown of top weighted Nifty50 stock
reliance shares: RIL no more king, loses crown of top weighted Nifty50 stock
MUMBAI: The crown of being the most important blue chip stock in India lasted merely eight months for Mukesh Ambani’s Reliance Industries (RIL), and the bluest of blue chip has ceased to be the highest-weighted stock in Nifty50.
The stock’s weightage in the Nifty pack slipped to as low as 9.82 per cent on Monday and stood at 10.08 per cent on Tuesday, which led to the stock losing its top rank to…

View On WordPress
0 notes
Text
RIL no more king, loses crown of top weighted Nifty50 stock
RIL no more king, loses crown of top weighted Nifty50 stock
MUMBAI: The crown of being the most important blue chip stock in India lasted merely eight months for Mukesh Ambani’s Reliance Industries (RIL), and the bluest of blue chip has ceased to be the highest-weighted stock in Nifty50.
The stock’s weightage in the Nifty pack slipped to as low as 9.82 per cent on Monday and stood at 10.08 per cent on Tuesday, which led to the stock losing its top rank to…

View On WordPress
0 notes
Text
How market indices can help you understand investment patterns

Folks, we are excited to start our “Feature Campaign Series”, where we’ll pick the most-loved features of Tickertape and talk about how they can aid your stock-picking and decision-making process. So, whether you have tried your hands on ‘Tickertape’ as yet or not, our Feature articles are sure to give you reasons to make the most of the platform in your investment process :)
First in the series is Tickertape’s Index Pages. This article will throw light on how indices impact investment patterns and how Tickertape’s Index Pages can empower your stock investment.
Overview: stock indices
Stock indices are excellent tools to measure the performance of the overall market, sector or stock. It thus allows you to compare how your favourite stock has performed as against the overall market/specific sector. Read more on indices here.
How indices reveal investment patterns?
Apart from indicating the market performance, a benchmark index also offers other valuable insights that you can apply in your investment process.
Sector and stock comparison: Sector-specific indices allow comparison of the performance of a stock against the entire sector. For instance, Nifty Bank Index not only measures the performance of the banking sector, but also allows comparison of each constituent stock with the index. So, if SBI has generated returns higher than that of Nifty Bank, it means that the stock has outperformed the index.
Peer comparison: Each sector has numerous listed-companies, which makes evaluating stocks individually an impractical process. But since an index represents various underlying stocks, its metrics can be used as a standard to compare those of your favourite stocks.
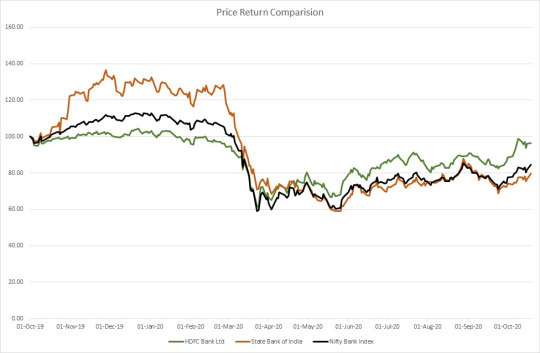
In the above image, you can see that SBI has outperformed the Nifty Bank Index from Oct 2019 to Apr 2020 while HDFC Bank Ltd underperformed. However, the trend reversed starting from May 2020.
Measure the performance of ETFs: Indices are also used to benchmark ETFs and are supposed to closely mimic the performance of the index. Tickertape’s Index Page shows all the ETFs tracking the particular index. Following is an image that shows all the ETFs benchmarked against Nifty100.

Reflection of investor sentiment: When investors are wary of a particular stock/sector, they avoid betting on it, which dampens its demand. Naturally, the price of the stock also tumbles. Conversely, if investors are positive about a stock, its demand and price rise and thus push the index higher. So, by examining a sector-specific benchmark index, you can identify the investor sentiment towards that industry. Next, you can evaluate the stock-specific trends. Tickertape’s Index Page has a ‘Constituents’ tab, which can help you here. More on this later.
Passive investment: Sometimes you may replicate your portfolio to match the constituent stocks of a benchmark index and the weights assigned to them. For the uninitiated, this is called passive investment and such as a portfolio generates returns similar to the index. For instance, if your portfolio replicates Nifty50 whose returns have been 10% in the last 12 months, then your investments would also generate similar returns.
The highlights of Tickertape’s index pages
Tickertape's Index Pages is clean, neat and more importantly, a trove of useful information about the index. Following are the highlights of Tickertape’s Index Pages and how they can power your investments.
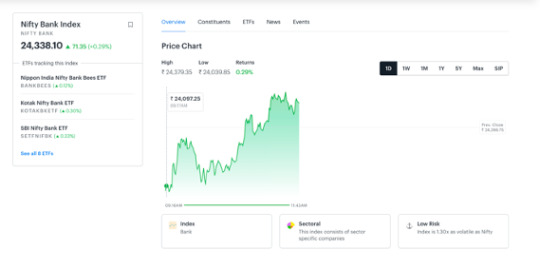
Let us first launch the Nifty Bank Index Page for our example. Go to www.tickertape.in and look for your Nifty Bank Index in the search box. As you can see, the index page has various tabs, as follows.
Overview tab
The ‘Overview’ tab of the index page:
Displays a price chart for various periods
Suggests how risky the index is and
Offers sectoral details
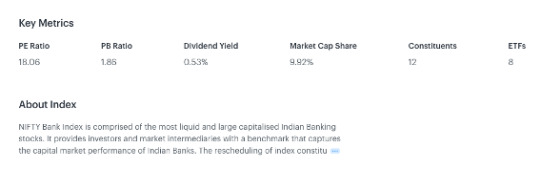
Further down, the index page also displays key metrics such as PE ratio, ETFs benchmarked against the index, and its constituents too. This helps you compare the returns of an asset class with that of the index.
Constituents tab
What stands out in Tickertape’s Index Page is its ‘Constituents’ tab, which shows all the stocks included in building the index. You can sort the stocks in the index in two ways:
By market cap
By sector
In the first case, you can see basic details such as:
The constituent stocks of the index
Their 1D % change
The weightage assigned to them and
Their free float market cap
You can also find deeper insights about the extent of influence each stock has had on the change in the index value. To learn this, look at the ‘Return attribution’ column for each stock.
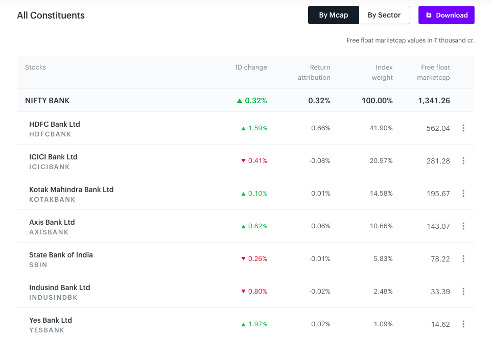
In the image above, you can see that the Nifty Bank has risen 0.32% in a day. When you study the constituents and the ‘Return attribution’ column together, you can see that HDFC Bank has contributed the most in Nifty Bank’s gain while ICICI Bank Ltd has been the top laggard.
The second option to sort constituents based on the sector gives you deeper insights into the return attribution of both the underlying sector and stocks of the index. Here’s a snapshot illustrating the same.
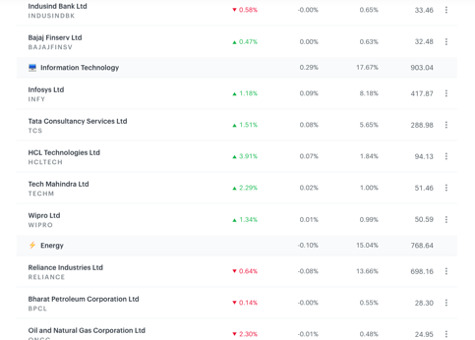
When studying Nifty50, the return attribution column shows the % change caused by each constituent sector and stocks in the Nifty 50’s value. While IT has contributed 0.29% change in the index, the Energy sector has dragged the index by 0.10%. Isn’t that a cool feature to analyse stocks benchmarked against an index? What’s more, Tickertape also lets you download this information for your reference.
News and Corporate Actions
These tabs offer information on:
Latest news and corporate actions (such as dividend declared) taken by individual stocks of the index
ETFs that are benchmarked against the index
There, you have it all! Use Tickertape to experience the simplicity and power of making informed investment decisions! Let us know how you like the feature. Visit Blog by Tickertape to stay updated on what’s happening in the market and economy.
0 notes
Link
Benchmark indices were ruling nearly 2 per cent higher in Friday's noon deals, on the back of across-the-board gains.
The S&P BSE Sensex rose 650 points to 37,200 levels, and the Nifty50 index was testing the 11,000-mark. HCL Tech (up 5%) was the top Sensex gainer, followed by Bharti Airtel (4%), TCS and Tech Mahindra (both up 3%).
All the Nifty sectoral indices were trading in the green, led by Nifty IT and FMCG indexes, both up 1 per cent, each.
In the broader market, the S&P BSE MidCap and SmallCap indexes were also trading 1 per cent higher, each.aCATCH ALL THE LIVE UPDATESAuto Refresh01:15 PM European indices sluggish at open
01:14 PM Bihar Elections 2020 :: Results on Nov 10>> Phase 1: Oct 28
>> Phase 2: Nov 3
>> Phase 3: Nov 701:13 PM Bihar Elections 2020 :: Bihar polls in three phases from Oct 28>> Maximum number of electors at one polling station reduced to 1000 from 1500
>> Polling time has been increased by an hour (7 am to 6 pm)01:10 PM Even as Covid-19 rages, Indian economy's animal spirits are stabilisingFive of the eight high-frequency indicators compiled by Bloomberg News gained last month, while two were unchanged and one deteriorated. That kept the needle on a dial measuring so-called animal spirits steady at 4 -- a level arrived at by using the three-month weighted average to smooth out volatility in the single-month readings. READ MORE
01:01 PM NEWS ALERT :: RBI grants in-principle nod to set-up and operate Bharat Bill Payment Operating Unit to VakrangeeClick here for details
12:57 PM ICICI Securities on Suven PharmaSuven Pharma has turned ex-bonus from September 25, 2020, pursuant to the board approval granted for the issue of bonus shares in its meeting held on September 16, 2020. The record date for the same has been fixed as September 28, 2020. The board has recommended the issue of bonus shares in proportion of one bonus share (face value of Re 1 each) for every equity share held (i.e. 1:1). Consequently, the share price has changed to Rs 369/share from Rs 738/share. Accordingly, our target price has also been revised to Rs 385/share from Rs 770/share earlier. After the recent run-up, the stock offers limited upside from here on. We change the recommendation from BUY to HOLD. Our target price is based on 22x FY22E EPS (revised) of Rs 17.5. We will revisit the target price for a possible change in the next update.
12:52 PM Zydus Cadila gets USFDA nod for multiple sclerosis treatment drugZydus Cadila has received final approval from the United States Food and Drug Administration (USFDA) to market Dimethyl Fumarate delayed release capsules, (Tecfidera)in the strengths of 120 mg and 240 mg, Zydus Cadila, part of Cadila Healthcare group, said in a regulatory filing. READ MORE
12:43 PM Granules India up 5% on USFDA approval for generic Aleve PM tabletsShares of Granules India gained 5 per cent at Rs 377 on the BSE on Friday after US health regulator USFDA gave its approval for Naproxen Sodium and Diphenhydramine Hydrochloride Tablets, 220 mg/25 mg (OTC). The company today announced that the US Food & Drug Administration (US FDA) has approved its Abbreviated New Drug Application (ANDA) for Naproxen Sodium and Diphenhydramine Hydrochloride Tablets, 220 mg/25 mg (OTC), generic equivalent of Aleve PM Tablets, 220 mg/25 mg, of Bayer HealthCare LLC. READ MOREpharmacy, drugs, medicine, pharma companies, pharmaceuticals, vaccine, coronavirus, covid, testing
12:37 PM BROKERAGE VIEW | Emkay Global on Indian IT sectorWe see a limited read-through from Accenture's results for Indian technology companies in general due to business mix differences (Indian peers’ exposure to the Consulting business is much lower than that of ~55% for ACN). ACN's Q4 performance and guidance came lower than expectations largely due to the weakness inConsulting. Sustained healthy momentum in outsourcing business revenue and booking augurs well for Indian peers. Nifty IT index gained ~30%/~60%/~20% in last 3M/6M/CYTD and current valuations largely capture the improving demand environment, in our view. Uncertainties around the outcome of US elections, healthcare crisis and slowing global growth will keep the optimism in check and may weigh on stocks.12:29 PM Wrong idea in market that we are not professionally run: Top UTI AMC execThirteen years after it was first mooted, UTI AMC is set to hit the market with an initial public offering of Rs 2,160 crore that will enable its five shareholders to offload 30.75 per cent, valuing the AMC at over Rs 7,000 crore. READ MORE
0 notes
Text
Market Erases Morning Loss, Stocks Move Higher

Share
markets benchmark indices opened in the negative zone on Thursday, as
selling pressure seen in heavy weight companies such as Infosys,
ICICI Bank and TCS.
During
Mid-morning session, the index moved progressively higher with the
BSE Sensex trading at 39169-levels up 138pts and the Nifty50 was up
33pts at 11,781.
Yes
Bank, Bharti Infratel, Bharti Airtel, Hero Moto Corp and Bajaj
Finance were among top gainers, while Tata Motors, NTPC, Infosys,
Hindalco, ICICI Bank among top losers on the NSE.
Maruti
Suzuki stock declined Rs.13.40 in the morning trade after the Auto
Company reported muted sales numbers for the month ended April 2019.
Total domestic sales fell by 19pc at 1,33,704 units in April 2019.
Britannia
Industries posted strong set of fourth quarter numbers with revenue
meeting markets estimates. In the opening hours Britannia shares
gained upto 1-pc, however, the stock currently trade flat, falling
0.07% at Rs2894 per share.
On the Nifty sectoral space, Nifty Metal and IT were under pressure, while Nifty PSU Bank index were leading with 1.18 percent gains.
Free Intraday Trading tips, MCX Free Tips, Commodity tips and Stock Tips
Read the full article
0 notes
Text
Ambanization of Nifty50 !! Nifty Calculator
Ambanization of Nifty50 !! Nifty Calculator
Government will find it difficult to raise 2 lakh crores through Privatization but Mukesh Ambani of Reliance has raised that number in the lockdown.
Reliance is now 14% of Nifty50 .
Interesting Observations
Top 20 Stocks are 79.26% of the Index. Lower than the peak of 80.4% .
Top 10 Stocks are 62.6% of the Index. All time High Concentration.
Banking and Financials continues to see weight drop…
View On WordPress
0 notes
Text
Motilal Oswal S&P 500 Index Fund NFO – Should you invest?
Motilal Oswal S&P 500 index fund NFO is launching today for subscription. There is a huge noise around this fund. The reason is that this is an Index Fund and it is INTERNATIONAL Fund. But should you invest?
In India, Index Funds are gaining popularity and I am also one among them to recommend to all my clients. In fact, I already have written my recommendation on my yearly article about my fund choices at “Top 10 Best SIP Mutual Funds to invest in India in 2020“.
There was a huge demand for an international fund in India. Because we all wish to have our investment diversified across the globe also. Hence, considering this trend, Motilal Oswal launching the new fund offer which will track the oldest Index S&P 500 Index.
Motilal Oswal S&P 500 index fund is an index fund that invests in the companies that are part of the S&P 500 Index (US) in the same weightage as in the index. The objective of this fund is to seek investment return corresponds to (before fees & expenses) the performance of the S&P 500 Index (US), subject to tracking error.
What is S&P 500 Index?
Before discussing about this fund, let us first understand the S&P 500 Index.
It was created in 1957, the index is one of the oldest indexes with over a 60-year live track record. The S&P 500 was the first US market-cap-weighted stock market index. Today, it’s the basis of many listed and over-the-counter investment instruments.
The S&P 500 is a proxy for the US equity market, and it is the only stock market benchmark serving as an economic indicator in The Conference Board Leading Economic Index. It has stood for US stock market performance in that context since 1968.
The S&P 500® index includes 500 leading companies that are diversified across all 11 Sectors. The index covers approximately 82% of available market capitalization that are listed on US Stock Exchanges.
The index is regarded as the best single gauge of large-cap US equities. There is over USD 9.9 trillion indexed or benchmarked to the index, with indexed assets comprising approximately USD 3.4 trillion of this total making it the largest and most widely traded index in the world. For more information on the S&P 500 Index (click here).
The current top holdings of the Index are as below.
Microsoft Corp5.0%Information TechnologyApple Inc.4.7%Information TechnologyAmazon.com Inc3.2%Consumer DiscretionaryFacebook Inc A1.9%Communication ServicesBerkshire Hathaway B1.6%FinancialsAlphabet Inc A1.6%Communication ServicesAlphabet Inc C1.6%Communication ServicesJP Morgan Chase & Co1.5%FinancialsJohnson & Johnson1.4%Health CareVisa Inc A1.3%Information Technology
This much understanding about S&P 500 Index.
What is Motilal Oswal S&P 500 Index Fund?
Motilal Oswal S&P 500 index fund is an index fund that invests in the companies that are part of the S&P 500 Index (US) in the same weightage as in the index. The objective of this fund is to seek investment return corresponds to (before fees & expenses) the performance of the S&P 500 Index (US), subject to tracking error.
What is an Index Fund?
An index fund is a type of mutual fund which constructs its portfolio by tracking the composition of a standard market index such as the Nifty 50 or the Sensex. The fund not only invests in stocks that constitute the benchmark index but also the same proportion.
For example – a rise of 1% in the index will lead to a 1% increase in the fund and vice versa. There are numerous indexes (Nifty50, Nifty 500, Nifty Smallcap 150) and many others.
Index Funds are popular mainly for the below reasons:-
Low expense
For long term Index Funds obviously a better choice.
No mad rush to search for BEST Mutual Fund.
Alpha and beta are two of the most important concepts in investing in mutual funds.
Beta represents market returns or benchmark returns. This index funds are built to deliver beta (market) returns.
Alpha represents the return in excess of beta returns. For example if the market/benchmark delivers 8% whereas a fund manager delivers 10%, alpha is 2%.
Every fund manager’s goal is to provide alpha. If he/she fails to deliver alpha, then investors are better off investing in beta products (index funds).
The above points are shared from the Motilal Oswal S&P 500 index fund details. I don’t want to into all those questions or in detail about SID.
Motilal Oswal S&P 500 Index Fund NFO – Should you invest?
Let us now discuss on the main aspect of this post. Should we invest in Motilal Oswal S&P Index Fund NFO?
International LOVE:-
Many of us have a tendency to diversify our investment INTERNATIONALLY. Also, many are running behind this NFO just because it is investing in the US market.
Sadly for many of these investors, INTERNATIONAL=USA. They are unable to understand the basics of investment that even if you NEED international exposure, it should not be a particular country-specific. By investing in USA based funds, are you not creating a concentrated risk in your portfolio?
Many have reason to invest in this particular fund by quoting John Bogle as he is the founder and major force to accept that Index Funds are BEST.
His simple Five-Fund Portfolio is as below:-
Large Cap-50%, Mid Cap-10%, Small Cap-20%, Sector specific-10% and International-10%. However, he again stress and share what is meant by International Fund.
I am quoting what John Bogle said in his famous book “Common Sense on Mutual Funds”.
“While I talked about international as a single asset class, I now believe it has two distinct components: developed markets (Britain, Germany, France, etc.) and emerging markets (Singapore, China, India, Brazil, etc.). In this increasingly globalized economy, I see little reason to invest heavily in the former group and would prefer to emphasize the latter (with its smaller but more rapidly growing base, and of course its higher risk). But I’d still limit the international componenet of the portfolio to no more than 20 percent of the equity position”.
It is now relevant that International does not mean one particular country. It should be in multiple countries to diversify your international exposure.
If we look into this aspect, I never consider this particular fund as my international fund. Because it is country-specific. Hence, don’t believe that by investing in this fund, you are DIVERSIFYING your equity exposure.
Taxation of Motilal Oswal S&P 500 Index Fund
When adopt index investing the primary reason is cost. Whether the cost is because of TER (Total Expense Ratio) or because of tax.
If we consider Motilal Oswal S&P 500 index fund, it is treated for us (Indian investors) as a debt fund. Hence, if your holding period is within 3 years, then the taxation is as per your tax slab (Add a surcharge to it). Suppose you are under 30% tax bracket, then you have to pay the 30% tax on such gain.
However, if you hold it for more than 3 years, then the tax will be 20% with indexation (Add surcharge).
This is a huge differentiator for Indian investors when it comes to the cost of investing. If you are investing in the Indian Index Fund (ETF or Index Mutual Funds), the taxation is as per the current equity taxation rules.
However, if opted this fund, because of your taxation, you may end up in adding more expenses in the form of tax.
Expense Ratio
As per Motilal Oswal claim it is mentioned that it is currently at 0.5%. Even if we consider this as our real and forever expense ratio, then it still costly compared to other Index Funds in India (I am concentrating on Large Cap Index Funds and ETFs).
Do remember that this TER will not permanent. Because we know from past experience that how abruptly Indian Mutual Fund Companies change the TER (within SEBI regulation). Hence, I do not jump into this fund just because the current expense ratio is mentioned as 0.5% (for direct funds).
Tracking Error
When we discuss the Index Fund, the utmost important aspect we have to look for is Tracking Error. The product one-pager mentions this line “Return that corresponds to the performance of S&P 500 Index subject to tracking error”.
Because the fund’s tracking error is utmost important when are choosing the Index Fund.
I will again copy paste the same wordings what they defined in their SID “The Fund Manager would not be able to invest the entire corpus exactly in the same proportion as in the underlying index due to certain factors such as the fees and expenses of the Scheme, corporate actions, cash balance and changes to the underlying index and regulatory restrictions, lack of liquidity which may result in Tracking Error. Hence it may affect AMC’s ability to achieve close correlation with the underlying index of the Scheme. The Scheme’s returns may, therefore, deviate from its underlying index. “Tracking Error” is defined as the standard deviation of the difference between daily returns of the underlying index and the NAV of the Scheme. The Fund Manager would monitor the Tracking Error of the Scheme on an ongoing basis and would seek to minimize the Tracking Error to the maximum extent possible. There can be no assurance
or guarantee that the Scheme will achieve any particular level of Tracking Error relative to the performance of the Underlying Index.”
Tracking error plays an important role while investing in Index Funds. However, we can’t judge this tracking error at the NFO level.
# Size of the Fund
When we invest in Index Funds, the size of the fund also matters to us. Usually, higher the AUM the better for the fund manager to manage the sudden redemption or investment by investors. Hence, even though we don’t have any other such kind of fund, I don’t think we need to just jump into this fund for the sake of our INTERNATIONAL LOVE.
Conclusion:-As I pointed above, for me International means not to a single country-specific. Also, it is premature to judge the fund performance (even though it is an Index Fund) at the NFO level. Hence, I suggest you wait and watch the game rather than BLINDLY jumping into FANCY. I am not discussing here how much should be our international exposure. I am satisfied with my low expensive Indian Index Funds rather than high cost and high taxed international funds.
Read our latest posts:-
Top 5 Best Online Term Insurance Plans in India 2020
Motilal Oswal S&P 500 Index Fund NFO – Should you invest?
Sovereign Gold Bond Scheme FY 2020-21 – A complete calendar
FY 2019-20 deposit in PPF and SSY extended up to 30th June 2020
EPF Subscriber – Govt credit 3 months contribution to EPF account
Sec.194K – TDS on Mutual Fund Income – How to avoid TDS?
The post Motilal Oswal S&P 500 Index Fund NFO – Should you invest? appeared first on BasuNivesh.
Motilal Oswal S&P 500 Index Fund NFO – Should you invest? published first on https://mbploans.tumblr.com/
0 notes
Text
Market Talk - July 27, 2022

ASIA:
Singapore’s sovereign wealth fund GIC reported steady returns for the year but warned of “deep uncertainties” as investors face concerns over inflation, pandemic risks and geopolitical challenges. The fund’s portfolio posted an annualized nominal dollar return of 7% over the 20-year period ending March 31, 2022, GIC said in its annual report released on Wednesday. GIC – a private firm wholly owned by the Singapore government – manages Singapore’s reserves together with the Monetary Authority of Singapore and state investor Temasek Holdings. The fund said the shift to a higher inflation environment will have significant investment implications.
The major Asian stock markets had a mixed day today:
- NIKKEI 225 increased 60.54 points or 0.22% to 27,715.75
- Shanghai decreased 1.68 points or -0.05% to 3,275.76
- Hang Seng decreased 235.84 points or -1.13% to 20,670.04
- ASX 200 increased 15.90 points or 0.23% to 6,823.20
- Kospi increased 2.57 points or 0.11% to 2,415.53
- SENSEX increased 547.83 points or 0.99% to 55,816.32
- Nifty50 increased 157.95 points or 0.96% to 16,641.80
The major Asian currency markets had a mixed day today:
- AUDUSD decreased 0.00225 or -0.32% to 0.69275
- NZDUSD decreased 0.00288 or -0.46% to 0.62042
- USDJPY increased 0.319 or 0.23% to 137.284
- USDCNY decreased 0.00509 or -0.08% to 6.76101
Precious Metals:
l Gold increased 3.90 USD/t oz. or 0.23% to 1,717.54
l Silver increased 0.066 USD/t. oz or 0.35% to 18.659
Some economic news from last night:
China:
Chinese Industrial profit (YoY) (Jun) increased from -6.50% to 0.80%
Chinese Industrial profit YTD (Jun) remain the same at 1.0%
South Korea:
Consumer Confidence (Jul) decreased from 96.4 to 86.0
Australia:
CPI (QoQ) (Q2) decreased from 2.1% to 1.8%
CPI (YoY) (Q2) increased from 5.1% to 6.1%
CPI Index Number (Q2) increased from 123.90 to 126.10
Trimmed Mean CPI (QoQ) (Q2) increased from 1.4% to 1.5%
Trimmed Mean CPI (YoY) (Q2) increased from 3.7% to 4.9%
Weighted mean CPI (YoY) (Q2) increased from 3.2% to 4.2%
Weighted mean CPI (QoQ) (Q2) increased from 1.0% to 1.4%
Some economic news from today:
Japan:
Coincident Indicator (MoM) decreased from 0.0% to -1.9%
Leading Index (MoM) decreased from 2.1% to -1.7%
Leading Index decreased from 102.9 to 101.2
EUROPE/EMEA:
The International Monetary Fund has warned that Britain has the slowest growth of the richest G7 economies next year. It predicts UK growth will fall to just 0.5% in 2023, much lower than the 1.2% forecast in April. The IMF cut its global growth forecast for 2022 to just 3.2% and warned that the slowdown could be even more severe. It said fast-rising prices are to blame for much of the slowdown, with households and businesses squeezed by a combination of higher prices and higher borrowing costs as policymakers raise interest rates to try to counter inflation. The probability of a recession in the G7 economies – Canada, France, Germany, Italy, Japan, the US, and the UK – is now around 15% – almost four times higher than usual.
Spain has raised its inflation forecasts for 2022 and 2023 and lowered its economic growth target for 2023, Economy Minister Nadia Calvino said on Tuesday, citing the war in Ukraine for its continued negative impact on European economies. The inflation target was raised to 7.8% in 2022 from the previous 6.1% planned in April, while for 2023 it was revised upwards to 2.9% from 2.2%. Annual inflation in Spain topped 10% for the first time in 37 years in June, driven by rising energy and food prices, prompting the government to raise its expectations for consumer prices. The country’s statistics office is due to release second-quarter GDP growth later this week. The International Monetary Fund also revised its growth forecast for Spain to 4% in 2022 from 4.8%. The IMF expects two percent growth in 2023.
The major Europe stock markets had a green day:
- CAC 40 increased 46.49 points or 0.75% to 6,257.94
- FTSE 100 increased 41.95 points or 0.57% to 7,348.23
- DAX 30 increased 69.45 points or 0.53% to 13,166.38
The major Europe currency markets had a green day today:
- EURUSD increased 0.00031 or 0.03% to 1.01333
- GBPUSD increased 0.00201 or 0.17% to 1.20565
- USDCHF increased 0.00157 or 0.16% to 0.96417
Some economic news from Europe today:
Germany:
GfK German Consumer Climate (Aug) decreased from -27.7 to -30.6
France:
French Consumer Confidence (Jul) decreased from 82 to 80
Italy:
Italian Business Confidence (Jul) decreased from 109.5 to 106.7
Italian Consumer Confidence (Jul) decreased from 98.3 to 94.8
Swiss:
ZEW Expectations (Jul) increased from -72.7 to -57.2
Euro Zone:
M3 Money Supply (YoY) (Jun) increased from 5.6% to 5.7%
Loans to Non Financial Corporations (Jun) increased from 5.8% to 6.8%
Private Sector Loans (YoY) remain the same at 4.6%
US/AMERICAS:
The Federal Reserve has raised rated by 75 bps (2.25%-2.5%) for the consecutive meeting in an effort to fight inflation. Recent indicators of spending and production have softened,” the statement began, changed from last month’s statement opener of an optimistic tone stating economic activity was picking up. The central bank noted in this month report that there is a dramatic increase in food prices, whereas only energy was mentioned previously. All members unanimously approved the rate hike.
The Fed’s balance sheet continues to lighten at a moderate pace. The total has declined $16 billion since it began reducing holdings of its $9 trillion balance sheet. The current cap stands at $47.5 billion but is expected to rise to $95 billion per month by September. The Federal Open Market Committee will not meet again until September. However, they will gather at the annual retreat this August in Jackson Hole.
US Market Closings:
- Dow advanced by 434.46 points or 1.37% to 32,196.00
- S&P 500 advanced 102.27 points or 2.61% to 4,023.32
- Nasdaq advanced 469.85 points or 4.06% to 12,032.42
- Russell 2000 advanced 43.09 points or 2.39% to 1,848.34
Canada Market Closings:
- TSX Composite advanced 281.88 points or 1.49% to 19,254.56
- TSX 60 advanced 16.83 points or 1.47% to 1,165.43
Brazil Market Closing:
- Bovespa advanced 1,666.27 points or 1.67% to 101,437.96
ENERGY:
The oil markets had a mixed day today:
- Crude Oil increased 2.78 USD/BBL or 2.93% to 97.715
- Brent increased 2.35 USD/BBL or 2.25% to 106.887
- Natural gas decreased 0.299 USD/MMBtu or -3.32% to 8.7068
- Gasoline increased 0.0538 USD/GAL or 1.60% to 3.4040
- Heating oil increased 0.1185 USD/GAL or 3.31% to 3.6991
The above data was collected around 13:55 EST on Wednesday
- Top commodity gainers: Soybeans (2.98%), Heating Oil(3.31%), Crude Oil (2.93%) and Orange Juice (5.65%)
- Top commodity losers: Cocoa (-2.12%), Wheat (-1.90%), Lumber (-1.98%) and Natural Gas (-3.32%)
The above data was collected around 14:02 EST on Wednesday.
BONDS:
Japan 0.203%(-0.1bp), US 2’s 3.06% (+0.020%), US 10’s 2.7685% (-1.85bps); US 30’s 3.01% (+0.0001%), Bunds 0.9430% (+1.5bp), France 1.5370% (+1.2bp), Italy 3.426% (+8.5bp), Turkey 17.37% (+64bp), Greece 3.036% (+6.2bp), Portugal 2.107% (+6.1bp); Spain 2.185% (+6.7bp) and UK Gilts 1.9600% (+4.2bp).
Original Article
Original Article Here:
Read the full article
0 notes
Link
NEW DELHI: Nifty50’s share in mutual fund and foreign portfolio investor (FPI) holdings has not hit historical highs yet, suggesting that the market still has a lot of steam left.But the polarisation within the Nifty pack suggests the time is ripe to go for some rebalancing and bet on the underdogs.Institutional money has of late moved mostly to the top 10 index heavyweights, which is higher than historical trends, amid scarce earning growth and anxiety over election outcome. It is a defensive tactic, suggesting that money managers were positioning for a weaker market.In the past, such moves were followed by the underperformance of heavyweights and the outperformance of lowest-weighted Nifty stocks after the dust settled. “Incremental allocations can keep moving into Nifty names, excluding the top-10 stocks. This makes the bottom 30 Nifty stocks the most lucrative place to be in. The weight of top 10 stocks has reached a historic extreme. The consistent underperformance by funds has made them chase top heavyweights,” brokerage Elara Capital said in a note. 69406854 “Such points of polarisation have been visible in the past when market participants were concerned about economic growth and ended up moving a big portion of their money into a few heavyweight names. After election results, we could see the trend reversal in favour of the bottom 30 Nifty names,” the brokerage said.HDFC Bank, Reliance Industries, HDFC, Infosys, ICICI Bank, ITC, TCS, Kotak Mahindra Bank, Larsen & Toubro and Axis Bank are top 10 Nifty50 stocks with highest weightage. Except for 2007, allocations to top 10 Nifty stocks have always peaked out at 58-59 per cent. They stood at 60 per cent at April-end. 69406872 Amid strong domestic SIP inflows and growth concerns, incremental money hid in fewer stocks. The portfolio being used to hide has hit the wall now, Elara Capital said.Foreign brokerage UBS has raised questions over this rising polarisation within the Nifty pack.The earnings trajectory has lagged other emerging markets materially, UBS said, adding that the broader market and midcaps have continued to struggle. “The top 10 stocks drove 75 per cent of Nifty's return since low hit on February 19. This suggests there remains some anxiety over the election outcome as well as possibly fundamentals,” it said.Elara said the process of moving from polarisation to depolarisation may take some time, but being in a crowded portfolio at this time when the whole market has already started moving may be a risky strategy.Money may move to top 100In the case of the broader market, say NSE500 index, the polarisation of weightage may continue for more time as the curves are still below the top zone, the brokerage said.“The tail stocks in NSE500 index will continue to lose relevance for a fund manager and shifting of allocations can continue to happen in the top 100 names in Nifty500,” it said.Elara said Nifty50 has always entered begun a strong rally after such polarisations, 2005, 2007, 2009 and 2013 being the recent cases.In the case of negative events too, the selloff may not be very large as most portfolios are already positioned for a weaker market. “Once the tide turns, we could see broadening within the Nifty,” it said.
from Economic Times http://bit.ly/2Wc7RQd
0 notes
Text
Tough times ahead? Stay away from midcaps; Nifty could retest 10,200 levels
We feel that the same sentiment will translate onto the heavyweights within the index and that would bring down the Nifty50 as well in coming weeks, says Pushkaraj Sham Kanitkar, AVP - Technical Research at GEPL Capital.
Both MACD and the RSI has been showing divergence indicating a severe fatigue at higher levels. Chances are that this would lead to a deeper correction all the way back to the 10,200-9,950 mark with the intermediate supports placed at 10,500, Pushkaraj Sham Kanitkar, AVP - Technical Research at GEPL Capital, said in an exclusive interview with Moneycontrol’s Kshitij Anand.
Q: The Nifty50 slipped nearly 2 percent for the week ended May 18. It broke below crucial support levels on charts. Do you think we are headed lower in May series?
A: Yes, certainly. The Nifty50 is largely holding fort given the strength in some of the heavyweights like HUL, ITC, HDFC Bank, HDFC Ltd etc.
The broader markets, as well as the low weights in Nifty50, are already in the docks. We feel that the same sentiment will translate onto the heavyweights within the index and that would bring down the Nifty50 as well in coming weeks.
Q: MACD gave a sell signal on the daily charts on Thursday for the first time since March. What are its implications?
A: Not just the MACD, the RSI too, has been showing divergence indicating a severe fatigue at higher levels. Chances are that this would lead to a deeper correction all the way back to the 10,200-9,950 mark with the intermediate supports placed at 10,500.
Q: Plenty of stocks hit fresh 52-week lows this week instead of 52-week high. Do you think these are stocks which are carrying the momentum and investors should ideally book profits or stay away from them?
A: We would still advise to HOLD onto the winners (read 52-week highs) and the flip side it’s a strict no for the losers as well.
Q: What is your call on smallcap and midcap stocks? Should investors stay away or just book profits on rallies?
A: The midcaps have remained underperformers on both sides of the current move. They corrected to a greater extent between Jan-Mar 2018 and moved higher with less force in the current up move.
Midcaps have cracked more than 6 percent in the last 3 weeks, compared to an up move of around 0.5 percent in the benchmark Nifty. The underperformance of MIDCAPS is here to stay and hence a strict no for midcaps for now.
Q: What is your call on crude for the coming week?
A: It would tend to remain bullish till the point the Brent doesn’t fall below the USD 72 mark, which just touched the USD80 mark in Thursday’s trading session.
The spread between Brent & Sweet Crude Oil is currently placed at USD 8, which is on the higher side of the band which indicates that the rally in Crude Oil is here to sustain for the time being.
Q: Top 3-5 positional calls which could give handsome returns to investors in next 1 month?
A: Here is a list of top three stocks for the coming week:
TCS: Buy| Target: Rs 3,900| Stop loss: Rs 3250| Return potential 11%
TCS witnessed a breakout in the calendar year 2018 but started consolidating between 2,750-3,250 levels in the month of May.
There is the absorption of heavy volumes during this period (including the stake sale by the promoters). TCS formed and witnessed a breakout from the Cup & Handle pattern above Rs 3,300.
A breakout from the pattern projects a pattern completion targets around Rs 3,850-3,900 with just one condition that it should trade above Rs 3,250.
Kotak Mahindra Bank: Buy| Target: Rs 1360| Return potential 5%
A breakout from a 6-month consolidation occurred in the second week of April as prices climbed above the all-time high placed at Rs 1,110. A breakout from the consolidation spaced between levels of Rs 950-1,110 projects to extrapolated targets around the Rs 1,360 mark.
The consolidation was accompanied by a good rise in “delivered quantity”, which is an indication of genuine long-term buying in the scrip.
IndusInd Bank: Buy| Target: Rs 2,100| Return potential 8%
The stock is in a rational uptrend that started with a move above the 200-DMA placed at Rs 1,750. This move gathered further strength when the stock moved above the parallel channel placed at Rs 1,800 levels. This up move projects targets placed around Rs 2,100 levels.
Capital Ways Investment Adviser
605, Industry House , AB road Indore (MP) 452001
[email protected]
Contact Us: 08517810864
https://www.capitalways.com/
0 notes
Text
A Top/Down Analysis of Global Markets: Stocks, Commodities, Forex & Rates
This weekend was one of the most amazing professional experiences of my life. I’m fortunate that I have friends who are really smart and willing to give up some of their time on a Saturday to share their knowledge and wisdom with investors all over the world. The turn out for Chart Summit exceeded all expectations and the feedback has been tremendous. This week, videos of all the presentations will be sent out to anyone and everyone who registered for the event www.chartsummit.com
As an added bonus to this amazing event, I wanted to walk everyone through my top/down approach to markets. From my perspective, unless you include global stock markets, commodities, forex and interest rates into your analysis, you’re really selling yourself short. It’s 2017. Even if you just trade or invest in U.S. stocks, taking a global intermarket approach to the marketplace is extremely beneficial. This is with respect to both idea generation and risk management. In addition, we first want to take a long-term view to get structural perspective and then look at daily charts showing just the past year for more short-term tactical opportunities. This process of using multiple timeframes can be seen throughout every asset class we analyze, whether it’s individual stocks like $AAPL, sectors like $GDX, currencies like the US Dollar, commodities like Crude Oil or indexes like the S&P500.
Step 1 of this process is to go around the world looking at every single major stock market. This list includes, all U.S. Indexes like the S&P500, Dow Jones Industrial Average, Russell2000, Euro Stoxx 50, London FTSE 100, Japan Nikkei 225, Belgium 20, China Shanghai, and the list goes on and on. I’ve taken the weight of the evidence here to conclude that stocks as an asset class are in an uptrend. Click to see the list of all the US Indexes and entire list of International Indexes index in my Chartbook. These are a few of the charts the led me to this structurally bullish conclusion:
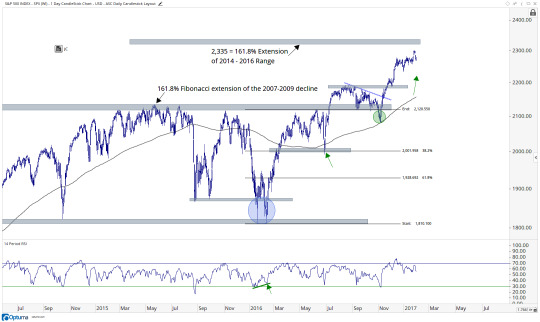
First, here is the S&P500. We have been long and pounding the table bullish since early July. Our target of 2335 still has not been hit, but the series of higher highs and higher lows gives me little reason to change our approach:
Click on Charts To Zoom In
S&P 500
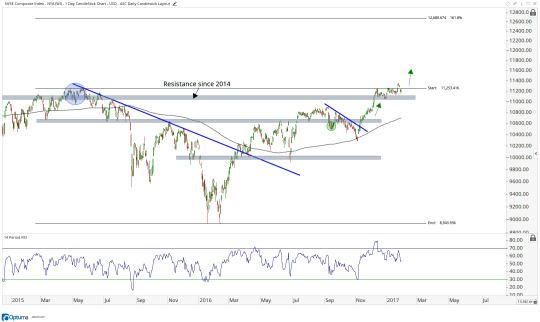
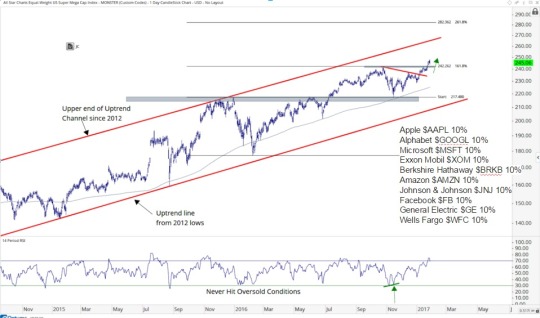
The NYSE Composite holdings above the 2015 highs is another feather in the hat for the bulls. Remember that this market-cap weighted index has much more international exposure than the other US-based Indexes. Over half of the largest 100 companies in the NYSE Composite are foreign stocks. The longer we remain above 11,000 the more constructive this becomes. The path of least resistance here is still higher:
NYSE Composite
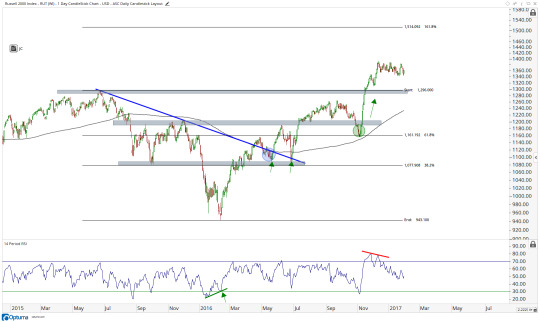
Looking at some smaller-cap companies, here is the Russell2000. I still see a breakout above the 2015 highs and a sideways consolidation digesting those gains. Our bullish approach still seems appropriate. We want to be buying weakness in this index with a target above 1500:
Russell 2000
Here is an index I created with the top 10 largest stocks in America. I call this the All Star Charts Super-Mega Cap Index and is equally weighted. A breakout to all-time highs here is not bearish:
Super-Mega Cap Index
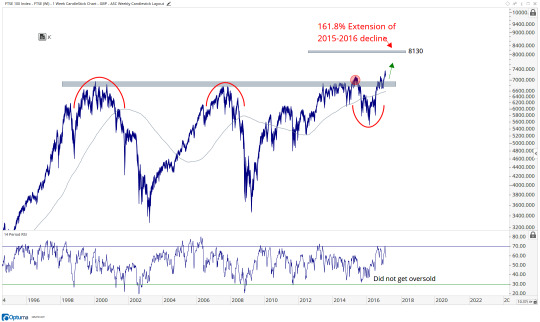
Looking more Internationally, if the London FTSE 100 is breaking out of a 17-year base to all-time highs, it’s hard for me to be bearish stocks as an asset class. This has to be one of the top 5 most important stock indexes on earth, maybe even top 3. How can I possibly look at this is anything less than constructive?
London FTSE 100
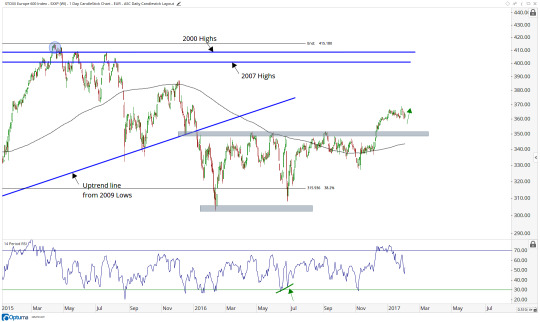
Europe still looks like it is breaking out from a year long base and we want to be buyers of any weakness. I think we see 400 in this Index soon:
Euro Stoxx 600
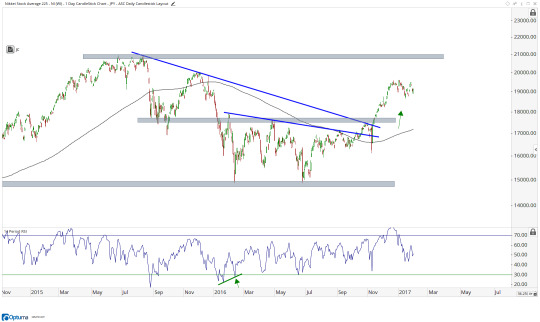
Japan looks like an eerily similar breakout doesn’t it? 21,000 is still our target.
Nikkei 225
These are not downtrend folks.
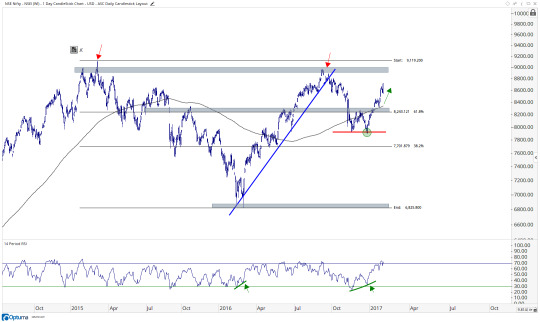
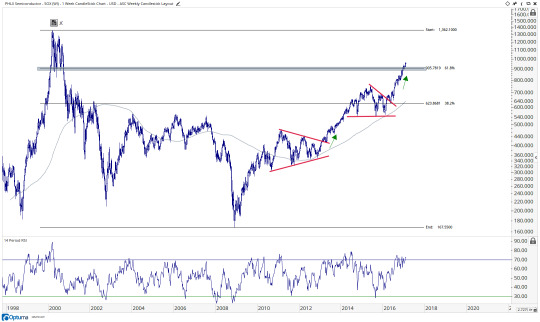
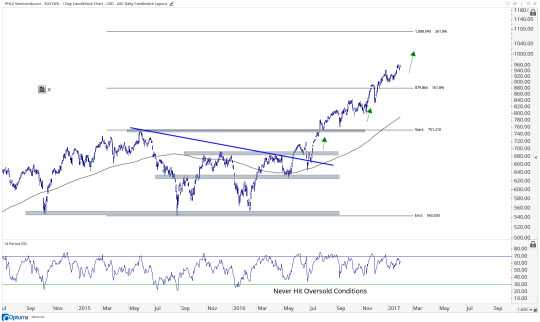
The Nifty50 in India is on its way to retest this overhead supply near 9000 for the 3rd time. The more times that a level is tested, the higher the likelihood that it breaks out. I believe we see this breakout during the first half of this year and we achieve our upside objective of 10,450 at some point this year:
India NIFTY 50
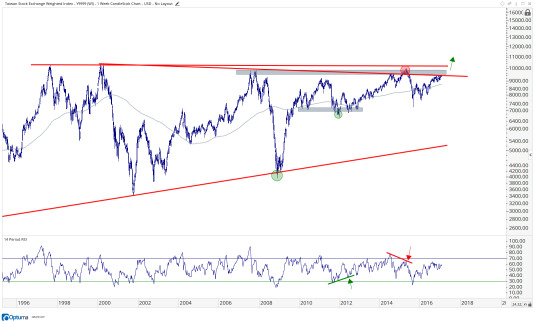
The structural strength can be seen all over the place. Here is the Taiwan Stock Exchange Index testing this 10,000 level for the 5th or 6th time, depending on how you count it. But this is not bearish. I think a structural breakout after a 20-year base is imminent here:
Taiwan
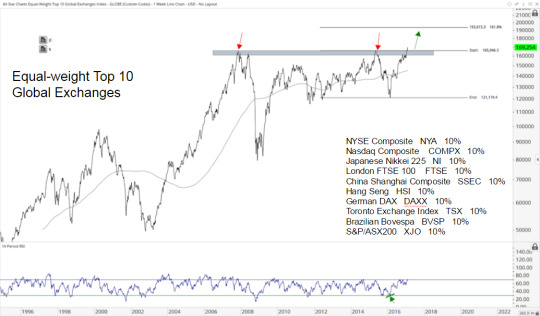
This is an index I created where I take the top 10 largest stock exchanges in the world and equally weight them. This is the Allstarcahrts Equal-weight Top 10 Global Exchange Index breaking out of a 9-year base to new all-time highs. This is not a bearish characteristic for stocks as an asset class:
Equal-weight Top 10 Global Exchanges
This gives us bigger picture macro perspective. Based on everything I see, we know a) we do not want to be short equities and b) we would rather be buying weakness than selling into strength.
The next thing we want to do is look to see where the strength is in stocks, but on a relative basis. Which sectors are standing out as the leaders and which are the weak laggards? If we believe stocks are in an uptrend, which we do, then we want to be buying the strongest sectors, not looking for mean reversions in the weakest ones.
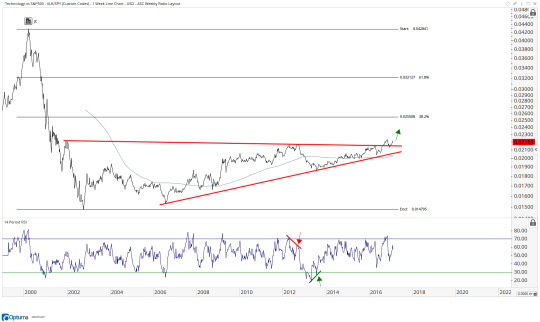
The one that stands out the most to me is Technology which is breaking out of a 15-year base relative to the S&P500. I can’t ignore this:
Technology vs S&P500 (XLK/SPY)
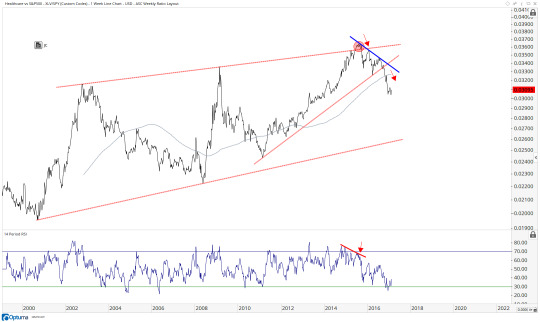
Meanwhile, Healthcare is hitting multi-year lows relative to the S&P500 as indexes all over the place keep hitting all-time highs. See the difference?
Healthcare vs S&P500 (XLV/SPY)
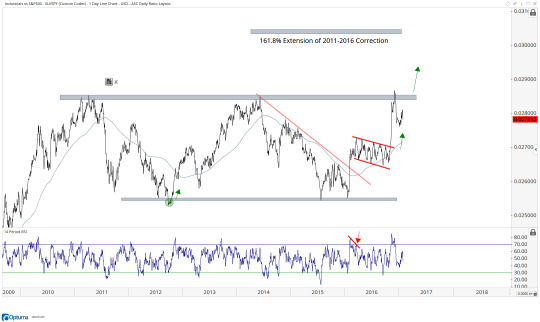
Finally, Industrials are still within a longer-term range going back to 2010. But this consolidation comes within the context of a longer-term uptrend in Industrials relative to the S&P500. I would expect an upside resolution soon. When it does break out, we want to make sure we’re all over it it because it can be vicious to the upside:
Industrials vs S&P500 (XLI/SPY)
Once we see where the leadership is and where the weakness lies, we want to look through every single sector and important sub-sector within the US Stock Market on an absolute basis. You can see the entire list in here: US Sectors & Sub-Sectors.
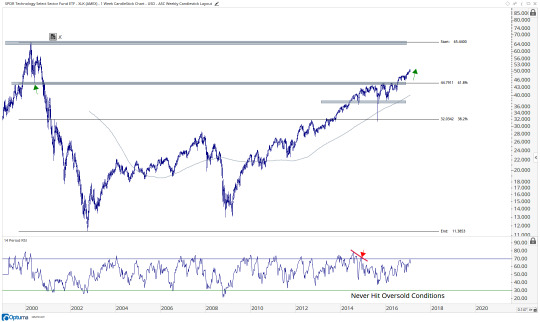
One sector that definitely stands out as a leader is Technology. It’s a killer combination when what you’re seeing on a relative basis fits in perfectly with the absolute strength. I believe Technology is one of those cases. Here it is looking longer-term. After breaking out of a 2-year base, prices are now attempting to retest those all-time highs from March 2000. That is still a long way from current levels:
Technology $XLK
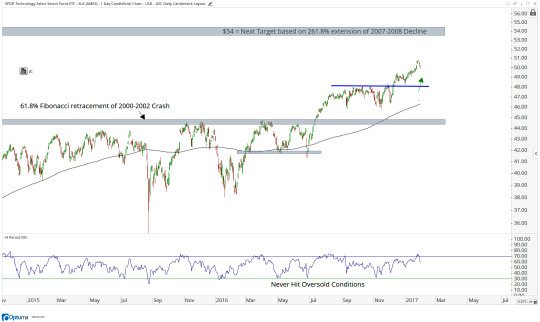
After looking at a longer-term chart, we can then break things down shorter-term. Here is Technology on a daily timeframe breaking out again in December and heading towards our intermediate-term target near $54:
Technology $XLK
The way I see it, Semiconductors are a leading indicator for Tech. It is also one of the most important sub-sectors on my list. If semi’s are above 905, we need to be aggressive buyers. I don’t see an environment where Tech continues to lead the market higher and Semi’s do not participate. To the contrary, I would expect semi’s to lead us higher:
Semiconductors Index $SOX
Here is a shorter-term look with a target near 1088, which is based on the 261.8% extension of the 2015 decline:
Semiconductors Index $SOX
Click Here to keep reading: A Top/Down Analysis of Global Markets
#$GSPC#$spy#$iwm#$nya#$ewu#$fez#$dxj#$ewj#$epi#$pin#$ewt#$xlk#$xlv#$xli#$smh#$sox#$socl#$xlf#$iak#$msft#$intc#$de#$nflx#$all#$adi#$swks#$powi#$uso#$gld#$corn
0 notes
Text
Five Charts to Watch instead of Fighting the Trend. Wait for it to Bend.
Ever since the March bottom the Markets have continued to make higher tops and higher bottoms across the world. All of us have been trying to spot the trend reversal and a big correction which has remained elusive. The last time I looked for a short , got stopped out the next day itself.
Very recently when Nifty dipped to 10900 we looked at how we need to wait for Global Indices to bend to confirm a trend change.
Nifty is close to breaking the momentum if it goes below 10800. Need to watch for a similar trend change in S&P 500 to confirm.
This link - http://www.nooreshtech.co.in/2020/08/nifty-and-sp-500-copy-paste-moves.html
Nifty reversed from those zones and went back into the trend. Also we looked at how every Index in the world has been almost in a similar trend in this post - Global Indices–Everything is UP. Also this video on the Copy Paste Moves in Dow and Nifty50 Co-Relation
Till now we have been watching very closely and riding the trend and waiting for the trend to bend.
Below we look at the Top Five Charts to watch for a Trend Change confirmation and the Price Zones.
Nifty 50 – The Last Swing Low at 11100.
Holding on to the support line. Last Swing low at 11100 and the Engulfing Bear Candle at 11800 are the two defining points of the short term trend.
Nifty Equal Weight Index – The last Swing low at 11450.
Given the concentrated nature of the Nifty50, we have now started looking at the Nifty50 Equal Weight to confirm the trend change.
S&P 500 – The Leading Indicator of Trend & Momentum always. Watch the 3320-3400 Mark.
This is well into the Highs and now 3400 the last high is the first support to watch for and next the swing lows at 3320.
Dow Jones – The Leading Indicator of Trend & Momentum. Watch the 27400 mark.
The last highs and swing lows around 27400.
Dollar Index – The Long Term Risk On in Making. Short Term Oversold.
The last Bull market in Emerging Markets got triggered by the big Breakdown in 2002-2003. A similar breakdown on cards in the future?
Short term over sold at current levels.
Would look at above 5 to turn together or most of them to confirm a trend change.
The Other Indian Indices and Global Indices also to look out for the Structure of the Market.
The Midcap 100 Index – Holding on to the Support Lines.
A deep crack from the last breakdown zone. Watch the 16250 and 17550 mark.
Nifty Smallcap 100 – Holding on to the Support.
BSE Smallcap – The Kachra Index of India. A unique index which depicts the bottom 15% of BSE Allcap. Has 700-800 stocks.
Pausing at the 2 year resistance. Longer Term picture improving once it can finally sustain above the 15200-15500 mark. The near term support at 13750 to watch for a bend.
Had recently put this tweet indicating a pause going forward.
https://twitter.com/nooreshtech/status/1296671399919202304
A combination of Midcap and Smallcap Index charts will give hint of the next Big Moves going forward. Find BSE Smallcap Index a good index to co-relate with Nifty.
The Global Indices – Knocking at Resistances.
Some part of the world is knocking at major resistances.
China – At a multi-year resistance. Can it break out or Flop.
Germany – Knocking at the Resistance.
Taiwan – All time highs and now into a range.
Nikkei – Knocking at the Resistance.
Would watch above Global Indices to see the Trend across other Markets.
Conclusion
We need to simply watch for confirmations across the Top Five Charts to confirm a trend change given the strong co-relation since March Lows.
The Midcap and Smallcap Indices will also indicate the shift of momentum going forward.
The Global Indices did not see a 2-3% crack like we saw yesterday.
Continue to stay alert and avoid over-leveraging given the extent of the move and the multiple resistances. Ride stock specific, sector specific. If its a pause we may see sector Rotation.
Do go through the following Links
Brief Video on Product Offering – Online Video Course and Analyse with Me -
After receiving a lot of inquiries,Have created a small video explaining the course offerings
Online Technical Analysis Video Course https://youtu.be/fJYX1TP0a6I
Analyse With Me – A Practical Approach to Technical Analysis https://youtu.be/K92k4V_BAaY
Advisory Services
Technical Traders Club http://www.nooreshtech.co.in/quickgains-premium/technical-traders-club
QuickGains F&O - http://www.nooreshtech.co.in/quickgains
For any queries whatsapp on 7977801488 or call on 9819225396 ( after market hours )
Five Charts to Watch instead of Fighting the Trend. Wait for it to Bend. published first on your-t1-blog-url
0 notes
Link
The benchmark indices were trading higher over 1 per cent higher on Tuesday after the Supreme Court ruled that telecom companies will be allowed 10 years for staggered payment of adjusted gross revenue (AGR) dues.
The apex court said the 10-year payment timeline will begin from April 1, 2021. Moreover, the telecom companies will have to pay 10 per cent of the dues by March 31, 2021
The S&P BSE Sensex reclaimed the 39,000-level, and was trading at around 39,150, up 510 points. The Nifty50 index was also trading above the psychological level of 11,500. IndusInd Bank (up 4%), Tata steel, State Bank of India, and Bajaj Finance (all up 2%) were the top Sensex gainers. On the other hand, ONGC dipped 3 per cent.
Among telecom stocks, Vodafone Idea tanked as much as 20 per cent while Bharti Airtel surged 6 per cent post the AGR verdict.
The trend among all the Nifty sectoral indices was mixed, with the Nifty PSU Bank index trading 2 per cent lower.
In the broader market, the S&P BSE MidCap index was ruling 1.4 per cent higher, and the SmallCap index was up 0.6 per cent.
Results today
Apart from these, a total of 37 companies including ONGC, Shalimar Paints are scheduled to announce their June quarter earnings today which might induce stock-specific moves.
CATCH ALL THE LIVE UPDATES
Auto Refresh
02:07 PM
Rupee Closing
Rupee ends stronger at 72.86 per US dollar vs Monday's close of 73.61/$
01:59 PM
Decoded: Why Sebi's new margin pledge norms have rattled brokerages
Many are expecting the trading volumes to come down in the cash segment. This has less to do with the new pledging system and more to do with the new margin norms. Under the new margin norms, Sebi has virtually put an end to excessive leverage trades. The regulator has directed brokers to collect higher margins from their client. READ MORE
01:50 PM
NEWS ALERT :: PNC Infratech signs concession agreement for a HAM project worth Rs 1,412 cr with NHAI
01:46 PM
HAL extends decline after govt's 15% stake sale; stock tanks 26% in 4 days
Shares of Hindustan Aeronautics (HAL) were under pressure for the fourth straight day, down 6 per cent to Rs 871 on the BSE in the intra-day trade on Tuesday after the government sold nearly 15 per cent stake in the aerospace and defence company through a public offering of shares (OFS). READ MORE
HAL, hindustan aeronautics
01:39 PM
AUGUST AUTO SALES | Eicher Motors total Royal Enfield sales down 5% YoY at 50,144 units
01:37 PM
IDFC First, IndusInd Bank: AGR verdict will not dent earnings, say experts
The Supreme Court on Tuesday allowed Vodafone Idea and Bharti Airtel 10 years time to pay their outstanding adjusted gross revenue (AGR) dues, starting April 2021. The apex court asked telcos to pay 10 per cent of their dues as "upfront payment" by March 31, 2021. Remaining instalments will need to be paid on February 7 every year. READ MORE
Private banks have better loss-absorption capacity, but are nonetheless bolstering core capital
01:27 PM
SC to decide on extending moratorium on repayment of loans tomorrow
The Centre and the Reserve Bank of India informed the Supreme Court on Tuesday that the moratorium on repayment of loans is extendable to two years in certain conditions, and that the sectors most distressed by the economic slowdown are being identified. "We are in the process of identifying the distressed sectors to vary benefits as per the impact of the hit they have taken,” the Solicitor General Tushar Mehta told the three-judge bench, headed by Justice Ashok Bhushan. READ MORE
loans, aum, assets, banks, investment, shares, stocks, funds
01:13 PM
Expert View :: V K Vijaya Kumar, Chief Investment Strategist at Geojit Financial Services on AGR Verdict
The SC verdict giving a ten year time frame for payment of AGR dues with 10 percent upfront payment can be regarded as reasonably fair. Since the SC has not said anything about the dues of R Com, Aircel and Videocon, this is certainly very positive for Reliance Jio and Bharti Airtel. However, the 10-year time frame puts a question mark on the survival of Vodafone. Indian telecom industry moving to a virtual duopoly is not a desirable development.
For the stock market the verdict is mixed. Since it is positive for Bharti and RIL these two heavy weight stocks are likely to remain resilient, supporting the markets. Vodafone’s woes, apart from impacting the stock, will also impact the stocks of banks which have lent to Vodafone
01:12 PM
AUGUST AUTO SALES | Ashok Leyland reports total sales of 6,325 units, down 31% YoY
-- Domestic sales at 5,824 units, down 30% YoY
-- M&HCV sales dip 52% YoY to 2,589 units
01:05 PM
STOCK UPDATE:: Bharti Infratel erases day's losses
0 notes
Link
The Indian markets were trading over half a per cent higher in Monday's range-bound session, lifted mainly by pharma stocks.
Among the benchmark indices, the S&P BSE Sensex rose 330 points to 38,370 levels and the Nifty50 index hovered around the 11,300 mark. Mahindra & Mahindra (up 6%) and Larsen & Toubro (up 5%) were the top Sensex gainers. Meanwhile, Divi's Laboratories surged 15 per cent after the announcement of its June quarter results.
Shares of defence equipment manufacturers and suppliers rallied up to 11 per cent on the BSE after the Ministry of Defence (MoD) announced on Sunday a phased, year-wise embargo on the import of 101 items of defence equipment. READ MORE
The Nifty sectoral indices were trading in the green, led by Nifty Pharma index, up 5 per cent.
Results today
A total of 100 companies including Titan and Bank of Baroda are scheduled to announce their June quarter results today.
CATCH ALL THE LIVE UPDATES
Auto Refresh
01:35 PM
'Quality' stocks come at a premium, valuations have crossed pre-Covid level
The valuation for most ‘quality’ stocks has surpassed their pre-Covid levels following a sharp run-up in stock prices. According to Kotak Institutional Equities’ analysis, one-year forward (FY22) price-to-earnings (P/E) multiple for 30 of 32 top companies across sectors is currently higher than the pre-Covid levels. READ MORE
01:23 PM
Shipping Corporation jumps 9% on Rs 317 crore profit in June quarter
Crude tankers were increasingly sought after by refiners and traders during the quarter to store crude oil on the high seas due to a slump in global crude prices and lack of storage space on-land. The tanker fleet, SCI’s largest division, account for more than half of the total fleet but in terms of tonnage (capacity), it constitutes close to 80 per cent of the total dead weight tonnage (DWT). The tanker division was the only segment that registered a growth in revenue on a yearly basis, at Rs 861.46 crore compared to Rs 571.25 crore in Q1FY20. READ MORE
01:12 PM
Reserve Bank's silence on record India bond sales leaves traders baffled
Their patience is running thin as the RBI refrained from taking steps to ease the market’s debt burden at a policy review last week, even as the government plans to sell Rs 12 trillion ($160 billion) of bonds this fiscal year. “The big question for the market is how this massive borrowing is going to be facilitated when banks are already full to the limit,” said Naveen Singh, head of fixed-income trading at ICICI Securities Primary Dealership Ltd. in Mumbai. “If the RBI doesn’t intervene, we could see yields resetting upwards at every auction,” he said. READ MORE
RBI
12:58 PM
BUZZING STOCK:: M&M surges over 5.7%
12:49 PM
MARKET UPDATE:: Broader indices outperform benchmarks
12:38 PM
Telecom stocks gain ahead of SC hearing on AGR
COMPANY LATEST(RS) CHG(%)
VODAFONE IDEA 9.18 3.96
BHARTI AIRTEL 563.00 0.43
TATA COMM 854.70 5.00
» More
12:32 PM
BROKERAGE VIEW:: YES Securities on Birla Corporation
RATING: BUY | TARGET PRICE: Rs 943
We have upgraded EBITDA estimates by 5%/1.9% for FY21E/FY22E respectively due to better than anticipated demand and pricing in May‐June combined with cost optimization measures. Accordingly, we expect peak net debt/EBITDA for BCORP at 3.3x in FY21E (despite factoring in that BCORP will not receive any subsidies in FY21E) vs the previous est. of 3.6x.
12:29 PM
BROKERAGE VIEW:: Edelweiss Securities on Vodafone Idea
Vodafone Idea (IDEA) reported a plunge of 9.3% QoQ in Q1FY21 revenue with 11mn subscribers fleeing the network and ARPU eroding to Rs 114 from Rs 121. Strong cost control and a dip in churn, however, drove EBITDA outperformance, but sustaining revenue traction, in our view, is crucial for sustaining the business. The company’s low capex underpins the fall in 4G subscribers, thereby constraining the balance sheet that is further fettering its ability to invest. In our view, the only way out of this vicious cycle is upfront capex and tariff hikes. For that, an early resolution of the AGR matter, and subsequent monetisation of the Indus Towers stake and fibre assets is crucial. The supreme court has scheduled a hearing on the matter on 10 August, which should provide more clarity. Retain ‘REDUCE’ with a revised TP of Rs 8 (Rs 9 earlier) as we factor in a lower ARPU due to slowing 4G subscriber addition.
12:27 PM
BROKERAGE VIEW:: Edelweiss Securities on Kajaria Ceramics
Kajaria Ceramics (KJC) posted weak Q1FY21 numbers, largely in line with estimates. While revenue declined 60% YoY to Rs 2.8bn, the company reported EBITDA and net losses of Rs 76mn and Rs 271mn, respectively. April was a complete washout with volumes plunging 61% YoY in Q1FY21; gradual recovery set in from July with 78% utilisation and a current run rate of 85-100% across plants. Management highlighted that demand in major cities like Mumbai, Bengaluru, Chennai, among others, was down 20-25%, which was partially offset by a pick-up in smaller cities. We believe growth visibility remains hazy as some part of the current volumes reflect pent-up demand and we expect the cost savings to reverse from H2FY21. Maintain ‘HOLD’ with TP of Rs 337 (19x FY22E EPS).
12:25 PM
BROKERAGE VIEW:: Axis Securities on Britannia Industries
RATING: BUY | TARGET PRICE: Rs 4,300
The low ticket price of the product and consumers' preference for trusted brands will continue to drive in-home consumption and market share gains for BRIT in the near to medium term. Additionally, healthy growth in adjacencies business, sustained product launch momentum, distribution penetration (esp in rural areas), RM tailwinds in the near term to drive a healthy growth momentum. We believe, Britannia provides the most visibility on earnings front in FY21 vs some of the other consumer stocks and thus remains one of our top picks in the FMCG-staples space.
12:23 PM
BROKERAGE VIEW:: Anand Rathi Shares on Blue Star
RATING: BUY | TARGET PRICE: Rs 626
Considering the continuing challenging situation, after the Q1 FY21 results we lower our FY21e/FY22 PAT 60%/41%. However, we continue to recommend a Buy with a target of Rs 626 (25x FY23e EPS of Rs 25) as we roll over our target price based on FY23e earnings.
Risks: Unseasonal rainfall and an extended winter could impact demand for room ACs and other commercial products.
0 notes
Last Seen Blogs

karlapowellmua
MUA Semenax In Arendelle

megalevus
Wonder What I'd Be

angelharahel
Pulvis Et Umbra Sumus

nonomives
Nomi

irl-dogboy
if it doesn't rain we'll live