
webanalytics
Website Analytics Blog
I share and post articles on digital marketing, with a focus on analytics and tracking
108 posts
Don't wanna be here? Send us removal request.
Last Seen Blogs

tumi121
Sans titre

mysummerfilm
MySummerFilm

i-see-starzzz
Star SFW

umseb
just another seb blog

gamma-galaxy
Just Vibin’
Text
Smart Data Visualizations: Quality Assessment Algorithm
The gap between a bad and good data visualization is small.
The gap between a good and great data visualization is a vast chasm!
The challenge is that we, and our HiPPOs, bring opinions and feelings and our perceptions of what will go viral to the conversation. This is entirely counter productive to distinguishing between bad, good, and great.
What we need instead is a rock solid understanding of the updraft we face in our quest for greatness, and a standard framework that can help us dispassionately assess quality.
Let’s do that today. Learn how to seperate bad from good and good from great, and do so using examples that we can all relate to instantly.
We’ll start by looking at the two sets of humans who are at the root of the conflict of obsessions and then learn to assess how effective any data visualization is in an entirely new way. If you adopt it, I guarantee the impact on your work will be transformative.
The Conflict of Obsessions.
There are two parties involved in any data visualization.
1. Analyst/Data Visualizer.
As I’ve passionately shared frequently on this blog, we, Analysts, are all in the business of persuasion. We work against that desired outcome because when we work on creating a data visualization, here are our top-of-mind concerns/desires/perspectives:
How can I cram as much as I can into the graphic?
What can I include to ensure everyone clearly gets just how much work I did?
How much of my agenda do I need to make overt, and how much can I make covert?
Is there something I can add to increase the chances that this will go viral and result in fame and glory?
Ok. I’m only teasing.
But, as an Analyst, a Data Visualizer, I can’t say that these thoughts don’t cross my mind. :)
I’m sharing the above primarily to ensure that you know these motivations exist – and, like me, you should try to fight and resist!
The very best Data Visualizers, obsess about:
1. known and unknown variables
2. causality
3. nuance
4. visualization techniques
5. rank-ordering messages
6. simplicity, simplicity, simplicity, simplicity, simplicity, simplicity, and, just to be safe one last time, simplicity.
These are the six things that matter supremely in my work, and they should be what matter in yours.
Simplicity matters more than the rest because if I can’t distill complexity, I might as well not do the work because that is only a snowball’s chance on the sun that the audience will understand my complex visual.
Let’s look at the other set of humans involved in a data visualization equation.
2. Data Consumer.
Here are the concerns/desires/perspectives that a consumer of data visualizations has top of mind when they are presented with a set of analysis:
What’s in it for me?
How easy is it to grasp the most important point?
What’s in it for me?
How much effort do I need to put in to understand the whole infographic?
What’s in it for me?
How can I trust that this message is from a credible Analyst/source/using sound methodology?
(Never underestimate the staggering selfishness that a Data Consumer brings with them to the table when you are showing them a table of data or a data visual. And, it is understandable because they have difficult jobs and 71 other things to worry about.)
Notice there is very little overlap between the obsessions of the Data Consumer and Data Visualizer.
If you have a choice (and you do!), let the needs of the Data Consumer drive your data visualization efforts. The only exception is when you are trying to push propaganda, then go with your agenda.
If an infographic sucks, it is usually due to the conflict between the Visualizer and the Consumer along the above dimensions.
You’ll see it vividly on display when you look at any graphic through the Consumer lens with an eye on simplicity (the Analyst dimension).
The Data Visualization Assessment Algorithm.
Algorithm might perhaps be a tad bit pompous, as applied here. I’ve developed a set of filters and lenses through which you can look at any data visualization in order to quickly assess quality.
Perhaps someone reading this blog post is going to help us all out by building a Machine Learning algorithm to assess if a Data Viz is bad, good, or great. :)
Reflecting on the aforementioned Consumer vs. Visualizer conflict of obsessions has helped me distill the evaluation of data visualizations to eight dimensions. They influence each other and the entire portfolio, yet they stand on their own.
In the format of “Obsession | [ratings scale],” here’s the data viz assessment algorithm:
1. Time to the most important insight. [Scale: Fast. Slow. KMN!]
2. The effort to understand the whole graphic. [Low. Medium. No Thank You.]
3. Trust marks. [Clear. Non-Obvious. None.]
4. Rank-ordering of key messages. [Yes. Partial. WTH!]
5. Explaining the key logic powering the graphic. [Super clear. Cloudy. Invisible.]
6. Exposing nuance. [Sweet. Some. Sour.]
7. Visualizer trying to be too clever. [No, and thank god. Yes, but it is harmless. Yes, sadly.]
8. Likely to recommend to influential leaders. [Yes! No. No way.]
I want you to explicitly notice:
I’ve put the Data Consumer first
Incentivized good behavior by the Data Visualizers, and …
… Included an outcome in the end because activity is well and dandy but it is outcomes are what matter.
My hope is to share a very specific algorithm that gets your critical thinking juices flowing. I invite your critique and suggestions on how I can make it even smarter. Please reply.
The best way to learn is to practice via real-world examples. So.. Let’s do that!
COVID What Should I be Afraid of (!) Data Visualizations.
A few weeks ago, perhaps not coincidentally, a number of different entities published visuals to help us understand what we can do safely and what’ll cause grievous harm.
I’ve collected four of these efforts – each a really different way to visualize nearly identical information. This gives us an ideal data set to apply our algorithm, and learn discerning skills along the way.
Data Visualization #1
The first graphic is from the inimitable Randall Munroe (I’m a very big xkcd fan!).
Randall has a unique way to communicate complex information (buy Thing Explainer!), and this graphic is no different. It combines seriousness, fun, and scientific accuracy.
As an approach, 2x2s work really well. They force simplicity. The color clustering above helps, you can jump to the safest or riskiest activities faster.
On the downside, it is hard to take in the whole thing. You can get lost.
I’m treating this as a very serious example, but it is important to remember that the intent above includes the goal of making us smile.
Let’s apply our algorithm and see how this graphic does with our tough, but with love, lens.
1. Time to the most important insight. [Fast. Slow. KMN!]
2. The effort to understand the whole graphic. [Low. Medium. No Thank You.]
3. Trust marks. [Clear. Non-Obvious. None.]
4. Rank-ordering of key messages. [Yes. Partial. WTH!]
5. Explaining the key logic powering the graphic. [Super clear. Cloudy. Invisible.]
6. Exposing nuance. [Sweet. Some. Sour.]
7. Visualizer trying to be too clever. [No, and thank god. Yes, but it is harmless. Yes, sadly.]
8. Likely to recommend to influential leaders. [Yes! No. No way.]
The graphic should technically get a pass on #3 as it is for fun, and possibly #5 as well. But, I’ve still graded it seriously so that all of us can practice scoring.
If the phrase big miss applies here it is perhaps #2, the effort to understand the whole graphic (or more precisely, cartoon).
Based on the algorithm’s assessment, it earns a score of 23/66.
Oh, I totally forgot to tell you… I made a little scoring system to help you truly internalize the key messages. Those who know me will not be surprised that my system has a steep grading curve (#highstandardsFTW!).
The scoring system uses a multiplier across each rating in the scale above. Additionally, since each dimension does not carry the same level of importance, there’s a multiplier for each dimension – to effectively communicate my values.
Here’s the math…
It is all fun and games until you realize there’s a score involved! :)
Important: My intent in creating the data viz assessment algorithm, and scoring sheet, is not to have you entirely agree with how I’m grading each visualization. My intent is to teach a systematic approach you can bring to these difficult and complex tasks.
I do hope you see why I’m scoring the way I am, I hope you’ll agree. But, that desire is tertiary.
Data Visualization #2
The second graphic is from the world-famous Information is Beautiful (IiB). They have some of the world’s most famous data visualizations. (The simple and effective: When Sea Levels Attack)
IiB tends to make graphics for large screens, I need to be on my beloved 27” ThinkVision monitor to read it optimally.
In this instance, you’ll notice the color palette works against the ability to read the text (teal on dark gray or slightly lighter gray on dark gray).
The spectrum from light yellow to blood red of the circles, with internal gradations, is trying to add a layer of cleverness that possibly satiates a Data Visualizer, at the cost of the Data Consumer.
Once you zoom into one part of the visual, things become readable. You do lose the full picture of any section. In this view, perhaps you’ll agree that there is a sense of randomness to what’s in the bubble (check for this in the two visuals below as well).
It was a lovely touch to add the “risk factors to consider” on the top left of the visualization which explains the logic powering the graphic.. (You can see it more clearly in the higher resolution view, the blue font on gray makes it hard above.)
I do like the subtle helpful tips like the one about condiments, below.
Let’s apply our algorithm and see how this graphic does with our tough, but with love, lens:
1. Time to the most important insight. [Fast. Slow. KMN!]
2. The effort to understand the whole graphic. [Low. Medium. No Thank You.]
3. Trust marks. [Clear. Non-Obvious. None.]
4. Rank-ordering of key messages. [Yes. Partial. WTH!]
5. Explaining the key logic powering the graphic. [Super clear. Cloudy. Invisible.]
6. Exposing nuance. [Sweet. Some. Sour.]
7. Visualizer trying to be too clever. [No, and thank god. Yes, but it is harmless. Yes, sadly.]
8. Likely to recommend to influential leaders. [Yes! No. No way.]
I was this close to choosing no way in terms of recommending this graphic to others (because I never will). In the end, IiB is such a huge entity and so famous and so many people love them… no way seemed too much against the grain.
I've come to understand that IiB has a very specific design language, texture, and philosophy that has come to define them. It possibly acts as a constraint now.
Based on the algorithm’s assessment, it earns a score of 7/66.
Here’s the math:
It is important that data this critical – for this wide a consumption (whole planet) – needs to figure out how to hit an extraordinarily high simplicity and effective comms standard. Else, it remains an exercise in self-satisfaction by the Data Visualizer.
Data Visualization #3
The third graphic is by Professor Saskia Popescu, Dr. James P. Phillips, and Dr. Ezekiel Emanuel.
I’m a huge fan of Dr. Emanuel. He was the special advisor for health policy in the Obama administration and played an instrumental role in passing the Patient Protection and Affordable Care Act (aka. Obamacare). For this, he has my eternal gratitude on behalf of those who society and politicians don’t usually listen to in the United States.
The Covid-19 Risk Index clearly identifies the logic powering the graphic: enclosed space, crowds, duration of interaction, and forceful exhalation.
Note that IiB also had some of these factors, forceful exhalation is an addition here (unsurprising that the doctors brought that to the fore).
The colors in the graphic are related to the intensity of the risk, green is low and red is high. Simple, direct, effective.
I’m not a huge fan of a giant company logo on graphics as you see below in the "hexagon art." I believe: More white space = more peace.
Given the heartbreaking debate in the US, I did appreciate the bonus call to action up top to wear a mask.
Did you notice the trust marks at the bottom? Really nice.
As in the case with the IiB graphic, this one is meant for the large screen display. I applaud the team for making sure each segment is readable – no fancy font colors and fancy background as a demonstration of the Visualizer's smartness.
Folks in my teams know I hold a special hatred for icons. They add clutter. In this case, I do support the decision to include icons.
For example, without needing to read any text I know that working in the office carries medium/high risk, and participating in group religious services is in the recommend you please avoid category – even in the small version above and certainly in the zoomed-in version below.
Let’s apply our algorithm and see how this graphic does with our tough, but with love, lens.
1. Time to the most important insight. [Fast. Slow. KMN!]
2. The effort to understand the whole graphic. [Low. Medium. No Thank You.]
3. Trust marks. [Clear. Non-Obvious. None.]
4. Rank-ordering of key messages. [Yes. Partial. WTH!]
5. Explaining the key logic powering the graphic. [Super clear. Cloudy. Invisible.]
6. Exposing nuance. [Sweet. Some. Sour.]
7. Visualizer trying to be too clever. [No, and thank god. Yes, but it is harmless. Yes, sadly.]
8. Likely to recommend to influential leaders. [Yes! No. No way.]
This graphic went viral on the socials, and deservedly so. With CV-19 flaring up in multiple countries (sadly, we in the US are still making our way through wave one), I hope that you will use the graphic above to stay safe – and share it with your friends and family so that they can stay safe as well.
Based on the algorithm’s assessment, it earns a score of 50/66.
Here’s the math:
Clearly a graphic the Data Visualizer can be proud of, reaching a level of obsessions overlap with Data Consumer obsessions that is rare.
Data Visualization #4
The last graphic was developed by the physicians on the Texas Medical Association COVID-19 Task Force and TMA Committee on Infectious Diseases.
I love it.
It is simple. It is easy to digest. There is absolutely nothing cute about it (hurrah!). There are no circles to jump through. No expensive Data Visualizer Specialist In Fonts was hired. The graphic is not trying too hard.
It was probably designed by the Doctors in TMA. It is insanely boring. All it is is… Effective.
Just about the only lite criticism I can make is that perhaps in keeping with the (ironically) liberal posture of the state of Texas when it comes to dealing with Covid, this graphic lowers the bar for what’s risky compared to all other sources. I share that as a small red flag, but it is adjacent to the technical analysis of the data viz that we are undertaking today.
The logic powering the graphic is integrated into the core of the graphic, as becomes clear below. There is little to no effort necessary to understand the visual. Start at the top, keep going. The colors and bars help you along.
Even in this small size, it is fairly readable…
When information is laid out so clearly other things jump out at you that makes you think (an excellent trait of a great data visualization).
All of the below items are an 8 or a 9 – but consider the staggering differences.
Attending a bar is just as risky as a religious service with 500+ worshipers! And, both are a tiny bit riskier than eating a buffet!! You were leaned-in questioning the data, being curious. A good sign.
Let’s apply our algorithm and see how this graphic does with our tough, but with love lens:
1. Time to the most important insight. [Fast. Slow. KMN!]
2. The effort to understand the whole graphic. [Low. Medium. No Thank You.]
3. Trust marks. [Clear. Non-Obvious. None.]
4. Rank-ordering of key messages. [Yes. Partial. WTH!]
5. Explaining the key logic powering the graphic. [Super clear. Cloudy. Invisible.]
6. Exposing nuance. [Sweet. Some. Sour.]
7. Visualizer trying to be too clever. [No, and thank god. Yes, but it is harmless. Yes, sadly.]
8. Likely to recommend to influential leaders. [Yes! No. No way.]
Based on the algorithm’s assessment, it earns a score of 64/66.
Here’s the math:
The TMA graphic was the spark to write this newsletter.
The world needed a simple way to communicate effectively, in this case literally, information that can save lives.
While things are rarely that high-stakes in a business environment, I hope the TMA inspires you to ensure that you don’t lose sight of what’s important when you work on data visualizations: The understanding of data.
Bottom line.
How do you handle the conflict between your goals as a Data Visualizer (and incentives your employer creates for you) and the Data Consumer? While the answer seems obvious, it is incredibly difficult to execute. I hope you’ll use the data visualization assessment to ensure you, your team, solve for the Data Consumer first, yourself second.
If you have graphics that score above 60, I would love to see them! (If they are shareable.)
All the best.
PS: Bonus Life Lesson:
A small number would surely have noticed that the perfect score from the algorithm is 66 (all Great), and the score for it was good enough is 22 (all Could Be Optimized). That massive chasm reflects life (and my philosophy).
There are thousands of Analysts who’ll stop at good, after all it is good. Perhaps a hundred, or less, will do the hard work required to get to great. They’ll rule the (biz) world.
#nowyouknow
The post Smart Data Visualizations: Quality Assessment Algorithm appeared first on Occam's Razor by Avinash Kaushik.
from Occam's Razor by Avinash Kaushik https://ift.tt/34ZjDjl
#Digital #Analytics #Website
0 notes
Text
Responses to Negative Data: Four Senior Leadership Archetypes.
Not everything a company does works out.
(That is different from everything that a company is doing not working out. :))
If you are in the data business – my bread, butter and tofu – you often carry the burden of being the bearer of bad news.
The conversion rate is down 30% at launch.
The goal was to deliver a 30% increase in revenue, the team delivered 1.7953%.
During 2019, our Net Promotion Score has dropped 15 points.
The average length of our video ads is 30 seconds, less than 10% of the audiences watches beyond 5 seconds and 90% is exposed to less than 1 second.
Our Market Share in the 2-ton truck market shrunk by 1.5% (= -$3 bil).
Negative data.
Accurately collected. Intelligently analyzed. Factually presented.
Sadly still, negative data to the person/team receiving it.
Why be hurtin’?
A decade ago, data people delivered a lot less bad news because so little could be measured with any degree of confidence.
In 2019, we can measure the crap out of so much. Even with the limitations of tools, government regulations, and the astonishing fragmentation of everything (attention, devices, consumption sources, identities and more).
Companies have also evolved to be significantly more complex beings, who have to do so much more than what they did 50 years ago. Think of all P&G had to do to sell soap 50 years ago, think of everything they are doing now. Add on top of that, where P&G could sell soap, the purposes it could sell soap for, and imagine both of those things now. It is a lot of stuff!
When you do that much stuff, and you can measure almost everything… The result is that our ecosystem of data people are returning a lot more negative data when measuring performance of Marketing, Sales, User Experience and Customer Service.
Let me repeat this one more time: It is not that companies have slowly over the last decade started to suck more (well, maybe some). It is that we are able to analyze and identify bad performance with greater accuracy.
While that change has occurred, two things have obstinately stayed the same:
1. Company cultures are rarely open to hearing anything negative.
2. The top leaders in your company grew up, succeeded, and were promoted during the era of no data (and hence a ton less negative news). They are not natively wired to receive data-delivered reality checks.
The combination means no red carpet for negative data. It is not hard to see that a modern large corporation is likely missing out on the benefits of all they should know about their business through data. It also results in a depressing existence for data people.
Short-term, this let’s not listen to the negative data strategy sometimes actually works. No one is telling the Emperor he is naked, and the Emperor is delighted everyone loves his clothes so much.
Long-term…. : (
Four Negative Data Leadership Archetypes.
The solutions to this big opportunity have many dimensions.
I want to focus on the massive “make or break” dimension: #2 above, with Extremely Senior Leaders (ESLs).
Through their words and actions, ESLs can quash data's learn to improve spirit, or they can nurture that spirit and deliver a transformative, positive impact on the company's culture + profit.
In my work with clients around the world (all continents except Antarctica), I’ve encountered a whole host of reactions to when I have shared negative data with ESLs. From the patterns in those reactions, I’ve developed four archetypes of leaders.
While people are never starkly black and white, they typically have a dominant archetype – the one they most frequently demonstrate.
I’ve also observed cultural implications that each leader-type ends up creating from their reactions to negative data. For three of the four, I’ve seen individuals successfully navigate the leader-type – never without scars though – and individuals emotionally burn-out due the environment the leader creates.
Today, I want share the four leader archetypes with negative data as the lens. Included below is my accumulated wisdom, with the hope that you’ll fall in navigate category and not the crushed one.
Ready?
Archetype #1: The Bubble King (/Queen).
Archetype #1: How they react:
This individual lives in a bubble, so their reaction to any data is… Nothing. Data, unless it is super-positive, never makes it to them. Bubble Kings are comfortable making decisions that sound good – decisions just as likely to be informed by their long experience as the quest for shiny objects.
Bubble Kings most commonly reside in organizations where there is little to no accountability (or misplaced accountability, ex: celebration of vanity metrics).
Their most common reaction to negative data, if it makes it through, is to try to discredit it by asking analytically-nonsensical questions: What are the p-values of your multi-channel attribution model applied to performance of my strategy?
Archetype #1: Cultural implications:
In small or medium sized companies, Bubble Kings (/Queens) have short reigns. Not all that hard to imagine why – you don’t listen to data, ignore reality checks, and the transparently oriented accountability loop ensures there is nowhere to hide.
In large companies, or teams with massive budgets, Bubble Kings (/Queens) have long reigns. The accountability loops are larger, less transparent, and the natural large-company multi-layer organization complexity does not help. Typically a change in the C-Suite layer above will transition them out of the company (fresh eyes, sunshine … call it what you will).
However, while they still reign – since feelings matter more than data – sycophantic behavior is common and often encouraged.
Archetype #1: How to deal with them, their org:
Data will never play any impactful role on strategy. Since Bubble Kings live in a, well, bubble, you can often form relationships and influence at lower levels in a Bubble King’s org, and you can have a positive influence on tactics. Absolutely take advantage of it.
If you want to get promoted, give up the quest to identify factual real-world performance and focus instead on proving that the Bubble King's decisions deliver excellent results. Don't compromise on your ethics. But on this blog and in my newsletter I’ve shared enough strategies you should not use to slant data – use them.
[Bonus Reads: A Great Analyst's Best Friends: Skepticism & Wisdom! & TMAI #154: Irrationality, Cognitive Bias, and Us.]
Archetype #2: The Attacker.
Archetype #2: How they react:
They attack.
They attack the data. They attack your knowledge. They attack your intent. They bring up that one time in 2013 when your analysis missed an important assumption. They attack your personal attributes.
In the face of factual negative data related to their decisions, they will counter-attack. At times, harshly. Sometimes they counter-attack, in a twist of irony, by trying to drown you in enormous detail and minutiae.
You will be branded Ms. Bad News or Mr. Not A Team Player or some such ugly moniker.
Archetype #2: Cultural implications:
In extremely senior positions, Attackers fuel the creation of a culture where no bad news ever filters through. When business performance is non-positive, every employee, at every level, will work super-duper hard to look at every dimension of data to find any semblance of good news (no matter how small). Only this good news will make it to the top (Attacker ESL).
A typical example: The entire house is on fire but the analysis of that situation will focus on the one unsinged rose in the font lawn and how beautiful the rose is.
Attackers lead can last for a surprisingly long time in an organization, for a whole host of strategic reasons (as I’m confident you’ve observed as well).
Archetype #2: How to deal with them, their org:
If you are a data person and you are in a small organization lead by an Attacker, you need to update your resume and find a way out. There is no hope for your career (or emotional positivity).
If you are a data person and you are in a large organization lead by an Attacker, also update your resume. If, for any number of valid reasons, you are stuck there my advice is to focus your analytical efforts exclusively on the Attacker's biggest fears. It might take a little bit of effort to discover them, but it is so worth it. Even an Attacker has a point at which their instinct for self-preservation kicks in, in those rare (often hidden) situations they’ll be open to negative data.
And this is key: If you can provide solutions and not just data, you might even become a trusted adviser. This will do nothing to advance your acquired negative branding of Ms. Bad News, nor will this change the broader team/company culture… But…You'll have an impact with data, providing a pretty decent existence in an Attacker created culture while you look for a way out.
Archetype #3: The Rationalizer.
Archetype #3: How they react:
Their trigger instinct in face of factual negative data is to make excuses. To provide context. To identify circumstances to blame. To poke holes in the data/methodology (regardless of the Rationalizer’s analytical competence). To create enough uncertainty to fuzzy up any negative – or remotely negative – data.
If we were stack rank the four types, the Rationalizer would come on top as the most undesirable leader (often corrosive for the institution).
You might think it would be the Attacker. It is the Rationalizer because their approach to dealing with negative data is not as overtly corrosive. A Rationalizer subtly sows doubt. They dilute the analysis with non-facts. They force the inclusion of non-related nonsense in the quest to paint a fuller picture. At their worst, they commonly turn diamonds into coal.
Archetype #3: Cultural implications:
Everything data people do to highlight reality, to bring truth to the fore, to identify positive solutions from negative data, will be discounted, buried, and compete for impact with faith. Questionable analysis and slanted views will have equal footing with the most factual and intelligent analysis.
When people say "this team’s culture runs on BS," they are describing an organizations run by a Rationalizer.
Status quo will rule the day in such organizations, unless there is a big external force that creates change. The operative instinct is to maintain mediocrity with just enough reality massaging flowing upstream to ensure existing mediocrity is not utterly obvious.
One identifying attribute of Rationalizer organizations is the overwhelming abundance of data pukes. Why? Data pukes do nothing to make an organization intelligent, while providing the feeling of competence and productive output.
Archetype #3: How to deal with them, their org:
Rationalizer org’s are hardest to deal with because you are not obviously being ignored (Bubble King) nor are you being openly challenged (Attacker). You are just constantly being undercut to the point where the data represents a watered down version of an adjacent reality.
If you are a data person full of courage and determination, find the largest element of the business' strategy and unpack the power of strategic analysis to present factual data. Lead with as many things as you can find that are going right, then follow that with the most material two things that are factually not going right. Present the collection directly to the Rationalizer if you can.
On that note… Since the Rationalizer is an ESL (Extremely Senior Leader), it is quite possible that you have to work through many layers of people in-between you, my peer data person, and them. In a Rationalizer’s culture, every layer you go through will instinctively take the material two negative news and will try to kill it or fuzzify/massage it. In these cases, if you can make cosmetic changes to pass each layer, do so. Don't give up on the core of the positive and negative stories.
When you are in the presence of a Rationalizer, bring overwhelming analytical competence – there is no better way to deal with their reactions (see above). A Rationalizer never gives up trying to rationalize every small bit of negative data, persistence is a virtue that’ll come in handy.
Keep in close contact with your soul. At some point you’ll find it is sapping, it’ll be your clue that you need to find it a different professional environment.
Archetype #4: The Curious One.
Archetype #4: How they react:
In face of negative data, the Curious One asks you questions to understand the why behind what you are presenting.
If a period has elapsed where the data person has demonstrated competence, the Curious One does not question the analytical approach of data collection methodologies (they trust you to have applied fanatical quality control). The Curious One demonstrates, well, curiosity about what biases might be in the data or what assumptions you might have made.
They have two critical attributes: 1. They demonstrate open mindedness in the face of negative data. 2. Their posture is not to instinctively blame (backwards looking), but rather the posture is to identify and fix (forwards looking).
Archetype #4: Cultural implications:
Due to the demonstrated behavior at the top, open mindedness is usually encouraged in organizations led by Curious Ones.
Negative data is never a delightful experience, but the trust fostered amongst senior leaders results in a lot more truth telling, and is as good of a welcome mat as will ever be provided to the data people.
It might seem odd that in such a positive posture to negative data that there is still accountability, but incredibly in my experience it exists in spades in such organizations. It flows down from the clear measurable goals, an empowered data organization, and a close and direct partnership with different leadership levels (VPs, Directors, Sr. Managers).
Archetype #4: How to deal with them, their org:
Pinch yourself every day.
Don't take your position for granted. Invest in self-learning every week – even couple hours a week – to ensure you can keep pace with the demands for sophisticated analysis which will be expected at an agile pace.
You know my Care-Do-Impact model for analysis and storytelling. Organizations led by the Curious Ones are the very best places for you to slowly migrate your sophistication in Do and Impact. This, in turn, means that your demonstrated sophistication will open up new career options, for example becoming a business line leader or moving on to the strategy side of the house. Joyous outcomes for you, your company, and your company's customers.
Two Inspiring Examples | Curious One Archetype.
Paul Polman.
One person who demonstrated Curious One behavior to me was the recently ex-Global CEO of Unilever, Paul Polman. I had an opportunity to spend time with him and his leadership team. My role was to be a challenger, to share stories about what Unilever did well and focus on the challenges faced by vividly demonstrating things they did not do well. The latter part of the story qualifies as negative data.
It would be normal CEO behavior to be defensive, to pick the story apart, to make excuses. But, no. Through his words and actions to me and his brand CEOs, Mr. Polman demonstrated every attribute of the Curious One. This opened mind share required to re-imagine the future.
As with inspiring leaders, there is a whole ton lot more as to why I admire Mr. Polman.
Alan Mulally.
Mr. Mulally’s stewardship of Boeing and Ford is legendary. I want to share one story that Mr. Mulally shared with us in a meeting (and in his book).
When he got to Ford he instilled the same colored charts approach to identify what's working and what needs more attention. All the charts Mr. Mulally got were color coded green (#everythingisawesome). The problem was that Ford was on track to lose $17 billion dollars that year. Ford's culture was such that business leaders would hide problems, therefore making issues "disappear." Mr. Mulally set a different tone of honesty and looking at negative data as an opportunity to improve/change/fix (classic Curious One approach). In next meetings, things slowly started to turn Red… and Yellow… and some real Green.
There is a lot more to Mr. Mulally's turnaround of Ford. Eleven principles actually (buy the book!). But in this anecdote you can see the central reason that I adore him, and the leadership skills that can turn even the most intractable business problems in some of the largest companies on the planet.
A Plan for Action.
Humans are complicated beings.
No individual is just one black and white type.
Yet, humans, at least professionally, tend to demonstrate a dominant type. It is what they are natively comfortable with.
With that in mind, a suggestion for a plan of action…
Leader.
Introspective is in order. Assume you are doing this only for your own selfish benefit reasons, no one else has to know.*
Take a quiet moment.
Reflect on what your dominant type is: Bubble King or Attacker or Rationalizer or Curious one.
Once you do that, consider the impact that your leadership posture is having on your team, on your data people, on the ability of negative data (or negative anything) to help stop/rethink strategy, and indeed on the corporation.
The global maxima is that you consider a personal shift towards exploring the benefits of evolving to become the Curious One type (if you are not there already).
An incentive is that at some point in a long career, one does tend to reflect on the personal impact of one's professional accomplishments. In that moment, on that day/week/month/rest of your life, realizing the heart-breaking impact you delivered by being a Bubble King, Attacker or Rationalizer does deliver a heavy emotional burden and a personal crisis. So. Not. Worth it.
There is a meme that people can't really change who they are. You'd be surprised how untrue that is.
* Your team already knows what type you are. You might as well be honest with yourself for all the benefits that will come.
Individual.
Self-reflection is in order for you as well.
Set some quiet time aside so that you can consider the how they react and cultural implications demonstrated by the leader who has the biggest influence your personal work. (Sometimes this is your direct manager. Other times it is someone a few levels above yours.)
In your mind only, assign the archetype (BK, A, R, CO) to the leader. That act will bring clarity as you ask yourself these three questions I recommend…
What is your behavior in response to that dominant leader?
Is it as suggested in the how to deal with it section of each leader type?
What will it take for you to change your behavior to optimally deal with the situation you are in?
Make a specific plan.
Act on it. Life is short.
It is always better to be on a path chosen after careful self-reflection and planning, even if you find yourself in an undesirable situation. It might not deliver world peace, but it will reduce your emotional burden.
Bottom-line.
We've used leader reaction to negative data as a vehicle to discuss creating an optimal professional path for ourselves (as leaders or as individuals).
The framework I've shared, how they react, cultural implication, and how to deal with it, can be applied to multiple dimensions of our professional ecosystem. Give it a try.
If you are a leader, if you have a choice, be the Curious One. Here are a recap of the benefits: 1. Lighter personal emotional burden. 2. Cultures where the goal is not blame, it is making progress. 3. People who love you (yes, love, in a workplace!) and will help you deliver transformative results – in good times and bad.
So. Worth. It.
Good luck!
As always, it is your turn now.
What archetype identifies the most influential leader in your organization? If you are a leader, what archetype is reflective of your impact? If you’ve successfully worked inside organizations lead by a Bubble King (/Queen), Attacker, Rationalizer… What worked, what did not work? Have your seen a leader transform into a different archetype – do to an HR-induced or personal induced change? What worked, what did not work? Is there an archetype you would have created, if we are looking through the lens of negative data?
Please share your reflections, critique, culture-shifting strategies, and tips for individuals or leaders via comments.
Thank you.
The post Responses to Negative Data: Four Senior Leadership Archetypes. appeared first on Occam's Razor by Avinash Kaushik.
from Occam's Razor by Avinash Kaushik http://bit.ly/2Ixy4l2
#Digital #Analytics #Website
0 notes
Text
Deliver Step Change Impact: Marketing & Analytics Obsessions
Some moments in time are perfect to reflect on where you are, what your priorities are, and then consider what you should start-stop-continue. In those moments, you are not thinking of delivering incremental change… You are driven by a desire to deliver a step change (a large or sudden discontinuous change, especially one that makes things better – I’m borrowing the concept from mathematics and technology, from “step function”).
In those moments – common around new years or new annual planning cycles – the difference between delivering an incremental change vs. a step change is the quality of ideas you are considering. In this post, my hope is to both enrich your consideration set and encourage the breadth of your goals.
My professional areas of interest cover Customer Service, User Experience and Finance, though here on Occam’s Razor my focus is on influencing incredible Marketing through the use of innovative Analytics. To help kick-start your 2019 step change, I’ve written two “Top 10” lists, one for Marketing and one for Analytics – consisting of things I recommend you obsess about.
Each chosen obsession is very much in the spirit of my beloved principle of the aggregation of marginal gains. My recommendation is that you deeply reflect on the impact of the 10 x 2 obsessions in your unique circumstance, and then distill the ten you’ll focus on in the next twelve months. Regardless of the then you choose, I’m confident you’ll end up working on challenging things that will push your professional growth forward and bring new joy from the work you do for your employer.
Ready?
First… The Analytics top ten things to focus on to elevate your game this year…
The Step Change Analytics Obsessions List.
A1. Improve the Bounce Rate of your top 10 landing pages by 50%.
(Improving Bounce Rate results in reducing it. :))
You'll be surprised by the steep drop in Cost per Acquisition.
Google Optimize will be one of your BFFs in this quest. You’ll know you’ve moved beyond basic improvements when you start setting Custom Objectives – they require deeper thinking, which is a good sign.
A2. Eliminate 40% of the numbers from your dashboard.
Take the newly-created white space to explain what to do based on performance of 60% of the numbers that remain.
What your boss wants most this year, more than love, is to be told what the data wants her to do. Don't leave her guessing.
(Bonus, with actionable ideas: Smart Dashboard Modules.)
A3. Take your first steps towards unlocking smart algorithms.
Learn what Session Quality is in Google Analytics, then learn how to use it in your campaigns to improve conversions. In the Audiences section, go to the Behavior folder.
Learn what Smart Bidding is in Google Ads, then learn how to use it in your campaigns to improve outcomes.
Machine Learning algorithms will make our data smarter in unparalleled ways; Session Quality and Smart Bidding offer early clues about the scale and type of intellect. In both instances, it is immensely valuable to really understand how a smart algorithm uses billions of data signals to calculate likelihood of a conversion.
Across all your analytics data, algorithms will take you places humans simply can't. This should be the year you invest in an expansion in skills and practice to take advantage of these possibilities.
A4. Take a class in data visualization. It will save your life.
Anyone can make a complicated visual, it takes someone very special (you!) to draw out the essence of the story data is trying to tell.
My recommendations:
Free Courses: Data Visualization and D3.js and Data Analysis and Visualization at Udacity.
Affordable: Data Analysis and Presentation Skills at Coursera.
Occam’s Razor: Start with this one: Closing Data's Last-Mile Gap: Visualizing For Impact. And, there are five more linked to here.
Through all these courses remember the most important thing about data visualization: It’s not the ink, it’s the think. Obsess about improving the think, just as much as I’m encouraging you to improve the ink.
A5. Obsess about what happens after campaigns end.
In our analytics practice we tend to celebrate victory too early (at the end of the campaign) or with insufficient breadth (the full scope of impact).
Did you get customers with high lifetime value? How long did the brand lift – say Awareness – last? What was the average order value of the second purchase by people you acquire via Search, compared to those via Retail?
Is there a difference in behavior between people who signed up for email over the last year vs those who did not? What the cost of getting a retail customer to make subsequent purchases over mobile apps lower?
A6. Understand your personal impact, obsess about improving it.
Grab the revenue number for the company. Now work out how much of it is influenced by you directly. Make a note of what it is (likely to be a couple percentage max).
Double that number this year.
What are the first five things on your list?
None of them will be easy, but converting insights into action via influence rarely is. But, you don't have to stretch too far to see how amazing it would be for you (and data too!) if you double your impact.
A7. Run one super-large controlled experiment.
To prove what your Executives believe purely from their gut. Or, to disprove it.
Does Facebook advertising really work better than TV? Can you create premiumness for your brand using digital? Is a 15% coupon now better than 20% off the next purchase? Does swapping out male model posters for cute animals triple sales?
Does sponsoring a fashion show lead to an increase in brand equity? Does free pickup in store result in higher attach rates?
A8. Identify four relevant micro-outcomes to focus on in 2019
(In addition to the macro-outcome of revenue).
Businesses win when you optimize for a portfolio, because at any given time only a tiny fraction of people want to buy. Solving for micro and macro-outcomes is directly connected to the holy grail of solving for short-term AND long-term success.
Employees also become smarter when they have to optimize for more than one thing. :)
A9. Throw away your custom attribution model. Embrace data-driven attribution.
For some things, humans are already less smart than machines. Trying to guess what might be happening across millions of touchpoints on and off site, on and offline, is one of those things.
Skip the first five steps of attribution’s ladder of awesomeness, jump to DDA. From the tens of hours saved per week, figure out how to feed offline data into your data driven attribution model.
With an obsession with data-driven attribution, you are also solving for a portfolio rather than a silo. Super cool, super profitable.
A10. Hire an experienced statistician to be a part of your analytics team.
There is too much goodness in modeling that you are not taking advantage of. From segmentation models to identifying incrementality to predictive modeling to survival analysis to clustering to time series to… I could keep going on and on.
2019's the year you get serious about serious analytics.
A11. Bonus: Reporting kills, analysis thrills.
If that is true, and it is, :), then what % of time are you personally spending between Data Capture – Data Reporting – Data Analysis?
Outsource or eliminate half of your data capture and data reporting responsibilities, and allocate it to data analysis and driving action.
You'll be surprised at the increase in your salary and bonus (oh, and the company will benefit too!).
In context of Analytics are you aiming for something special in 2019 that I've not covered above? Will you please share that with me by adding a comment? Thank you.
Switching gears, here are ten things to obsess about to collectively deliver a step change via your Marketing game this year…
The Step Change Marketing Obsessions List.
M1. Improve the Bounce Rate of your top 10 landing pages by 50%.
(Improving Bounce Rate results in reducing it. :))
Same as the #1 on the Analytics list. :) Far too many Marketers ignore this simple strategy to make lots more money. You work so very hard to earn attention, why then let your ads write checks your website can’t cash?
An additional delightful benefit: I find that getting Marketers to obsess about landing pages forces them to audit the user experience, something worth its weight in gold.
M2. Put up or shut up time for your social media strategy.
99.999% of corporate social media participation yields nothing.
Your CMO wants people to love your brand and organically amplify its goodness. It genuinely is a good thought. Except, a cursory glance at your social contributions show nothing of that sort over the last three years.
So, why are you spending all that money?
I recommend using that money to buying your team iPhones every Friday, I assure you that'll have a positive ROI.
Or. Focus on social media primarily as a paid media strategy. Bring the same discipline to the application of accountability to social media ads that you bring to your Display or Video ads anywhere on the web.
Here are five brand and five performance metrics that'll be your BFFs in 2019, as you social strategy lives up to that now famous mantra: Show me the money!
M3. Keep control of creativity, give up control of the creative.
Machines are much better at optimizing the latter for short or long term.
(For now) You are still better at the former – do lots of it, then hand it over to smart algorithms.
It is hard, especially for creative types who confuse creativity with creative. But, with every passing day you are harming your bottom-line more if you don’t follow the formula above.
Also consider the Machine Learning opportunities for Marketing beyond creative.
Aim to shift 25% of your marketing budgets in 2019 to opportunities that are powered by ML algorithms and rejoice at the boost in profits that results.
M4. TV works, solve for each factor that drives success.
Most TV campaigns are sold and bought based on reach (GRPs FTW!).
In my experience you should optimize for reach AND one overarching story AND creative consistency AND ensure each successfully tested creative has enough frequency to wear-in.
And, if you can't solve for three ANDs… Shift money to max out the Performance Digital opportunity, then with the left over money buy every person in your team – and at your agency – a new car. Your TV budget is big enough , and trust me when I say that giving out a new car will have very high motivational and bottom-line ROI.
M5. Seek to understand the customer journey.
What drives the first purchase? What drives the second? What drives the support calls in between? What does using the product really, really feel like? What drives advocacy?
All advertising that fails does so because the Marketer behind it understands only one sliver of the experience, then solves for that sliver with heart-breaking short-term focus.
When the Marketer understands the answers to the above questions, it influences the creative, it influences targeting, it influences retail store displays, it influences frequency, it influences product design, it influences…. it changes everything. Including profits.
Journeys are better than tinder dates.
6. Solve for intent. It is more possible and more critical with every passing day.
See-Think-Do-Care is a great intent-centric business framework, if I may say so myself, for challenging your current marketing strategy.
What intent is your current marketing content (tv, digital, ads, emails) targeting? What happens once your ads meet that intent? What meaningful content are you publishing, on and offline, to engage audiences before and after the BUY NOW (!) moment? Is your measurement aligned with the intent your marketing is targeting, or are you judging a fish by its ability to climb a tree? How do you know?
Shifting to See-Think-Do-Care is the single biggest force multiplier when it comes to your marketing. Help shift your organizational thinking to the current century in 2019.
M7. Your marketing budget allocation can be improved anywhere from 50% to 50,000%.
Allocating budgets is the hardest decision a Senior Marketer will make. Most will use strategies like Digital had 27% of budget last year, this year we should do between 28 and 30%. History, gut-feel, inter-company-politics, etc. are primary reasons why this silly mindset is pervasive across companies.
A better way? Profitable opportunity size.
I don't think you can argue with the first part: Invest where you make more profit. The second part takes a bit more work. It comes from plotting diminishing margin curves with confidence intervals. In English: How high can the investment goes before every $1 you invest returns less?
You are a Marketer, so it's unlikely that you'll plot these curves. Make it a priority for your Analytics team to do so; without them massive chunks of your budget is being flushed.
(Also, see obsession #10 on the Analytics list.)
M8. A grandmother's Marketing strategy for grandmothers only.
A bit provocative, but I want to challenge how most Marketers just make little tweaks to their strategy. The bigger the company, the more that this pernicious problem exists. Don't let that be you, and allow me to share two views that'll challenge your reality.
Here's the average time spent per day by US adults with media devices…
My humble description of a "grandmother's marketing strategy" is the bar on the right (65+).
It is eminently sensible for our marketing for our fellow 65+ aged Earthlings to be reflective of the implications of that right-most bar.
The problem arises when our entire marketing strategy is an extension of that right-most bar. For our entire marketing strategy to be structured on that 6:55 you see above, when our products and services are not 65+ centric is… A bit silly. Perhaps even reflective of failing our fiduciary duty.
Note the difference in total media consumption (time, place, device, more). Note the products and services your company currently offers. Reflect on this: How misaligned is your current marketing strategy?
I get really excited about something super-cool, but subtle, in the data above: The implication of the difference between active vs. passive consumption!
The difference between leaning-back and letting content wash over us vs. leaning-in and pulling content you desire is huge. It dramatically changes what your marketing should be solving for (beyond the obvious investment alignment by platforms issue).
One more reality-check for your 2019 Marketing strategy: Here's a helpful deep drive into the shifts in consumption of TV across US adults – in just six years (!!)…
This possibly explains why Toyota's entire Marketing strategy seems to be TV-centric (with the incredible frequency of 48 per day per person here in the bay area!). It seems Toyota is only trying to sell cars to 65+ (whose TV watching has actually increased).
In 2019, resolve to align your marketing strategy with your 1. products 2. goals 3. audience, and 4. amount of expressed intent on the platform.
Credits: Originally created by Sara Fischer of Axios, the first graph is via my buddy Thomas Baekdal's newsletter. 100% of you need to sign up for it. The second chart is from the lovely team at The Economist.
M9. Suck less more.
Every campaign you are currently executing can be made to suck less – especially if you think end-to-end experience.
Ex: Expedia's emails are so long they always trigger "[Message clipped] View entire message." Suck less and maybe use my past behavior to send shorter emails so I know you care about me?
Ex: Nordstrom sends me one email a day with exclusive deals – how many clothes do they think I need? Suck less and maybe send me one a month? Or, base it on shopping patterns in store to deliver delight and not just a deal?
Ex: Macy's email I just received (titled "Resolution #1: get an extra 20% off before it ends") has promotions for Women, Men, Shoes, Bed & Bath, Kids, Juniors, Jewelry, Plus Sizes, Handbags, Home, Kitchen, Beauty. All above the fold. Below the fold: Large pictures with promotions for White Bedding, Biggest Underwear, Biggest Mattress (yes again), Best Face Forward, 25% off Adidas, Macy's presents the Edit, Fresh Pastels (the image does not make clear what this is), Free, Fast Pickup. PHEW! This can be unsucked at so many levels, with just a little bit of love and focus.
Ex: Even really good programs can use sucking less. Companies like Google and Microsoft have so many divisions. Each team/department optimizes for itself, emails are pretty good, hence each thinks they are doing really well. But, if you flip the lens to me – the recipient – I get a lot of email from each company. I wish someone at G/M would track Emails Sent/Humans Sent To, and reflect on the sad reality. It would create a culture of Marketing with me at the center instead of a company department – you can imagine the benefits.
I'm using email marketing as an example of activating the power of suck less because I love email marketing. It is an effective and profitable strategy. It has loads of behavioral data available. It needs a comparatively small team to execute well. Yet see how much opportunity there is to suck less at even the largest companies.
Substantially bigger opportunities to suck less exist in all other Marketing you are doing. TV. Print. Radio. Display (omg, sooooo much opportunity!). Video. Website. Mobile app. Everything else.
All you need to do is take a quick peek under the covers.
Your 10x goal for 2019: For every $1 invested in chasing a shiny object (VR ads! Influencer marketing!!!), invest $10 in sucking less in existing large clusters of your Marketing.
Profits that follow will also be that lopsided.
One last bit, culture eats strategy for breakfast. Create a quarterly Most Unsucked Team award, and celebrate this dimension of success. Incentives matter.
M10. Bring your great taste and expectations to work.
You can easily recognize when something is mediocre – even when others put lipstick on the pig and run it around the organization as the greatest success of the month.
You know what exceptional looks and feels like – you are not just a Marketer, you are an intelligent customer.
Yet, my experience is that most Marketers stay in their lane. Often, company cultures encourage that non-beneficial behavior.
In 2019, speak up.
You have great taste. Don't leave it at home when you leave for work.
Speak up.
When you see low quality work being pushed out by your Marketing organization… Create alternative mocks. Push for your version of the brand's tag line (not the generic MBA buzzword puke-fest). Ask for a better balance between Earned-Owned-Paid marketing. Politely challenge your Leader's assertion that creative x is better because he feels like it will be. Recommend experimenting with reckless ideas, instead of directly putting 30% of the budget on them. If you see lipsticked pigs being paraded around as exceptional examples, humbly, privately, flag the corrosive implication on culture to the most senior leader who'll listen to you.
Speak up.
You deserve to be heard.
When you speak, it'll give others around you the courage to speak up as well. Smart people tend to run in packs.
That’s it. :)
A slight repetition: Reflect deeply on the impact of the 10 x 2 obsessions in your unique business environment. Then, distill down to a total of ten you’ll focus on in the next twelve months. Finally, put a start and expected end date for each item. If you get through the list, you would have contributed a step change to your company’s bottom-line, and discovered unexpected personal joy.
As always, it is your turn now.
If you had already identified obsessions for Analytics and/or Marketing for the next twelve months for yourself, what obsessions did you choose? I’m super curious. Are there a couple in my lists above that would be particularly impactful in your company? Some of my recommendations are quite straight-forward, what do you think get’s in the way of focusing on them?
Please share your obsessions, tips, culture-shifting strategies, and critique via comments below.
Thank you.
The post Deliver Step Change Impact: Marketing & Analytics Obsessions appeared first on Occam's Razor by Avinash Kaushik.
from Occam's Razor by Avinash Kaushik http://bit.ly/2VCJlor
#Digital #Analytics #Website
0 notes
Text
The Impact Matrix | A Digital Analytics Strategic Framework
The universe of digital analytics is massive and can seem as complex as the cosmic universe.
With such big, complicated subjects, we can get lost in the vast wilderness or become trapped in a silo. We can wander aimlessly, or feel a false sense of either accomplishment or frustration. Consequently, we lose sight of where we are, how we are doing and which direction is true north.
I have experienced these challenges on numerous occasions myself. Even simple questions like “How effective is our analytics strategy?” elicit a complicated set of answers, instead of a simple picture the CxO can internalize. That’s because we have to talk about tools (so many!), work (collection, processing, reporting, analysis), processes, org structure, governance models, last-mile gaps, metrics ladders of awesomeness, and… so… much… more.
Soon, your digital analytics strategic framework that you hoped would provide a true north to the analytics strategy question looks like this…
The frameworks above cover just one dimension of the assessment (!). There is another critical framework to figure out how you can take your analytics sophistication from wherever it is at the moment to nirvanaland.
A quick search query will illustrate that that looks something like this…
It is important to stress that none of these frameworks/answers exist in a vacuum.
Both pictures above are frighteningly complex because the analytics world we occupy is complex. Remember, tools, work, processes, org structure, governance models, last-mile gaps, metrics ladders of awesomeness, and… so… much… more.
The Implications of Complexity.
There are two deeply painful outcomes of the approaches you see in the pictures above (in which you’ll also see my work represented as well).
1. Obvious:
No CxO understands the story we are trying to tell – or, even the fundamentals of what we do in the world of analytics. Therefore, they are inclined to remain committed to faith-based decision-making and continue to starve analytics of the attention and investment it deserves.
2. Non-obvious:
Leaders of analytics organizations do not truly appreciate the wonderful effectiveness, or gross ineffectiveness, of their analytics practice (people, process, tools). You see… None of the currently recommended frameworks and maturity models aids analytics leaders in truly understanding the bottom line impact of their work. The result is analytical strategies that are uninformed by reality, and driven new tool features, random expert recommendations and shiny objects (OMG we have to get offline attribution!).
When one grasps these two outcomes – blind business leaders, blind analytics leaders – it is simply heartbreaking.
Simplifying Complexity.
The dilemma of how to simplify this complexity, to create sighted business and analytics leaders, has lingered with me for quite some time. I’ve intended to create a simple visual that absorbs the scale, complexity and many moving parts.
On this blog, you’ve seen numerous attempts by me to remedy the dilemma. To name a few: Digital Marketing & Measurement Model | Analytics Ecosystem | Web Analytics 2.0. Each aimed to solve a particular dimension, yet none solved the heartache completely. Especially for the non-obvious problem #2 above.
The hunger remained.
I wanted to create a visual that would function as a diagnostic tool to determine if you are lost, trapped in a silo or wandering aimlessly. It would help you realize the extent to which analytics impacted the business bottom line today, and what your future analytics plans should accomplish.
Then one day, a magic moment.
During a discussion around planning for measurement, a peer was struggling with a unique collection of challenges. He asked me a couple of questions, and that sparked an idea.
I walked up to the whiteboard, and excitedly sketched something simple that abstracted away the complexity – and yet preserved the power of smarter thinking at the same time.
Here’s the sketch I drew in response:
Yes, it was an ugly birth. But, to me, the proud parent, it was beautiful.
It took a sixteen hour direct flight to Singapore for the squiggly sketch to come to life – where else, in PowerPoint!
The end result was just five slides. As the saying goes: It's not the ink, it's the think.
I want to share the fully fleshed out, put into practice and refined, version of those four slides with you today. Together, they’ll help you fundamentally rethink your analytics practice by, 1. understanding data’s actual impact on your company today and, 2. picking very precise and specific things that should be in your near and long-term analytics plans.
The Impact Matrix.
To paint a simple picture of the big, complicated world of analytics, the whiteboard above shows a 2×2 matrix.
Each cell contains a metric (online, offline, nonline).
The business impact is on the y-axis, illustrated from Super Tactical to Super Strategic.
The time-to-useful is on the x-axis, illustrated from Real-Time to 6-Monthly.
Before we go on… Yes, breaking the x-axis into multiple time segments creates a 2×5 matrix, and not a 2×2. Consider that to be the price I’ve paid in order to make this more actionable for you. :)
Diving a bit deeper into the y-axis… Super Tactical is the smallest possible impact on the business (fractions of pennies). Super Strategic represents the largest possible impact on the business (tens of millions of dollars).
The scale on the y-axis is exponential. You’ll notice the numbers in light font between Super Tactical and Super Strategic go from 4 to 10 to 24 to 68 and onward. This demonstrates that impact is not a step-change – every step up delivers a massively higher impact.
Diving a bit deeper into the x-axis… While most data can be collected in real-time now, not all metrics are useful in real-time.
As an example, Impressions can be collected in real-time and they can also become useful in real-time (if actioned, they can have a super tactical impact – fractions of pennies). Customer Lifetime Value on the other hand takes a long time to become useful, over months and months (if actioned, it can have a super strategic impact on the business – tens of millions of dollars).
Here is a representation of these ideas on the Impact Matrix:
[You can download an Excel version of the Impact Matrix at the end of this post.]
Impressions can be used in real-time for decision-making by your display, video and search platforms (e.g., via automation). You can report Gross Profit in real-time, of course, but doing so is almost entirely useless. It should be deeply analyzed monthly to yield valuable, higher impact actionable insights. Finally, Lifetime Value will require perhaps the toughest strategic analysis, from data accumulated over months, and the action takes time to yield results – but they are magnificent.
Pause. Reflect on the above picture.
If you understand why each metric is where it is, the rest of this post will fill you with euphoric joy rarely experienced without physical contact.
The Impact Matrix: A Joyous Deep Dive.
In all, the Impact Matrix contains 46 of the most commonly used business metrics – with an emphasis on sales and marketing. The metrics span digital, television, retail stores, billboards, and any other presence of a brand you can think of. You see more digital metrics because digital is more measurable.
Some metrics apply across all channels, like Awareness, Consideration and Purchase Intent. You’ll note the most critical bottom line metrics, which might come from your ERP and CRM systems, are also included.
Every metric occupies a place based on business impact and time of course, but also in context of other metrics around it.
Here’s a magnified view that includes the bottom left portion of the matrix:
Let’s continue to internalize impact and time-to-useful by looking at a specific example: Bounce Rate. It’s in the row indicating an impact of four and in the time-to-useful column weekly. While Bounce Rate is available in real-time, it is only useful after you’ve collected a critical amount of data (say, over a week).
On the surface, it might seem odd that a simple metric like Bounce Rate has an impact of four and TV GRPs and % New Visits are lower. My reason for that is the broader influence of Bounce Rates.
Effectively analyzing and acting on Bounce Rates requires the following:
* A deep understanding of owned, earned and paid media strategies.
* The ability to identify any empty promises made to the users who are bouncing.
* Knowing the content, including its emotional and functional value.
* The ability to optimize landing pages.
Imagine the impact of those insights; it is well beyond Bounce Rates. That is why Bounce Rate garners more weight than Impressions, Awareness and other common metrics.
When designating a metric as a KPI, this is your foremost consideration: depth of influence.
With a better understanding of the Impact Matrix, here’s the full version:
[You can download an Excel version of the Impact Matrix at the end of this post.]
As you reflect on the filled out matrix, you’ll note that I’ve layered in subtle incentives.
For example, if you were to compute anything Per Human, you would need to completely revamp your identity platforms (a strategy I’ve always favored: Implications Of Identity Systems On Incentives). Why should you make this extra effort? Notice how high those metrics sits on the business impact scale!
Other hidden features.
The value of voice of customer metrics is evident by their high placement in context of the y-axis. Take a look at where Task Completion Rate by Primary Purpose and Likelihood to Recommend are, as an example. They are high in the hierarchy due to their positive impact on both the business and the company culture – thus delivering a soft and hard advantage.
You’ll also note that most pure digital metrics – Adobe, Google Analytics – sit in the tactical bottom line impact. If all you do day and night is just those metrics, this is a wake-up call to you in context of your actual impact on the company and the impact of that on your career.
At the top-right, you’ll discover my obsession with Profit and Incrementality, which form the basis of competitive advantage in 2018 (and beyond). Analyzing these metrics not only fundamentally changes marketing strategy (think tens of millions of dollars for large companies); their insights can change your company’s product portfolio, your customer engagement strategies and much more.
The matrix also includes what is likely the world’s first widely available machine learning-powered metric: Session Quality, which you’ll find roughly in the middle. For every session on your desktop or mobile site, Session Quality provides a score between 1 and 100 as an indication of how close the visitor is to converting. The number is computed based on a ML algorithm that has learned from deep analysis of your user behavior and conversion data.
Pause. Download the full resolution version of the picture. Reflect.
It is my hope that the placement of each of the 46 metrics will help you add metrics that might be unique to your work. (Share them in comments below, add to our collective knowledge.)
With a better understanding of the matrix, you are ready to overcome the two problems that broke our hearts at the start of the post – and do something super-cool that you did not think we might.
Action #1: Analytics Program Maturity Diagnostic.
Enough theory, time to some real, sexy, work.
The core driver behind creation of the Impact Matrix was the non-obvious problem #2: How much does your analytics practice matter from a bottom line perspective?
YOU matter if you have a business impact. You’ll have a business impact if your analytics practice is sophisticated enough to produce metrics that matter. See the nice circular reference?
:)
In our case we measure maturity not by evaluating people, process, and layers upon layers of tools, rather we measure maturity by evaluating the output of that entire song and dance.
Answer this simple question: What metrics are most commonly used to make decisions that drive actual actions every week/month/more?
Ignore the metrics produced as an experimental exercise nine months ago. Ignore the metrics whose only purpose is to float along the river of data pukes. Ignore the metrics you wish you were analyzing, but don’t currently.
Reality. Assess, reality. No point in fooling yourself.
Take the subset of metrics that actively drive action, and change the font color for them to green in the Impact Matrix.
For a large European client with a multi-channel existence, here’s what the Impact Matrix looked like after this honest self-reflection:
More of the digital metrics are green, because there are more digital metrics period. You can see the company’s marketing strategy spans television and other offline advertising, including retail.
You’ll likely recognize many of these metrics as the one that your analytics practice outputs every day. They represent the result of a lot of hard work by the company employees, and external analytics partners.
We are trying to answer the how much does the analytics practice matter question. You can see that more sharply now.
For this company most green metrics cluster in the bottom-left quadrant, with most having an impact of ten or under (on a y-axis scale of 1 to a ). There is one clear outlier (Nonline Direct Revenue – a very difficult metric to compute, so hurray!)
As every good consultant know, if you have a 2×2 you can create four thematic quadrants. In our case the four quadrants are called Solid Foundation, Intermediate, and Advanced:
For our company, the maturity of the analytics practice fit mostly in the Solid Foundation quadrant.
Is this a good thing?
It depends on how long the analytics practice has been around, how many Analysts the company has, how much money it has invested in analytics tools, the size of their agency analytics team, so on and so forth.
If they have a team of 50 people spending $18 mil on analytics investment each year, over the last decade, with 12 tools and 25 research studies each year… You can now infer that this is not a good thing.
Regardless, the Impact Matrix now illuminates clearly that highly influential metrics are underutilized. These are the metrics that facilitate deeper thought, patience and analysis to deliver big bottom line impact.
Recommendation Uno:
Conduct this exercise for your own company. Identify the metrics actively being used for decision-making. Which quadrant reflects the maturity of your analytics program? With the investment in people, process, tools, and consultants, are you in a quadrant where your bottom line impact is super strategic?
Recommendation Dos:
Identify your target quadrant. In this instance the company could move bottom-right and then up. They could also move top-left and then top-right. The choice depends on business strategy and current people, process, tools reality. This should be obvious; you always want the Advanced quadrant lit up. But, you can’t go from Beginner to Advanced directly – evolution works smarter than revolution. (If your Solid Foundation quadrant is not lit up, do that first.)
Recommendation Très:
Create a specific plan for the initiatives you need to undertake to get to your next desired quadrant. You’ll certainly need new talent, you’ll need a stronger strategic leader (less ink, more think), you’ll need to identify specific analytics projects to deliver those metrics, and you’ll most definitely need funding. Divide the plan into six-month segments with milestones for accountability.
The good news is that it is now, finally, clear where you are going AND why you are going there. Congratulations!
Recommendation Cuatro:
Start a cultural shift. Share the results of your assessment, the green and black reflection of the current reality, with the entire company. Inspire each Marketer, Finance Analyst, Logistics Support Staff, Call Center Manager, and every VP to move one step up or one step to the right. If they currently measure AVOC, challenge them to move to Unique Page Views or Click-thru Rate. It will be a small challenge, but it will improve sophistication and, as you can see in the matrix, the impact on the bottom line.
Most companies wait for some Jesus-Krishna hybrid to descend from heaven and deliver a glorious massive revolution project (overnight!). These never happen. Sorry, Jesus-Krishna. Instead, what it takes is each employee moving a little bit up and a little bit to the right while the Analytics team facilitates those shifts. Small changes accumulate big bottom line impact over time.
So. What’s your quadrant? And, what’s your next right or next up move?
Action #2: Aligning Metrics & Leadership Altitude.
When offered data, everyone wants everything.
People commonly believe that more data means better results. Or, that if an Agency is providing a 40 tab, font size 8, spreadsheet full of numbers that they must have done a lot of work – hence better value for money. Or, a VP wants two more histograms that represent seven dimensions squeezed into her one page dashboard.
If more data equaled smarter decisions, they would be peace on earth.
A core part of our job, as owners of the analytics practice, is to ensure that the right data (metric) reaches the right person at the right time.
To do so, we must consider altitude (aka the y-axis).
Altitude dictates the scope and significance of decisions. It also dictates the frequency at which data is received, along with the depth of insights that need to accompany the data (IABI FTW!). Finally, altitude determines the amount of time allotted to discuss findings.
Managers have a lower altitude, they are required to make tactical decisions – impacting say tens of thousands of dollars. VPs have a higher altitude, they are paid a ton more in salary, bonus and stock, because they carry the responsibility for making super strategic decisions – impacting tens of millions of dollars.
This problem has a beautifully elegant solution if you use the Impact Matrix.
Slice the matrix horizontally to ensure that the metrics delivered to each leader are aligned with their altitude.
[You can download an Excel version of the Impact Matrix at the end of this post.]
VPs sit at decision making that is squarely in the Super Strategic realm – on our scale ~40 and higher. This collection of metrics power heavy decisions requiring abundant business context, deep thinking and will influence broad change. Analysts will need that time to conduct proper analysis and obtain the IABI.
You can also see that nearly all metrics delivered to the VPs arrive monthly or even less frequently. Another reflection of the fact that their altitude requires solving problems that will connect across orgs, across incentives, across user touch points, etc.
So. Are the metrics on your VP Dashboards/Slides the ones in Super Strategic cluster?
Or. Is your analytics practice such that your VPs spend their time making tactical decisions?
Below the VP layer, you’ll see metric clusters for slightly less strategic impact on the company bottom line for Directors. The time-to-useful also changes on the x-axis for them. Following them is the layer for managers, who make even more frequent, tactical decisions.
The last layer is my favorite way to improve decision making: Removing humans from the process. :)
Recent technical advancements allow us to use algorithms – machine learning – to automate decisions made by metrics that have a Super Tactical impact. For example, there is no need for any human to review Viewability because advanced display platforms optimize campaigns automatically against this metric. In fact an expensive human looking at reports with that metric will only slow things down – eliminating the fractions of penny impact that that metric delivers.
Recommendation Cinco:
Collect the dashboards and main reports created by your analytics practice. Cluster them by altitude (VP, Directors…). Identify if the metrics being reported to each leadership layer are the ones being recommended by the Impact Matrix.
For example: Does your last CMO report include Profit per Human, Incremental Profit per Non-line Channel, % Contribution of Non-line Channels to Sales? If yes, hurray! Instead, if they are reporting Awareness, Consideration, Intent, Conversions, Bounce Rate… Sad time. Why would your CMO use his or her valuable time making tactical choices? Is it a culture problem? Is it a reflection of the lack of analytical savvy? Why?
Put simply, the big and complicated is not so big and not so complicated. This simple analysis will help identify core issues that are stymieing the contribution data can make to smarter, faster, business success.
Recommendation Seis:
Kick off a specific initiative to tackle automation. If data is available in real-time and useful in real-time, there are algorithms out there that can make decisions for humans. If there is a limitation, it is all yours (people, bureaucracy, connection points, etc.).
For the other layers, action will depend on what the problem is. It could require new leadership in the analytics team, it could require a shift in company culture, or it could require a different engagement model across layers (managers, directors, VPs). One thing adjusting the altitude will certainly require: Change in how employees are compensated.
As you notice above, the strength of the matrix is in it’s ability to simplify complexity. That does not mean that you don’t have to deal with complexity – you can be more focused about it now!
Action #3: Strategy for Analytical Effort.
One more slicing exercise for our matrix, this time for the analytics team itself.
Analytics teams face a daunting challenge when figuring out what type of effort to put into tackling the fantastic collection of possibilities represented in the Impact Matrix.
That challenge is compounded by the fact that there is always too much to do and too few people to do it with. Oh, and don’t get me started on time! Why are there only 24 hours in a day??
So, how do we ensure that each has an optimal analytical approach?
Slice the matrix vertically along the time-to-useful dimension…
[You can download an Excel version of the Impact Matrix at the end of this post.]
For any metric that is useful in real-time, we have to unpack the forces of automation. Campaigns can be optimized based on real-time impressions, clicks, visits, page views, cost per acquisition etc. We need to stop reporting these, and start feeding them into our campaign platforms like AdWords, DoubleClick etc. With simple rules – ranges mostly – automation platforms can do a better job of taking action than humans.
If you are investing in machine learning talent inside your team, even narrowly intelligent algorithms they build will learn faster and surpass humans quickly for these simple decisions.
With the day-to-day sucking of life spirit reduced, tactical impact decisions automated, the analytics practice has time to focus on metrics that have a longer time-to-useful and need deeper human analysis to extract the IABI.
For metrics available weekly or within a few weeks, reporting to various stakeholders (mostly Managers and Directors) should adequately inform decisions. Use custom alerts, trigger threshold targets and more to send this data to the right person at the right time. For weekly time-to-useful metrics, your stakeholders have enough tactical context that you don’t need to spend time on deep analysis since the metrics inform the tactical decisions.
More role clarity, a thoughtful shift of the burden to the stakeholders, and more free time to focus on what really matters.
For where time-to-useful is in the month range, you are now truly heading into strategic territory. Reflect on the metrics there – challenging, strategic, Director and VP altitude. It is no longer enough to just report what happened, you need to identify why it happened and what the causal impact is for the why factors. This will yield insights that will have millions of dollars of potential impact on the company. That means, you’ll need to invest in ensuring your stories have more than just insights but also include specific recommended actions and predicted business impact. Amazingly, you’ll have just as much text as data in your output (that’s how you know you are doing it right!).
Finally, we have the pinnacle of analytics achievement. Our last vertical slice includes metrics that measure performance across customer segments, divisions and channels, among other elements. This is where meta-analysis comes into play, requiring even more time, with even more complex analytical techniques that pull data into BigQuery or similar environments where you can do your own joins, unleash R, use statistically modeling techniques (hello random forests!) to find the most important factors affecting your company’s performance.
The distribution of your analytical team’s effort across these four categories is another method of assessing maturity as well as ensuring optimal impact by the precious few analytical resources. For example: If most of your time is occupied by providing data to decision-makers for metrics in the Automate and Reporting vertical slices, you are likely in the beginner stage (and not having much impact on the business bottom line).
Recommendation Siete:
Find an empty conference room. Project all the work your team has delivered in the last 30 days on the screen. Cluster it by Automated, Reporting, Analysis and Meta-Analysis. Roughly compute what percentage of the team’s time was spent in each category. What do you see? Is the distribution optimal? And, are the metrics in each cluster the ones identified by the Impact Matrix?
The answers to these questions will cause a fundamental re-imagination of your analytics practices. The implications will be deep and wide (people, process, tools). That is how you get on the road to true nirvanaland.
#sisepuede
At the core of the Impact Matrix is the only thing that matters: the business bottom line. Using two simple dimensions, impact and time-to-useful, you can explain simply three unique elements of any successful analytics practice. The reflections are sometimes painful, but bringing them to light allows us to take steps toward systematic improvement of our analytical practice.
That’s the power of a 2×2 (or a 2×5)!
Here’s an Excel version of the Impact Matrix for your personal use.
As always, it is your turn now.
When your CMO asks, “How effective is our analytics strategy?”, what’s your answer? How simply can you frame it? What are the primary inputs to your near and long-term analytics evolution plans? If your VPs are getting the metrics in the Advanced quadrant, what strategies have been effective in getting you there? If you’ve successfully implemented pattern matching and advanced classification meta-analysis techniques, care to share your lessons with us?
Please share your feedback about the Impact Matrix, and answers to the above questions, via comments below. I look forward to the conversation.
Thank you.
The post The Impact Matrix | A Digital Analytics Strategic Framework appeared first on Occam's Razor by Avinash Kaushik.
from Occam's Razor by Avinash Kaushik https://ift.tt/2LjYvNx
#Digital #Analytics #Website
0 notes
Text
6 Tips for Building Your Marketing Career
You’ve read the books. You’ve watched the videos.
You’re convinced that you belong in marketing.
Now, all you have to do is put that resume out there and wait, right?
Unfortunately, that won’t cut it anymore. Getting into marketing is easy. But how do you make it big?
That’s a different ballgame with its own set of rules.
And when you look at the projected growth rates for the marketing field – an increase of up to 10% by 2026 – you can’t afford to not get savvy with those rules.
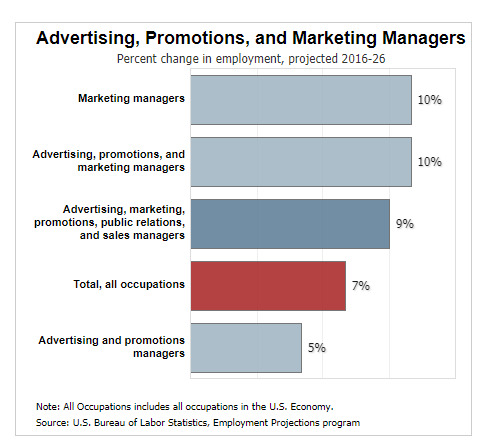
That growth might be good news for the economy, but it can create challenges for the beginner marketer.
Luckily, there are a few tricks you can use to get the edge on your competition.
Here’s a peek into my rulebook for crushing it in marketing. Use these strategies to boost your marketing career and leave the competition behind.
1. Improve your communication
Whether it’s social monitoring tools, voice search, or multi-channel marketing automation, technology regularly changes the way we reach our audiences.
But it’s a lot to keep up with.
71% of marketing executives use six or more types of marketing technology in their day-to-day lives.
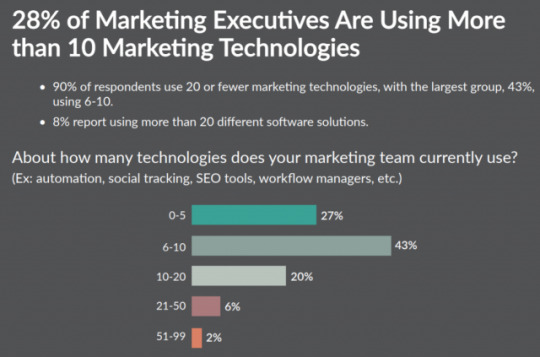
Trying to master one, let alone six, can be daunting and downright impossible for new marketers.
Fortunately, there’s an easy solution:
Go back to the basics and then dominate them.
No matter what new technology rolls out tomorrow, your basic communication skills are always in demand.
For proof, take a look at the top skills employers want when hiring fresh graduates for entry-level positions:
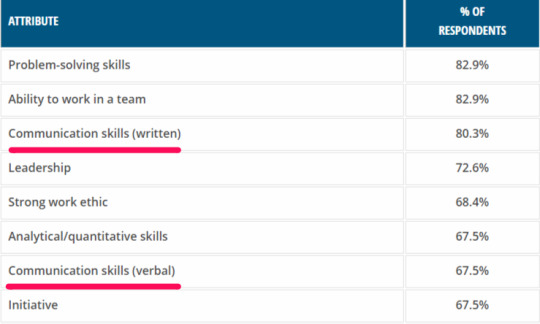
Over 80% of employers want to see written communication skills, and under 70% want verbal skills.
Comparatively, less than 60% of survey respondents highlighted technical skills as a top attribute. Less than 50% are looking for computer-specific skills.
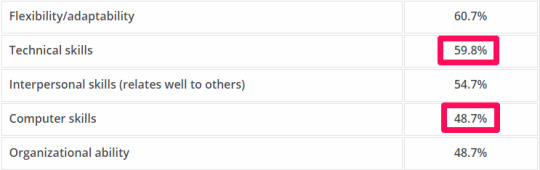
That’s all great news for new marketers.
Whether you’re a fresh graduate or you’re making a career transition, you can develop communication skills on your own time.
And you can do it without spending any money or with only a small financial investment.
These skills will make you a better marketer. After all, what is marketing if not applied communication? And, it will make you a more employable in any industry.
It’s a win-win, right?
But how do you develop your fundamental communication skills?
It’s going to sound a little cheesy, but the answer that shows up in professional manuals is the same:
To become a better communicator, communicate more. And, specifically, write more.
As you practice your writing, let me give you a few resources to help you fine-tune your writing skills.
First of all, you should check out My Copyblogger.
Besides their regularly-updated blog, Copyblogger offers e-training courses, webinars, and resources through their My Copyblogger membership.
Signing up gives you access to exclusive e-books that help you develop your written communication and marketing skills.
Look at this top-level preview of their e-book releases for members:
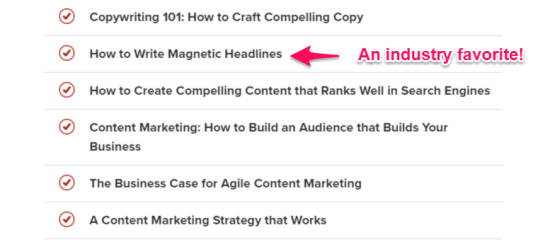
With all of the e-books they offer, both long and short, Copyblogger is a killer resource for any marketer wanting to improve their writing.
Next, Grammarly is a must-have tool.
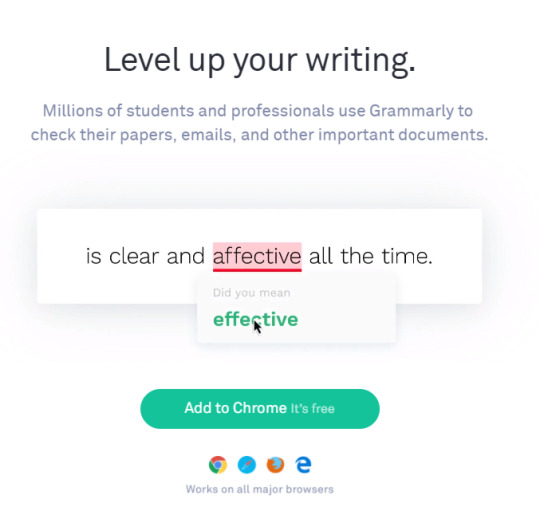
Grammarly is part proofreader and part personal writing assistant.
It offers more help than just catching typos. It uses contextual analysis to understand what you’re trying to say, and then it helps you say it better.
It also tracks your progress and shows how your skills stack up against other Grammarly users so you can see the trends.
In turn, that makes it easier to figure out what you need to focus on improving.
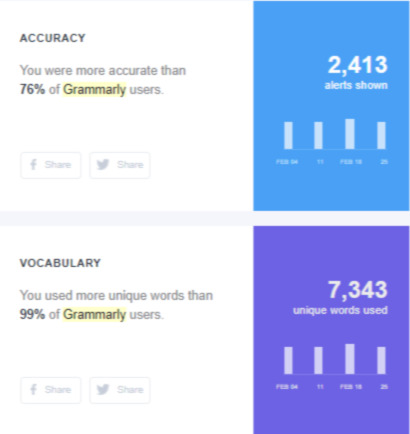
It also tracks your total word count, and it will show you advanced errors if you’re a premium user.
Being able to track your progress isn’t merely a marketing gimmick, either. Monitoring your own progress can help you stay motivated, set realistic goals, and improve your quality.
Grammarly is probably the best all-in-one tool that you can use. But there are a couple of others worth mentioning.
The web version of Hemingway Editor is a free resource for improving your writing. It tracks passive voice, adverbs, and readability – all of which impact how your audience perceives your writing.
Count Wordsworth is also a free analysis tool helps you polish your word flow. It tracks sentence length, syllables, and pauses.
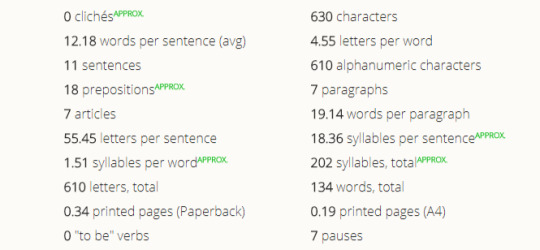
Here’s the bottom line time:
If you want to get ahead of the technology rat race, then you need to get out of it. Focus on sharpening your foundational skills like writing to help your resume stand the test of time.
2. Specialize and socialize
Thanks to significant job growth, opportunities in marketing are expanding. But so is the competition.
And competing with other marketing hopefuls means that you’re going up against a field chock-full of communication experts.
It’s a lot to stack up against on paper. If you want to separate yourself from the pack, you have to specialize your toolkit.
In a 2017 study, the top-three skills that employers desired in new marketers were digital advertising, content creation, and content strategy.
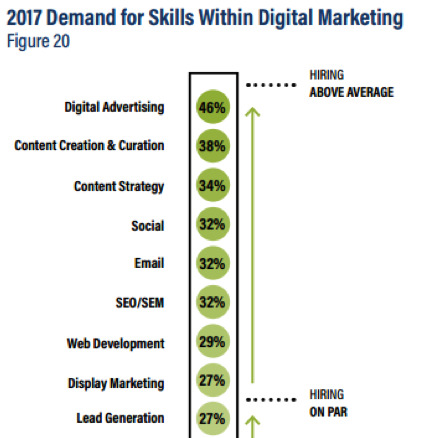
Creating content and flaunting your curation skills can go a long way toward establishing yourself as a digital marketing guru. And here’s the best part:
You can get started free.
In fact, you can even convince other marketers to spread your reputation for you. How?
Create content for other people.
Specifically, create blog posts for major publications. It’s a great way to associate yourself with industry authorities and get your name out there.
But even more importantly, it also gives you the skill that 53% of marketers list as their company’s top priority.

This is probably why so many big-time marketers are such prolific bloggers. Take a look at this sample of the blogosphere.
The Ahrefs blog is full of data-rich (and often original) research, making it a great place to dive into the details of marketing’s technical side.

This also helps establish the Ahrefs team as subject domain experts. Tim Soulo, for example, is a prolific writer for their blog.
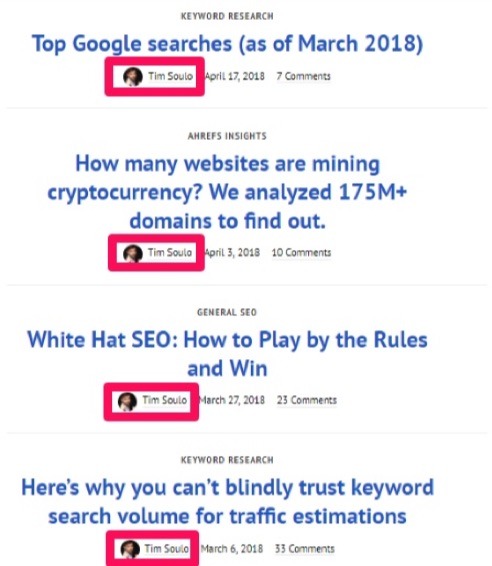
Tim doesn’t post to Ahrefs every day. But when he does, I know that he writes reliable blogs with research-heavy information about SEO.
He regularly introduces new ways of looking at data and marketing with rich technical details and an easy-to-read style.
And that alone is reason enough for you to follow him.
But his blog posts do more than get Ahrefs out there. They cement him as a quality writer and marketer.
Something he corroborates even further with his work at BloggerJet.
Do you want another real-life example of a professional making blogs (even other people’s blogs) work for them?
Look no further than Ann Handley.

Part marketing legend and part writing genius, Hadley uses her expert skills to keep her name at the top of the marketing influencer list.
Ann’s work is both witty and relatable. Her blog reframes complicated marketing concepts into easy and digestible posts. I never come away from her work without laughing and learning.
I guess you could say I’m an “annarchist.” If you want to hone your content skills, you should become one, too.

But it’s not just her razor-sharp sense of humor that keeps readers coming back for more. She’s consistent, she’s authoritative, and she doesn’t hoard her talent.
In addition to her work with MarketingProfs, she also guests posts for Entrepreneur and for Huffington Post.
If someone influential enough to author two Wall Street Journal best-sellers still guests posts for other organizations, shouldn’t you consider doing the same?
So, how do you get started with guest blogging?
Although there are a lot of avenues for publishing content as a guest, one of the easiest – and one of my favorite – ways to get started is through Medium.
Ultimately, no matter how you choose to hone your communication skills, adding authoritative pieces to your name won’t just help you sound like a better marketer.
It’ll make you look like one, too. And that brings me to the next topic:
Your portfolio.
3. Grow your portfolio
Your skills can’t grow without the opportunity to sharpen them.
But you won’t get many opportunities until you demonstrate that you already have some of the skills that you need to improve.
Because you aren’t able to secure opportunities, your skills deteriorate and don’t develop. You miss out on even more future opportunities because no one will give you one to start with.
This starts a self-defeating cycle.
In a 2017 survey, 64.5% of employers indicated they preferred hiring candidates with relevant work experience. This was even true in the case of college graduates.
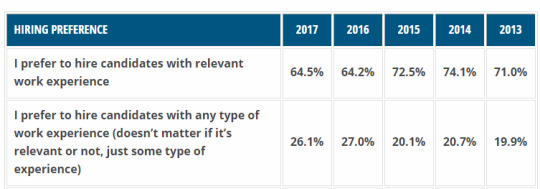
So, whether you get into the marketing field through school or Internet hustle, you need experience in order to get more experience.
That’s frustrating, right?
Fortunately, there’s an easy solution to break the cycle and make you look pretty impressive, too.
You can volunteer. Specifically, volunteer with a nonprofit.
This will help expand your network and gain professional portfolio pieces.
It also helps signal your values to future employers and commitment to social causes like education and animal welfare.
You might even meet other marketers in the process. Radish Labs, a creative agency specializing in nonprofits, regularly promotes creative volunteerism.

Are you looking for ways to volunteer and beef up your portfolio but can’t find any local opportunities? VolunteerMatch is a great directory with plenty of remote opportunities.
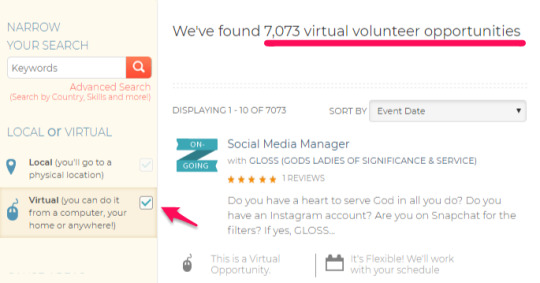
With ample opportunities to grow your portfolio and get some serious Good Samaritan street cred, what are you waiting for?
Get out there and start making a difference for others to see a difference in your career.
4. Jumpstart your network
In some industries, it’s more about who you know than what you do. But in digital marketing, it’s about both.
And if you’re an inexperienced marketer, that can create a significant obstacle to launching your career.
It’s almost a chicken before the egg problem. How do you meet the right people if you don’t already know the right people to set up introductions?
After all, according to SilkRoad’s 2017 Sources of Hire report, employee referrals still lead the way as the top avenue for new job hires.
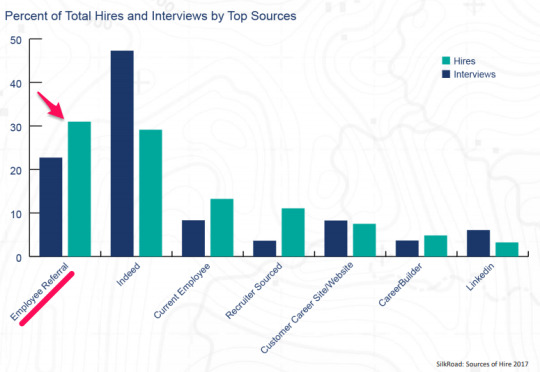
It’s the same kind of defeating cycle as the “experience without experience” conundrum I described in the above section.
You can’t grow your network because you need a network first to look reputable and gain people’s trust.
Fortunately, the solution to ending this cycle is just as simple:
Log out and look to the offline world to bolster your online network.
Are you needing to meet people in the industry? Attend local meetings and conventions and then make your connection online.
Here’s the great news:
Two of the biggest marketing conventions – INBOUND and the Growth Marketing Conference – are still on the horizon for 2018.
Hubspot backs INBOUND.
INBOUND

It includes all things marketing and selling in three strategy-packed days.
If you don’t want to commit to the sessions or their price tag, INBOUND also offers “community passes” for networking events. It’s a great option for new marketers with tight budgets.
The Growth Marketing Conference is also well worth your time.
Some of the biggest names in marketing attend the conference. It’s a two-day event full of networking events, tactical sessions, and innovative workshops.
Like INBOUND, this conference offers several tiers of participation, including access to networking and training sessions at a fraction of the full price.
Of course, one of the big downfalls of this approach is that the larger conventions tend to happen in larger cities.
But don’t worry.
Even if you can’t fit a major convention into your schedule, there are still a few other options for expanding your network.
You can host or join a local event through a service like Meetup.

This not only cuts out your travel costs but it also helps you build a local network and find – or organize – events on your own schedule.
Lastly, even if you can’t find any offline networking opportunities, there are some online options for building your credibility and network.
One solution is LinkedIn groups. Take a look at the four most popular groups below:
That’s pretty promising, right?
With three million connections possible, you should be able to find like-minded connections in no time and start growing your network.
5. Go big with data
If you want to beat the rat race, get ahead of it. And there’s no better way to get ahead than to develop some of the most in-demand skills on the job market.
And in 2018, that means you need to go big with data.
Statistics and analytics help marketers understand their audiences in a quantifiable way.
But that’s not all they can do.
Data-driven marketing techniques also help professionals make better decisions and acquire new customers.
They have the receipts to show for it, too.
Between 2016 and 2017, data-driven marketing expenditures and revenues rose to their highest ever, according to a DMA study.
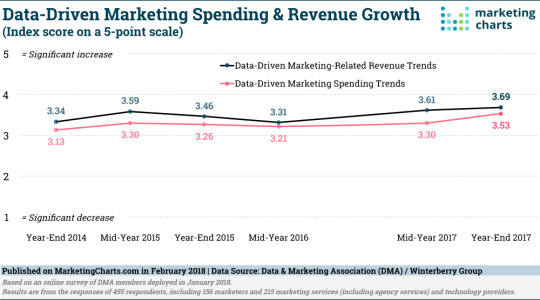
But despite this significant growth, the marketing world is still experiencing a major talent shortage.
The datasets keep expanding, but the talent pool and preparedness of organization are on the decline.
Check out this later 2018 survey about marketers’ confidence in the ability of their organizations to handle data for marketing:
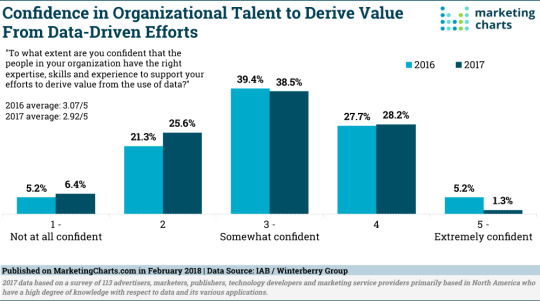
So what does this mean for your career? I can tell you in one word:
Opportunity.
With data becoming critical for marketers and business leaders across the board, there’s never been a better time to learn how to analyze data.
And thanks to the advent of several e-learning platforms, it’s never been easier, either. Here are a few of the places where you can dig into data and earn your analytic credentials from home.
Coursera offers university-grade education at an elementary school price point. Usually, courses run between four to six weeks.
Many of their courses provide free videos, and the selection for marketing analytics is huge.
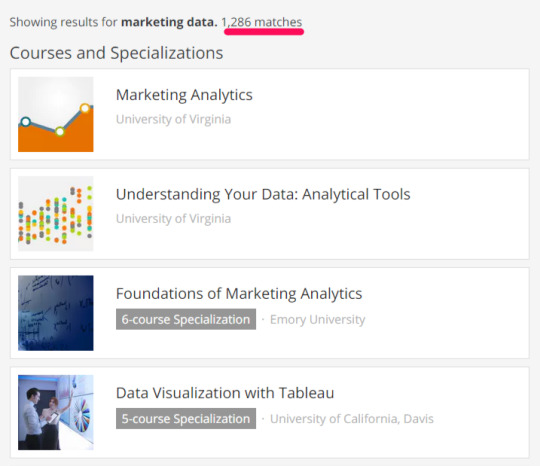
And best of all, all of their classes are fully online, and they reward certificates upon completion.
In addition to career credentials, the forum can jumpstart your network and help develop your portfolio with peers.
Are you looking for a less academic option, or do you need to set your own schedule? If so, try Lynda.com.

LinkedIn acquired Lynda.com in 2015. Now, it’s a powerful resource for learning the ins and outs of marketing, SEO, content, design, and much more.
Unlike Coursera, the lecture series on Lynda.com consists of videos and guided exercises, so you can learn entirely at your own pace.
And, while you won’t have a forum to interact with other course learners, many of the videos include guided exercise files to help you practice your skills.
Plus, thanks to the integration with LinkedIn, you can automatically display your learning paths on your profile.
Check out a preview of some of the courses they offer for data analytics in marketing.
Lynda.com has classes that range from beginner to advanced levels. It has everything you need to hone your data skills from start to finish.
Another option is DistilledU.
Some of the largest names in business like Adobe, eBay, and Capital One use DistilledU. It’s an at-your-own-pace, interactive training option for SEO marketers who want to learn more about the field.
They also offer classes for marketers of all levels. They have classes that can teach you the fundamentals of SEO.
And they have highly advanced classes, too.

This makes it a fantastic resource for marketers of any experience level.
DistilledU offers annual and monthly memberships. So, whether you want to master marketing or just get a crash course in analytics, there’s a module to fit your schedule and budget.
Similar to Lynda.com, Skillshare provides e-learning for everything from design to data science to advanced marketing.

Here are some of their course offerings that are currently popular.

Instructors provide class projects to supplement video lectures with hands-on learning, making this ideal for those of you who prefer interactive education.
In summary, no matter what platform you choose, adding data analytics to your skill set is a great way to make yourself more attractive to future employers and outshine the competition.
6. Build your branding
Finally, if you want to step outside of your competition’s shadow, you have to build your branding and build it well.
That means that, besides developing your writing skills, you need to establish a distinct visual identity.
Without one, your brand can easily get lost in the fray, especially if you’re using stock images.
Getting lost means that your audience is ignoring you. And if your audience is ignoring you, you’ll never see your marketing career reach the next level.
But getting a grip on core marketing concepts and strategies is hard enough. How are you supposed to develop branding and make yourself stand out?
And what makes a brand’s visual style distinct?
No matter what channels you’re using, consistency is key.
Take a look at Content Marketing Institute’s homepage:
Now, take a peek at their YouTube channel:

By keeping the typeface and colors consistent, they establish an easy mental link for their followers. Users know that if they see that shade of orange, they’re looking at something from Content Marketing Institute.
Here’s another example. Look at MarketingProfs’ homepage.

Now, here’s their YouTube channel.

Again, you can see consistent colors and styles of images.
This is what it boils down to:
If your social media accounts don’t share branding, you’re making it harder for people to identify you as a marketer.
If you think branding is difficult, then think again. You can start your branding by creating a logo in about five minutes.
But if you want to take it a step further and you don’t have an army of in-house designers behind you, then you can turn to freelance boards for help.
Fiverr, Upwork, and 99designs are three of the most popular platforms for finding great visuals that fit any budget.
On Fiverr, freelancers (which they call “sellers”) provide service packages with their unique skills.

One of the upsides to using Fiverr is that they offer scalable bundles. These bundles will let you get as little or much design work as you need for a predictable price.
And because buyers reach out to sellers first, you won’t receive pitches that you aren’t interested in.
But that’s also the downside.
If you’re short on time, you can’t wait for offers and let the designers come to you. That means that this may not be the best option for marketers with a tight schedule.
Upwork (formerly oDesk) is another major freelancer board with a significant design community.
After setting up a business account, you have the option of posting a job and letting the pitches come to you. You can also invite some of Upwork’s top talent to apply.
Unlike Fiverr, you typically pay by the hour or project. Freelancers submit their proposals along with their price estimations.
Upwork is ideal for both big and small budgets. It’s a great option to test the visual branding waters without making major commitments.
Lastly, 99designs is a freelancing platform that specializes in branding and product design.

They provide matching services where they fit you with a graphic designer who meets your design needs. There’s also a contest option where the community competes to win your project.
The higher price of 99designs may not be ideal for your first project. But for those ready to commit, all design contests come with a 100% money-back guarantee.
No matter where you get your designs from, consistent branding colors are key for integrating older and newer designs seamlessly.
One easy way to do that is by using Adobe’s color system.
Here’s how.
Head to Adobe Color CC.
Click on “sign in” in the top-right corner. You want to be able to save your palette to share, so it’s important to get this step out of the way first.
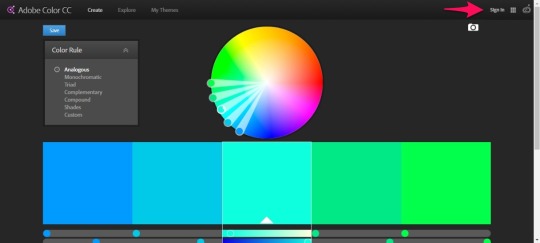
Follow the link for “Get an Adobe ID.”
Fill out the sign-up form and click the blue “sign up” button to go back to the Adobe Color CC homepage.

Once there, begin picking colors by manipulating the color wheel. Here’s the default suggestion for my orange.

To play with the auto-generated palettes, use the left-hand menu to navigate. If you want to build a custom palette, you’ll need to select the last option.
Once you have a color palette you like, click the blue save button.

It will then prompt you to name your theme.
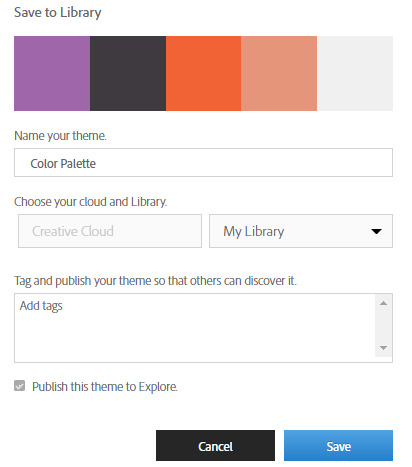
Click “save” and head over to “My Themes” using the top navigation menu.

You should now find your palette waiting in your library.
Hover over your palette to see your saving and sharing options.
Hit the download button to share your palette with future designers.
Since Adobe is the king of design suites – 90% of creative professionals use Photoshop – anyone you work with can open the palette directly in their choice program.
You can even use the same palette to customize resume templates and give your credentials the same eye candy from start to finish.
By the way, don’t forget to check out Adobe Color CC’s “Explore” option for inspiration before you go.

Ultimately, whether you use multiple freelancers or none at all, using the same color palette throughout will give your brand consistency no matter who is at the design wheel.
Conclusion
The field of marketing is expanding rapidly, and experts expect it to keep growing.
That means that you have plenty of opportunities. However, that also means that you have plenty of competition.
So, how can you stand out?
For starters, don’t get too caught up in new technology. Keeping on top of marketing technology trends as a newcomer to the industry is expensive and time-consuming.
Instead, focus on dominating your fundamental communication skills.
Next, you can separate yourself from the competition by specializing and socializing.
Create content for other industry blogs or use publications on Medium to give your name authority.
Portfolio pieces are a killer way to make your resume shine, even if they’re unpaid gigs.
Volunteer your marketing skills with a nonprofit to polish your sample pieces. Plus you’ll make a difference in the world and your career.
Networking is still a vital part of landing a job. More new hires come through employee referrals than through job boards.
Building an online network can be tricky. One way to expand your network rapidly is to look to the offline world and attend industry conventions.
Candidates with data skills are some of the most in-demand hires in any industry, marketing including. Build your analytics skills on your own time to elevate your career potential.
Branding doesn’t stop at written content. Having a distinct and consistent visual identity is key.
Even if you don’t have designers on tap, you can find great (and cheap) freelancers through platforms like Fiverr, Upwork, and 99 Designs.
Establishing a color palette keeps your branding consistent no matter who is behind the design wheel.
Adobe Color CC is a fast, easy, and free way to set up a color palette that the vast majority of creative professionals can use later.
A marketing career can be challenging to start, but it doesn’t have to be overwhelming. Follow these six strategies to give your career a boost and stay at the top of the trendline.
What strategies have you used to separate your skills from the marketing pack?
About the Author: Neil Patel is the cofounder of Neil Patel Digital.
from Search Results for “analytics” – The Kissmetrics Marketing Blog https://ift.tt/2JDdNrL
#Digital #Analytics #Website
0 notes
Text
Six Nudges: Creating A Sense Of Urgency For Higher Conversion Rates!
By every indicator available, ecommerce is continuing to grow at an insane speed. Although it may seem impossible to imagine with ecommerce already totaling up to 5% of overall commerce, there’s astronomical growth still to come.
Still, I’m heartbroken that some the simplest elements of ecommerce stink so much.
It is 2018—why are there still light gray below-the-fold add to cart buttons?
#youarekillingme
There are numerous subtle issues as well. One strategic issue is illustrated by Timbuk2.
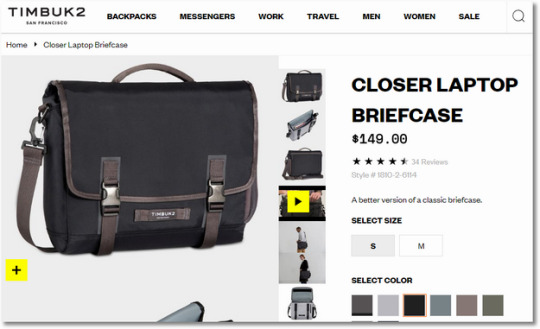
Timbuk2 pays a huge margin to its resellers to sell their messenger bags. These resellers, in turn, give a bigger cut to Amazon, who then sells the Timbuk2 bag for 30% off. Yet, when I want to pay full price on www.timbuk2.com, I have to buy a minimum of $99 to get free shipping!
I understand channel conflict, Timbuk2, but this is just plain not being hungry. You could win bigger by cultivating higher more profitable direct relationships, especially when the old world order of commerce is collapsing all around you.
And I’m ignoring the extremely light gray font reviews…on a shade grayer background!
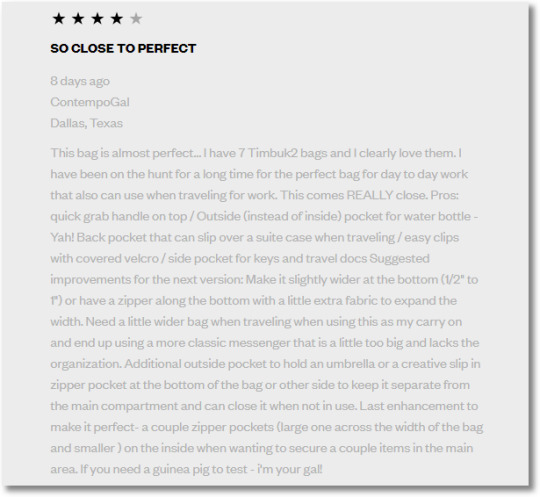
Painful.
(I really want to buy the Closer Laptop bag. The small one in Jet Black looks cool. I refused to buy it because I don’t want to reward a lack of ecommerce imagination. I am one person, I know it is not going to really hurt them, but I don’t know how else to protest a brand I love.)
Pause. Deep breath.
I do get excited about this stuff. My heart bleeds digital.
There is an ocean of opportunities when it comes to elevating ecommerce. In this post, I want to focus my passion and zero in on something that is difficult to solve for, yet immensely profitable: Inserting a sense of urgency into the shopping process.
I don’t mean: BUY IT NOW OR ELSE!
I mean developing and inserting a subtle collection of gentle nudges that can help increase the conversion rate by a statistically significant amount.
Sizing the Opportunity.
In order to have the same passion to take advantage of this magical opportunity (nudge, nudge) you’ll first want to understand how inefficient your current shopping process is.
Do two things, they’ll bring you to your knees:
1. Go look at your ecommerce conversion rate. It shows you how often you win. :) Your overall conversion rate is likely to be around 2%. You don’t need an advanced degree in math to compute that 2% winning is 98% not winning!
Do something simple. Increase current conversion rate by 25%, quantify how much increased revenue there will be. Yes, that additional $6 mil is not as hard to accomplished for an imaginative focused team – in fact you can get that from implementing half of the recommendations in this blog post.
Bonus: The best computation of conversion rate is orders divided by users (the default in your analytics tool is sessions). This will bring your conversion rate up (yea!!). Still. Big opportunity. And, yes, I did say a decade ago that you should look at the opportunity size within all your website visitors. You should. Still. The conversion headroom is massive.
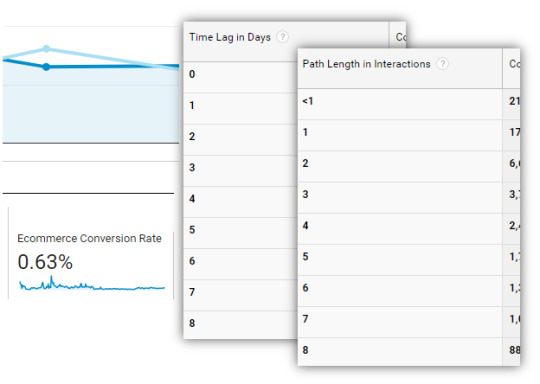
2. Go to the Multi-Channel Funnels folder in Google analytics and look at two other yummy reports: Time Lag and Path Length.
They report two dimensions of speed: How long does it take for a human to convert? How many visits does it take for a human to convert?
My preferred choice is Path Length; it is rich and actionable.
This data you’ll see, the analysis you’ll do, will scare you. It will also create a sense of urgency to do something about it!
These two recommendations will help you compute the opportunity size for your management team.
Aim for quintupling revenue, obviously, but calculating just 25% improvement will give you all the budget you need from your management to insert urgency into the shopping process. Present a yummy spreadsheet that quantifies the cost of inaction, how much money you’ll lose by not delivering a 25% improvement every week. It will be heartbreaking, and now you are ready for progress!
Welcome to Nudging.
Nudging has plenty of different definitions. Mine is simple:
A gentle incentive that creates a shift in behavior.
Another insistence of mine that you’ll note below: Nudges are based on a deep understanding of user experience. They solve for the user first, and all of the hard work is done by the company (you!).
In the long run that’ll also create a positive revenue outcome for you. Win-Win.
Below is a collection of nudges, curated from my global experiences, influenced by research and data I’ve access to.
1. In-stock status.
2. Life of current price.
3. Direct competitor comparisons.
4. Delivery times based on geo/IP/mobile phone location.
5. Social cues to the rescue.
6. Personalization. Yes, from 1995!
My goal with these recommendations is to have a big impact on your ecommerce existence, and to spark your creativity as you go out and change the world.
Let’s go have some fun nudging people.
1. In-stock status.
It mildly irritates me when sites don’t use this nudge.
How many hotel rooms, cameras, seats in a theater, are left?
Only 15 left in stock. Have that right under the price.
How about: Last run! Be one of the last 9 people to own this credenza design.
OMG! Click, click, click!
Or, 1 in-stock in the REI store next to your office.
Nudge. Nudge.
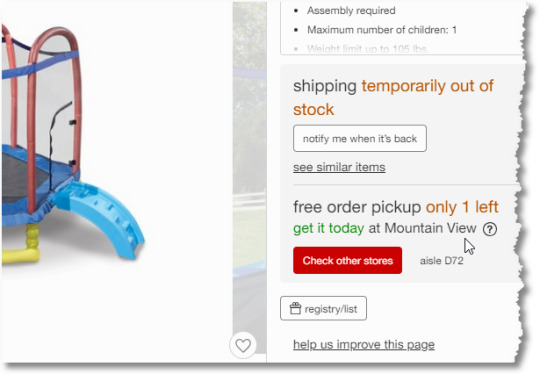
I’ll admit that you need to have a well-integrated logistics platform to make these ideas work. But given the decade we are in, if you have not already done that, you are facing an existential crisis. Please stop reading this post, pull in your agency and internal teams urgently to figure out how to dig your company out of this deep hole.
If you have a well-integrated logistics platform already, then all I’m asking for is this: lock your online and offline IT folks in a nice Four Seasons suite for 72 hours with your User Researchers, and BAM! Money will start falling from the sky.
Speaking of the Four Seasons, consider how sad their nudging strategy is vs. the one that booking.com has on display:
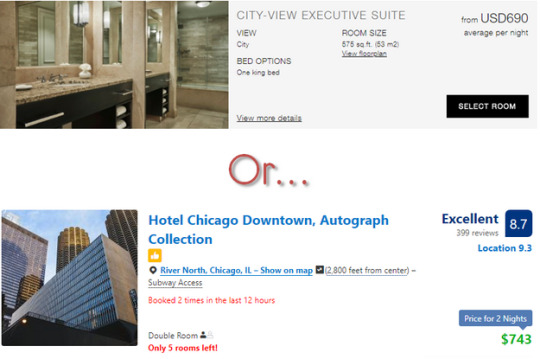
All the data you need for this nudge… You already have. That’s what makes the Four Seasons strategy, and that of most sites, so heartbreaking.
Convert the inventory status into a conversion boosting nudge.
2. Life of current price.
It physically pains me how rarely this nudge is used.
Dynamic pricing is everywhere. Why not share that information with the shopper?
This price is guaranteed for the next 18 hours.
This price reflects the highest discount in the past 24 weeks.
Limited-time offer applied to the price you see.
Seasonal promotion! Expires Friday.
Reflects special pricing for our highest-tier Frequent Flyers.
Price has reduced by 14% since your last visit.
I’m sure you’ll find language and phrasing that works perfectly for you (see PS at the end of this post). There is a nugget tied to a unique dimension for your dynamic pricing strategy. Please find it, please use it.
Here’s an example from The Golf Warehouse:
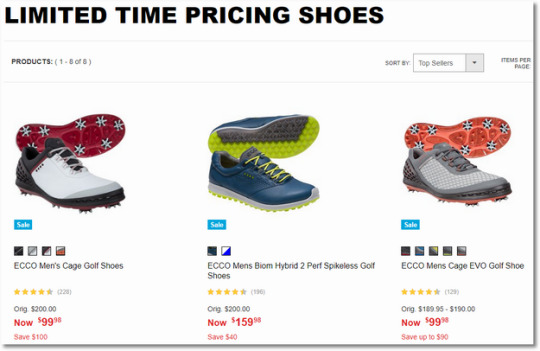
Here’s another one from Overstock that shows two time based nudges…
You can take advantage of other dimensions related to pricing that are unique to your digital strategy.
This one comes from YouTube TV: Lock-in this monthly rate for life.
YouTube TV’s price just went up from $35 to $40 (they added more channels). Everyone who’d signed up at $35 was grandfathered at that price – until they cancel!
Yet, this incredible benefit was not a part of YouTube TV’s merchandizing strategy from day one. You can imagine that a whole bunch of additional people (me!) would have jumped on board. Instead not only do I not have YouTube TV, I am sad/upset. Double loss.
You have an entire staff of economists, financial analysts, directors and VPs spending so much time on finding the perfect price to charge an individual. Why not convert that immense hard work into a nudge that creates a sense of urgency?
3. Direct competitor comparisons.
38% cheaper than Nordstrom.
Sometimes, by using one of the multitude of price aggregators, you can have an understanding of where your pricing is at an item level. Where the match is in your favor, why not use that as a nudge?
You can have the comparison for as long as it is valid. You don’t even need to specify a time—people are familiar with FOMO.
Only at B&H, this item comes with a free LG Watch!
First, who does not like free stuff?
Second, who does not like believing they are getting a special deal?
Three, who does not freak out that if they don’t buy it right away, this “insane deal” will disappear?
Me. I did that. At B&H. :)
Again, your merchandizing team is working hard to procure these amazing bundles for your customers, so why are they not a core part of your nudge strategy?
Costco Special: Get an extra year of warranty!
Our average delivery times to California are 50% faster than Amazon.
Save $150 on installation compared to Best Buy!
Our return rates are 40% lower than Wayfair.
You catch my drift.
Here’s just one example from SugarCRM:

Here’s a comparison on Honda’s site…

No, actually it is from Toyota’s site.
They know that if their car is more expensive, with worse mileage etc., better to be upfront as the customers are looking for that information…
You can also go deeper when it comes to implementing the spirit of this nudge. Kendrick Astro Instruments has the normal table based competitor comparison, additionally they also have a detailed comparison with images to give you more detail…

This shows hunger and desire to win… Their text:
This image displays the quality of Kendrick's cabling that we use on all Premier and FireFly heaters. Our cabling remains flexible in cold weather (down to -40° C), are all labeled for easy identification and all have metal RCA connectors..
This is the text next to their competitor's image (which you can view in higher resolution):
This image displays a competitor's cabling. It is a PVC coated RCA patch cord. PVC gets very stiff in the cold and as a result, makes it an awkward component to use at the telescope. As well, due to the lack of flexibility and give in the cold, it can defocus camera lenses.
Not all that hard to see how this nudge drives higher conversion rates.
Your employees stand up at 11:00 AM each day and sing the company song. There is a line in there about your company’s unique value proposition. Something so special, it stands out against everyone you compete with.
Why let that be your little secret? Why don’t you convert that into a nudge?
Consider how much louder your 11:00 AM company sing-a-long will be when your employees see you laying it out there and going head to head with your competitors.
4. Delivery times based on geo/IP/mobile phone location.
Amazon does this really well.
Each item’s estimated delivery time to you depends on the closest warehouse to your home address. So that Timbuk2 bag might be delivered to me the next day, but it would take two days to get to Carissa in Alabama.
Amazon shows this best delivery time for me right next to the price.
More often than not, I see that Prime One-Day or Prime Same-Day and, as if by magic, I find my mouse glide toward the Order Now button!

The closeness of the customer to your delivery environments remains an infrequently used strategy in creating an urgency nudge.
Another dimension of the delivery time nudge is order in the next 4 hours and get it tomorrow with fast shipping!
In our instant gratification culture, who can resist that?
You are $39 away from overnight shipping has been done to death. (If you are in this category, know that the last “secret” of ecommerce is that figuring out how to weaponize shipping – and free returns – is a powerful conversion increasing engine. Not easy, but your business model has to change to survive.)
But. If you are still in that world—don’t worry, I still love you—know that a behavioral shift from an emphasis on cost to an emphasis on the benefit will make a huge difference.
Add another $39 to your order and get your order 48 hours faster!
This takes advantage of the person’s location, your warehouse location, and your shipping policy, and frames it all as a positive nudge.
A couple more examples to inspire you.
Love these delicious sandals on Express. My wife thinks I’ll look prettier in the red, I think the Mustard really looks like my color. :)
I love the nudge they have built-in showing how many in my size are in stock (only one!)…
Not wanting to risk it, I click on the Find in Store link you see at the bottom of the page.
I get a interstitial that shows me availability of the sandal by geographic location…
Here’s the lovely part… I did not have to do anything. Express did a reverse lookup based on my IP Address, matched that with their stores, then checked their ERP system for inventory and got me the answer. All inside one second.
Nudge, nudge!
One more.
Dominos will now deliver a pizza to you wherever you are. Literally wherever. In a park, in the dark woods, under a bridge. They look up your mobile location (with your permission), and they’ll come find you.
Assuming you want pizza that bad.
There are still websites that ask you to choose your country when you land. In this day and age, for the sake of Zeus, I hope that is not you. But, how inventively are you using the location nudge?
Significantly higher revenue awaits.
5. Social cues to the rescue.
The last couple of months have not been great for social networks. I’m sure something beneficial will come to the entire digital ecosystem from all this.
A minority might believe that the whole social media thing is going to die. It is not. Community and sharing are core to who we are as humans. It is not going to change. (And, you still need a place for guilty pleasures: indulging in the latest Kardashian-West clan developments!)
Stretch your imagination and it is not hard to come up with some super-clever nudges that incorporate aggregate non-PII information that is public.
People have shared this blouse 18 times in the last hour on Instagram.
80 people in California have booked this destination in the last 30 days.
1,846 Pins for this closet on Pinterest.
Our most tweeted style of underwear!
800 plusses on Google+.
Ok, so maybe not Google+ (I was genuinely excited about it, I am sad it died). But you get the idea.
Social cues (/proof) can help create a sense of urgency for a whole host of companies. Yet, I bet you’ve rarely seen the use of this aggregated information to deliver nudges.
Here’s a simple example of aggregated non-PII based social cue, from, a site you’ve seen me express adoration for in the past, ModCloth. Every product has a little heart sign, visitors to the site vote their love which helps me make more confident decisions…
ModCloth also allows their customers to contribute something you might consider PII, their photos. These make perhaps the ultimate social proof as I can see the skirt I want (mustard again FTW!) on different body sizes…

ModCloth has a whole lot of social proof strategies. They have a Style Gallery, #ModClothSquad, #MarriedinModCloth etc.
Think expansively about social proof.
Naked Wines has a lovely widget next to each of their wines that shows the would buy again rate…
And, they show you historical sales and would buy it again rates.
Checkout the Kimbao Sauvignon Blanc you can see sales and would buy it again rates since 2011. At 91%, the rate is highest this year. Sweet. Add to Basket!
Another team thinking expansively about leveraging social proof are the excellent folks at Basecamp. If you scroll to the bottom of their web pages you’ll see…
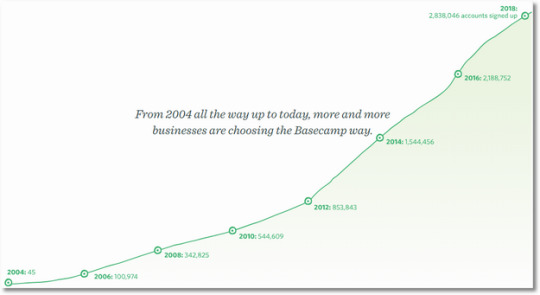
Completely non-PII based social proof, a simple cumulative trend of the number of customers. What better way to convince you to use them than this lovely up and to the right trend?
One final, massively underutilized, social proof nudge for you to consider.
Every smart ecommerce strategy has an individual-level referral program bolted on from the very start. Your current customers refer your products and services to their friends, family, and complete strangers—in exchange for a little benefit for themselves.
It is rare, however, to see the use of that referral information as a nudge.
Your friend Alex will receive $5 if you order in the next 24 hours.
The site is keeping track of the referral (to pay your friend Alex his bounty). They have all the information they need to create the above line of text. Why not use it?
Read Diana’s review of this product.
Diana, of course, referred the product to you, and that insight is in the URL you used to get to the site. The site is simply going the extra mile to surface Diana’s review, as it will likely be more meaningful to you than the other 29.
I love Patagonia; I value the brand’s ethos so deeply. And, when I say love, I mean LOVE. Two of the three pieces of clothing I’m wearing right now are from Patagonia. Yet there does not seem to be any strategy at Patagonia to help me (and you and other brand lovers) to create social cue nudges.
Humans inherently want to share, they want to show off, and they want to pass on recommendations/deals to their community. Got social nudges?
6. Personalization. Yes, from 1995!
Do you remember what I did during the last visit to your website?
No PII, just off the anonymous first-party permission-based cookie. Did you use that to change the site’s home page?
And, if you have a GDPR compliant login mechanism…Does your machine learning-powered ecommerce platform leverage the lifetime of my site experience, complaints, purchases, etc., to anticipate my activity?
Do the pages on your site wrap around my objectives, rather than your static and pimpy ones?
Is your entire sales strategy obsessed with the Do, or does it also obsess about the See, Think and Care bits of the complete human experience?
Personalization is the ultimate nudge—to create ecommerce-related urgency and to bring your brand closer to the customer over the lifetime of their experience with you.
That’s because personalization means truly caring. Personalization requires a huge investment in understanding. Personalization is translating that individual human-level understanding into anticipation. Personalization means helping. And when you do it right, personalization means you pimp with relevance—the best kind.
The desire to personalize across the complete human experiences kicks off the processes that fundamentally alter how you treat every human. The reason it works, when done right, is that deep down, we want people to care about us. And yes, we will end up doing more business with people who show that they care for us. Really care. The ultimate nudge.
So. If you own www.canada.ca or www.sainsbury.co.uk using PII or non-PII information… Does your site actively learn and then change? If not, why not?
One huge challenge we had to overcome in delivering personalization was employee capabilities. Employees are terrible at being able to imagine the expanse of possibilities when it comes being able to understand each human and being able to react to each human. Mercifully, Machine Learning (/Artificial Intelligence) will help us solve this challenge with incredible results.
Bottom-line.
You can pray that your conversion rates increase.
Alternatively, you can take advantage of the data you have access to, the permissions your users have given you, and the competitive advantages you’ve worked so hard to create and use them to create nudges that solve for delivering delight to your customers and more revenue to your company.
Your choice?
Nudging FTW!
As always, it is your turn now.
If you’ve tried one of the above six strategies to create a nudge, what was the outcome for your company? If you’ve seen a strategy for creating urgency that you love, will you please share it? What challenges have you run into in trying to personalize experiences? Nudging also works in our personal lives—have you tried it? :)
Please share your critiques, brilliant ideas and experience scars via the comments below.
PS: My doctor reminds me during every annual visit that I need to take more walks outside in the sun to make up for a vitamin deficiency. Turns out I spend too much time in my office or auditoriums. The sun is right there. I just need to take a walk. I still do it less than I should. Such is the case with A/B testing. The tools are free and abundant. You know they are the best way to win arguments with your HiPPOs or your cubicle mates. Yet, you don’t use them. I’m off to take a walk in the beautiful California sun, you go implement my recommendations for nudges as A/B tests—it is the only way to unlock the kind of imagination required to create profitable happy customer experiences.
The post Six Nudges: Creating A Sense Of Urgency For Higher Conversion Rates! appeared first on Occam's Razor by Avinash Kaushik.


from Occam's Razor by Avinash Kaushik https://ift.tt/2J71EPH
#Digital #Analytics #Website
0 notes
Text
Introducing Alliioop: The Customer Marketing Platform (to Build an Awesome Customer Base)
Shopify, Facebook, FedEx and the likes have made it easier than ever to birth ecommerce brands. And that’s exactly what’s been happening. Three people in a garage can launch, look and execute like a 100+ person company of old. I’m not saying it’s easy, there’s way more to it than that, but the triangulation of tech, logistics and online-all-the-time buyers have certainly paved the way for the ecommerce boom.
Keep your customers from cheating on you
And, just as the number of ecommerce companies have exploded, so too has the consumer’s opportunity and willingness to switch brands. Consumers are inundated with Facebook and Instagram ads, and don’t bat an eye at the notion of switching from one shop to another, or to Amazon. And it won’t stop–unless you can establish your brand and value to make them loyal.
Repeat customers are your #1 asset for growth
One thing that hasn’t changed since the brick-and-mortar days, is the fact that customer loyalty and lifetime value are critical to company growth and long-term survival. And that has never been more true. While store location could practically drive loyalty before–now location don’t mean diddly. It’s how you interact with your customers and build a relationship with your brand that matters most.

A graph illustrating the power of repeat purchases for your company growth
Build a brand your customers love
Getting customers to your site is one thing, but converting them into loyal, repeat customers is an entirely different challenge. That’s exactly why we created Alliioop. A customer marketing platform that makes it easy to engage each customer precisely the way they want and expect–and build a relationship that lasts forever.
Blanket emails won’t work
Alliioop is far from just another email marketing tool like Mailchimp. The biggest difference is Alliioop was built on a customer analytics platform. That means we can deliver deeper customer insights and more granular segmentation than ever before, so you can deliver messages that are more on target and stay personalized as you scale.
Building a kickass customer base
Clearly, building a large, loyal customer base takes time and effort–and both art and science. It requires that you understand what make customers tick, and not. It’s not always about sending discounts and special offers, though those do work. Delivering well timed content, advice, product recommendations, as well as those special offers is what adds value, builds appreciation and drives loyalty. We combined the key features in Alliioop to make it easy to catch people at the right time, with the right message.
Getting results with Alliioop
We’re thrilled with the results our customers are getting with Alliioop. They’ve seen immediate insights on how to engage their customers with highly targeted Facebook and email campaigns to increase conversions and sales.
Getting started and getting results is easy with our Shopify and Facebook integrations. Plus our pre-built reports, segments and campaigns come to life right after you turn it on, with these key capabilities:
Reporting: We’ve pre-built a suite of reports that will show you everything from high-level conversion metrics, to campaign performance, LTV and the details of every customer path. You get insights that will highlight what you should do next to increase conversions.
Segmentation: Sending highly targeted messages requires powerful segmentation. You can segment on anything and the segments are dynamic–meaning people are added and removed from segments in real-time–not stale, static lists.
Facebook: Keeping your Facebook Custom Audiences fresh and on target is cumbersome. We automatically add and remove people from your Facebook Custom Audiences based on their behavior. This keeps your audiences fresh and your ads more on target–and effective.
Email campaigns: Create and automatically send great emails that can be connected to your segments for highly targeted, timely delivery. Build flows that map to customer profiles and behaviors to get more clicks and purchases.
Automation: Driving all these engagements requires serious automation. Alliioop monitors all your customer behavior and triggers the engagements automatically. So as you build more granular targeting over time, we manage all the delivery so you can scale.
Alliioop is the first Customer Marketing Platform built from the customer data perspective and specifically for ecommerce. The power, simplicity and automation are combined in a platform that will scale your business and be as critical to your growth as your ecommerce platform is to your operations.
If you’d like to see how Alliioop can grow your ecommerce company, request a personal demo here
Enjoy!
About the Author: Brian Kelly is the CEO of Space Pencil. Space Pencil is the creator of Alliioop, Sherlock and Kissmetrics.
from Search Results for “analytics” – The Kissmetrics Marketing Blog https://ift.tt/2kItpzD
#Digital #Analytics #Website
0 notes
Text
Is Influencer Marketing Dead? A Hard Look at The Newest Data (and What You Can Do Instead)
Is anyone having deja vu?
Every time a new marketing tactic becomes more mainstream, marketers and researchers inevitably wonder if it has peaked and started to lose its effectiveness.
We’ve seen this before with SEO, email marketing, Facebook marketing, and many others.

It’s a fair question to ask, though.
After all, each year brings new trends in marketing, and some tactics can go out of style. It’s worth examining different approaches to see if they’re still effective.
The tactic we’ll evaluate today is influencer marketing.
Though influencer marketing has been around for a very long time, it has only become a popular marketing tactic in recent years.
With the influx of social media in 2004, influencer marketing exploded and became a lot more prevalent.
Now, fast forward 14 years later.
Influencer marketing has seen some incredible successes and even a few massive failures.
That’s why we need to take a closer look at influencer marketing in 2018.
Should you continue to invest in influencer marketing, or is it dead?
The answer isn’t exactly a simple “yes” or “no.”
But recent data can help you decide if influencer marketing has staying power and if it is the right tactic for your brand to implement in 2018.
The complex current state of influencer marketing in 2018
Let’s dive right in.
I’m going to address the million-dollar question that everyone is asking:
“Is influencer marketing dead?”
Here’s the answer: not really.
But, I have to admit, its future is uncertain.
At the moment, marketers are continuing to focus on influencer marketing as a viable and essential marketing tactic in 2018.
In fact, in the survey below, marketers picked it as the “fastest-growing online customer-acquisition method” over organic search, email, paid search, and more.
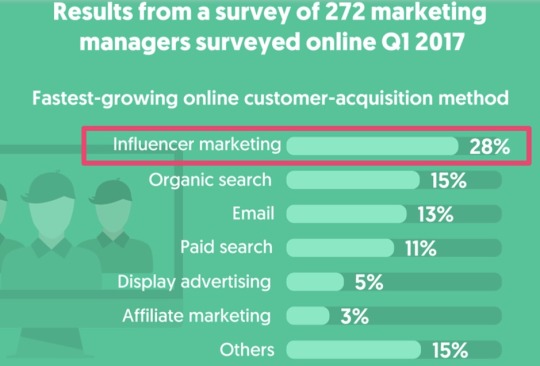
There’s no questioning the popularity of influencer marketing, especially in recent years.
Marketers seem to be searching for new ways to involve influencers on a variety of campaigns.
And they’re investing in their influencer marketing campaigns, too. The influencer marketing industry is booming.
Projections show that marketers will spend $2.38 billion on influencer marketing on Instagram in 2019. That’s more than a $700 million increase from 2018!
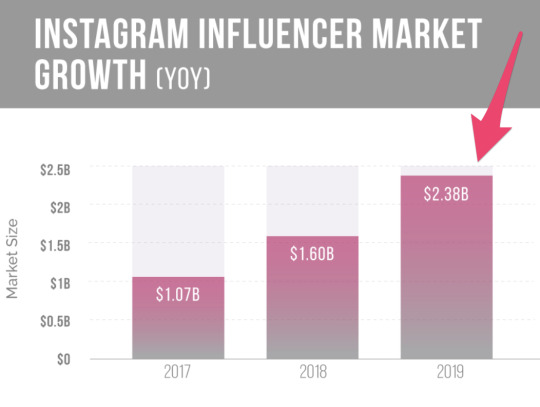
But it doesn’t matter if marketers are fans of influencer marketing. We need to look at the data to see if it works.
Is it truly effective? Are you getting a bang for your buck?
The answer to both questions is still “yes.”
Data shows that influencer marketing is still providing marketers with a strong return on investment. Let’s take a look.
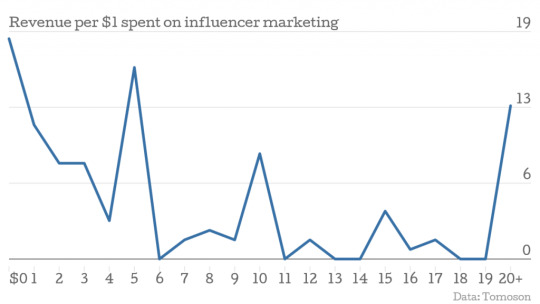
The data shows that influencer marketing generates $6.50 for every dollar a company invests. Approximately 70% of companies earn $2 or more for every dollar, and 13% of companies earn $20 or more.
That’s valuable.
But you might not always be so lucky.
If you look closely, you’ll see that 18% of businesses didn’t receive any return on investment at all. When you factor this into how much a campaign can cost, things can get a little pricey.
This is one reason that many marketers (including myself) wonder how long influencer marketing will remain a viable tactic.
Many factors make the future of influencer marketing uncertain, too.
First, the FTC introduced regulations to “improve disclosures” in 2017. This helps consumers understand which posts are promotional, even if they are coming from an influencer.
While the regulations are needed, additional ones may cause some brands to stray away from influencer marketing due to the risk of malpractice.
Plus, influencer marketing campaigns are starting to get more expensive.
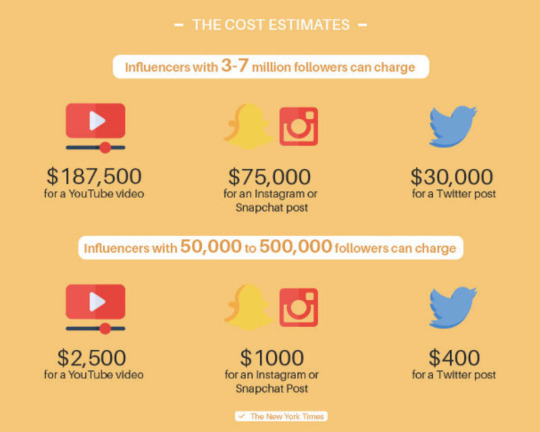
Mid-range influencers with 50,000 – 500,000 followers can charge anywhere from $400 to $2,500 for a post.
Influencers with a following in the millions can charge between $30,000 and $187,500 per post.
With such a large investment in a single post, marketers are expecting a huge ROI.
But there’s only one problem:
Many don’t know how to accurately measure the ROI from their influencer marketing campaigns.
An overwhelming majority (76%) of marketers agree that the biggest challenge of influencer marketing is determining the ROI of campaigns.
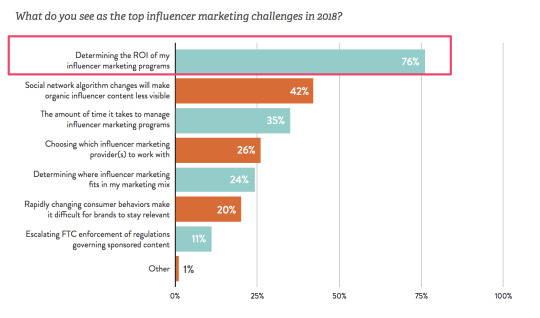
How can you improve something if you don’t measure it? Worse yet, how can you even know if it’s working?
But the problem isn’t just with marketers.
Consumers are evolving, too.
The scale has tipped, and millennials are now trusting influencers less than they were in previous years.
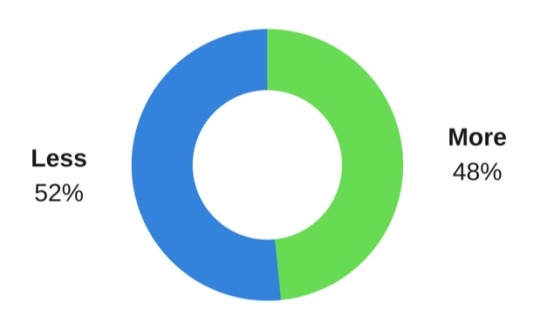
Can you blame them, though? After all, think back to the Fyre Festival influencer marketing gaffe.
Influencers including Kendall Jenner, Emily Ratajkowski, Whitney Fransway, and many others promoted the event. But it didn’t live up to expectations.

As a result of this failure, 94% of marketers stated they were “not likely” or “very unlikely” to seek out big-name influencers for future projects.
All of these factors play into the unstable future of influencer marketing.
As you continue with influencer marketing campaigns for now, you should also begin to test, expand, and optimize other areas of your marketing strategy.
Here are the alternatives to influencer marketing that you should be focusing on in 2018 to help accelerate the growth of your business.
1. Focus on experiential marketing for live events
Sometimes, it’s easy to forget there’s a whole world “out there.”
Your customers aren’t always online.
Live events can provide a unique touchpoint for your customers that influencer marketing can’t.
And they’re effective, too.
According to a recent study, “79% of brand respondents said they would execute more experiential programs this year compared to last.”
Take Clif Bar as an example.
They focused on creating an experiential marketing activation at Pitchfork Music Festival last year. Their activation included a tattoo parlor, photo booth, and more.

At the event, they distributed 26,000 CLIF bars, and one in 20 social posts with the tag #Pitchforkfest also featured the CLIF bar activation.
Live events provide a unique experience in real life, and their impact often expands onto social media.
HBO tapped into its live event playbook when they debuted their interactive Westworld event at the SXSW festival in Austin, Texas.
Participants boarded buses and went right outside the city limits for an immersive experience that brought to life the fictional Westworld town from the hit TV series.
The experience was highly detailed and highly personalized. Participants could get their picture printed on a western “Wanted” poster, which aligned well with the brand.

People constantly shared experience on social media during SXSW. It stole the show and earned 62% of the entertainment brand mentions at SXSW.
Live events are an important marketing tactic to help you connect with your customers in a meaningful and authentic way. Influencers simply can’t do that for you.
2. Invest in video content to share your company’s narrative
Video marketing isn’t just flashy, and it isn’t a fad.
It is here to stay, and it can drive serious growth for your business.
Most importantly, though, is that it is becoming mainstream and responsible for a bulk of Internet traffic.
According to estimates, video will make up more than 80% of all consumer Internet traffic by 2021.
Hopefully, you already use video as a part of your content strategy. If not, you’re going to fall behind soon.
In a recent survey, 49.5% of marketers said that video will be a focal point for their marketing.
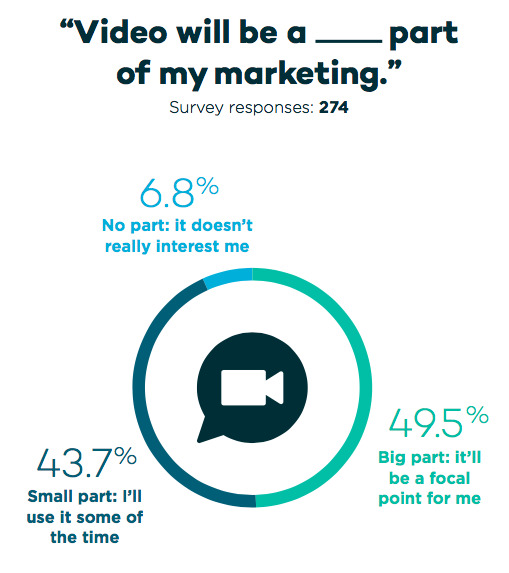
That’s nearly half of all marketers.
Now, I know what you might be thinking: “My influencer campaigns already use video, so I’m all set.”
Unfortunately, you’re wrong.
You’re missing the chance to focus on everyday people and create meaningful, evergreen content that showcases your brand’s values and embodies your mission.
You can’t rely on influencers to create content that resonates with your audience. You have to do it yourself.
After all, brands often miss opportunities to connect with their customers. A study found that 78% of people feel that brands never connect with them emotionally.
But LinkedIn recently did this well in a documentary-style integrated video campaign. They used the hashtag #InItTogether for it.
Eszylfie Taylor turned his past sales experience into a lesson in life. The more he gives people, the more he gets back. He’s in it to share the wealth. https://t.co/UNiC2JJiF1 #InItTogether pic.twitter.com/5WyqE4ij1l
— LinkedIn (@LinkedIn) January 18, 2018
Campaign Director Stacy Peralta talked about the impact of the campaign. She said, “I knew from the first reading of the boards that this was one of those rare opportunities.”
She added, “They asked us to tell real stories about real people, they wanted it shot in black and white, and they wanted energy, enthusiasm and candor from the people involved.”
That campaign generated great content for LinkedIn to share with their audience.
But where should you share your video content after you finish creating it? Well, consumers watch and engage with branded content in different ways on different platforms.
It’s important to know which works best for your business, but here are some generalizations across all social platforms for consumer viewing and engagement habits:
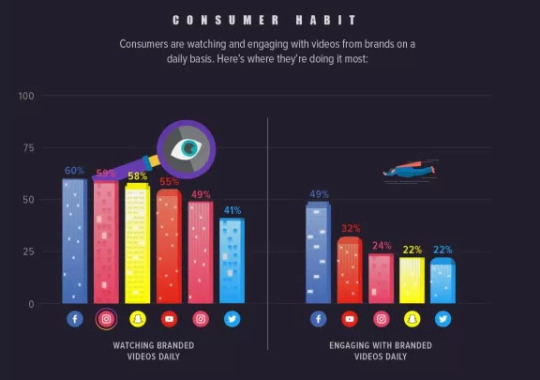
As you can see, Facebook has the highest viewership as well as engagement numbers (60% and 49%, respectively), while Twitter has the least (41% and 22%).
The interesting part, though, is that there is only a 2% difference in viewership among the top three platforms: Facebook, Instagram (Video), and Snapchat. YouTube and Twitter fall close behind.
On the engagement side of things, it is much different. Facebook is the clear winner (49%) with YouTube (32%) coming in second. That’s a 17% difference.
So that gives you an idea of where you should be sharing your content. But now, you might be wondering how long your videos should be.
Thankfully, there is data to support the ideal length, and the conclusions are clear as day. Here’s the basic principle:
Make them short.
Approximately 56% of all videos that users shared in 2017 were less than two minutes long.
Viewers will lose interest and likely leave if a video is longer than two minutes.
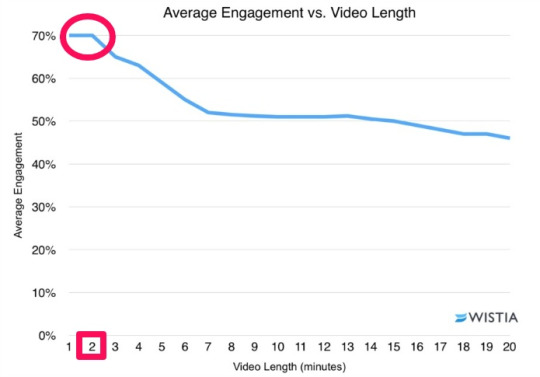
If you aren’t yet certain that video content can be effective in marketing, look at this experiment from HubSpot. They examined the difference between acquiring customers with video content and non-video content.
They tried switching to video content as opposed to blogs and whitepapers.
As they optimized and emphasized their videos, their views and engagement rates skyrocketed. Here were their engagement rates with their old strategy:

Now, here were their engagement rates after they started emphasizing their video content:

Before this experiment, their videos averaged 50,000 views per month. But in their first month of optimizing and promoting their video content, they achieved 1 million views. Those are clear results!
Another great example is BakedNYC’s video campaign.
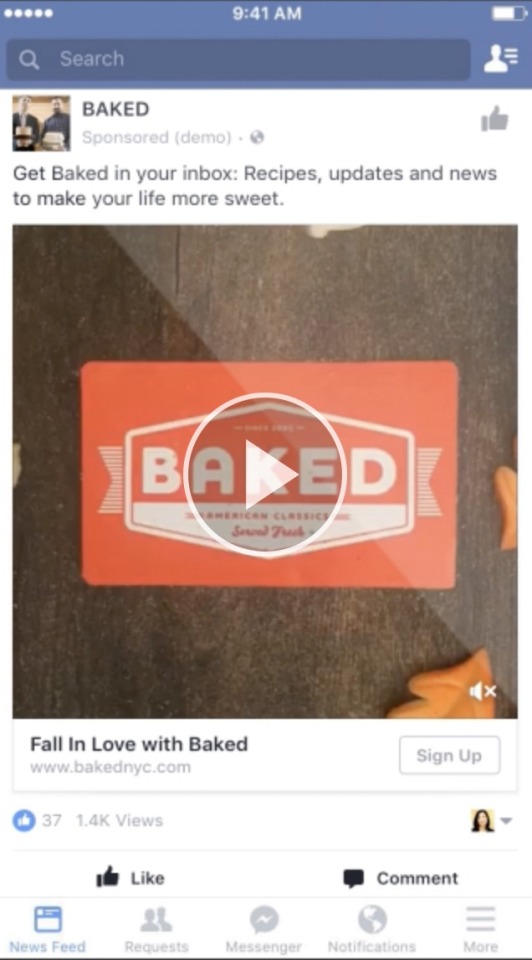
BakedNYC used video to capture emails, and their results were fantastic.
Through this campaign, they achieved a 40% increase in pie sales, a 68% increase in leads, and a 30% decrease in cost per lead.
Video content presents a huge opportunity for your brand. But creating quality videos might feel like a daunting task.
Don’t fret if don’t think that you can do this alone. You don’t have to be Steven Spielberg.
There are plenty of tools that can help you create engaging video content on a low budget in a tight timeframe.
One of them is Promo.

I love Promo because they have over 12.5 million clips that you can customize. You can add music, text, and even your logo to personalize the clips and make them your own.
Magisto is another great tool to use.

The cool thing about Magisto is that it has a smart video editor, which makes it incredibly easy to cut and edit your videos online.
These tools can help create great video content that will drive sales on your website.
If you want to get the most out of your marketing efforts in 2018, spend time crafting video promotional campaigns and fine-tuning your video content strategy.
3. Initiate an affiliate marketing program
Not having an effective affiliate marketing program in place is simply leaving money on the table.
Affiliate marketing can bring in a lot of money for your business. To put it in perspective, 15% of the digital media industry’s revenue comes from affiliate marketing.
With affiliate marketing, you’re letting related sites and partners do the work for you.
So, where do you begin?
There are three types of affiliate programs that you can implement:
Pay-per-sale: The merchant pays the affiliate in relation to the number of sales that they received from their site.
Pay-per-click: The merchant pays the affiliate in relation to the number of clicks that visitors performed while browsing the affiliate’s site.
Pay-per-lead: The merchant pays the affiliates in relation to the number of people who sign up.
Affiliate programs succeed in ways that influencer marketing doesn’t. First, it’s usually a win-win for both the affiliate and the merchant because you share the same business goals.
Sites want to send you traffic so that they can earn money. You want the same thing because the affiliate will send you new customers. It’s a win for both of you.
In some cases, influencers don’t share the same mission. They might be just looking for a quick payout, which could lead them to share your campaign in a way that isn’t authentic or true to their brand or yours.
The Points Guy is an example of a company that has a strong affiliate marketing program in place.
He started his site as a place to show people how to travel by using points they’ve amassed from purchases. Now, the site is an affiliate site for credit cards, hotels, and flights.
In his AMA, he confirmed that he receives “2.5 million monthly unique views and gets $50-$400 per credit card someone signs up for.”

As a business, you can harness the traffic that is already in place for a well-oiled site. By giving them a little kickback, you both win.
They’ll make money, and you’ll acquire a new customer. It’s really a no-brainer.
4. Be responsive on social media and circulate user-generated content
If you’re reading this blog, I’d go out on a limb to say you have, at the very least, a presence on social media.
While influencers typically utilize social media to propel their efforts, sometimes taking matters into your own hands can retain customers and have a more profound impact on your sales.
Social media marketing has been an important part of any marketing strategy over the years, and it only continues to evolve in 2018.
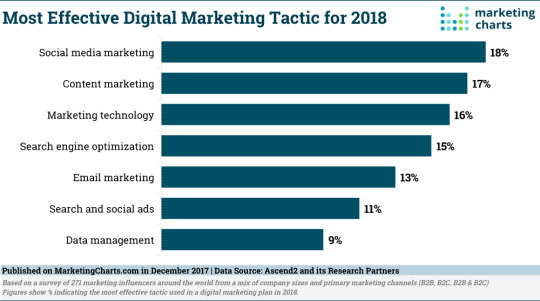
Your customers are already hanging out on there. New data shows that a majority of Americans are now on Facebook and YouTube.
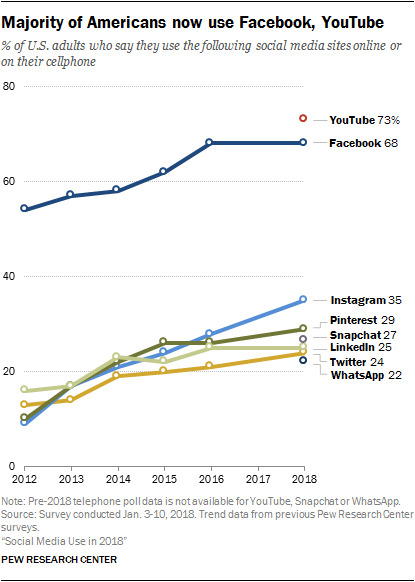
Once again, this fact reinforces your need for video content.
But how else can you use social media to grow your audience and increase sales? One important answer is quite simple:
By being responsive.
Data shows that companies can make a dramatic effect on their bottom lines if they are responsive and engaging on social media.
Consumers say that the best way for a brand to get them to make a purchase is by simply being responsive.
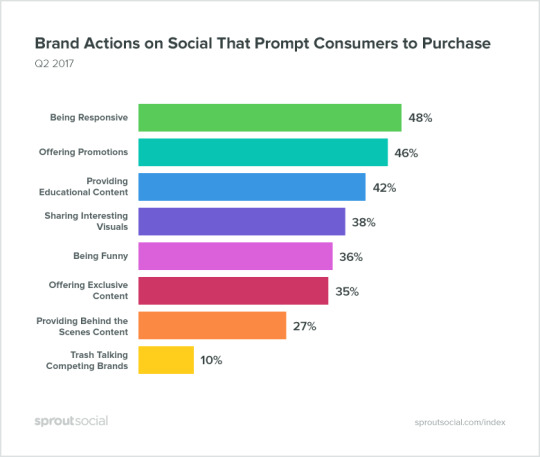
If you respond on social media, people will talk about your positive customer service interactions. Studies found that approximately 48% of people tell their friends about a good customer experience on social media.
This creates a powerful form of word-of-mouth marketing. Your customers’ friends can soon become your new customers.
Facebook understand how impatient people are. They’re now labeling pages with badges that designate their response times.
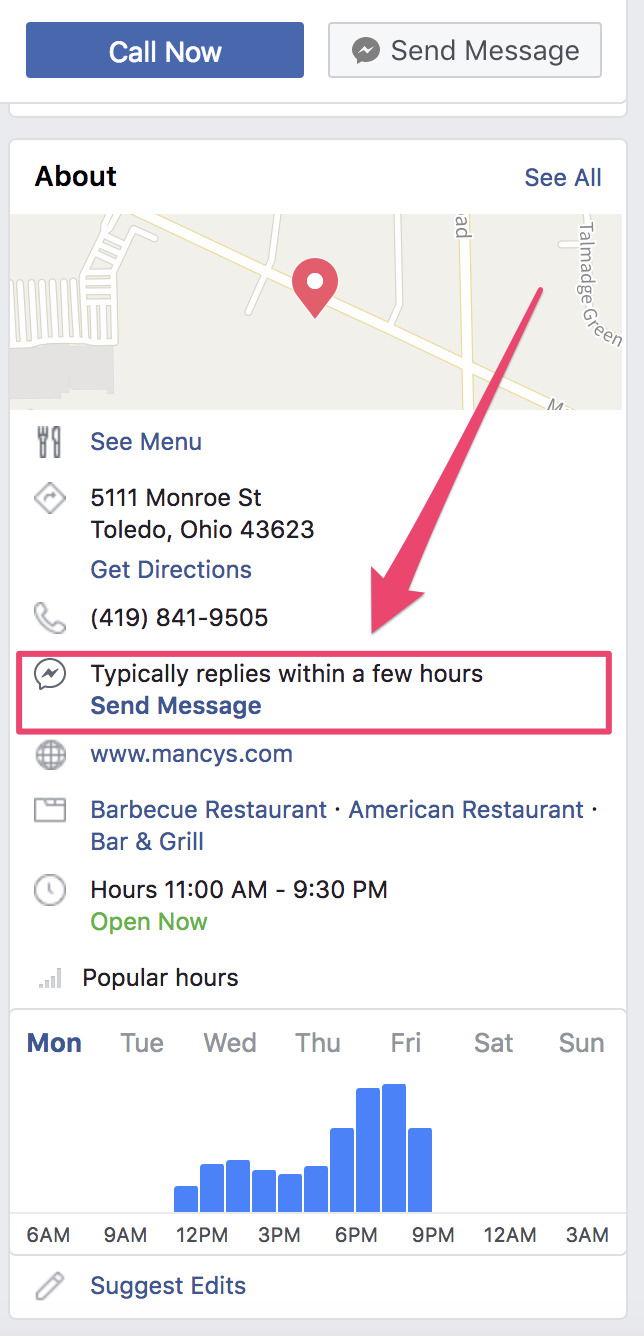
To get the coveted “Very responsive to messages” badge, you need to achieve two things over the course of seven days:
A response rate of 90%
A response time of 15 minutes
But what if you get a lot of inquiries? How should you keep up with all of them?
Mention is a tool that can help you streamline your customer experience operations on social media.
It can provide assistance and organize your mentions in an easy-to-read way so that you aren’t overwhelmed.
An example of exemplary customer service on social media would be JetBlue.
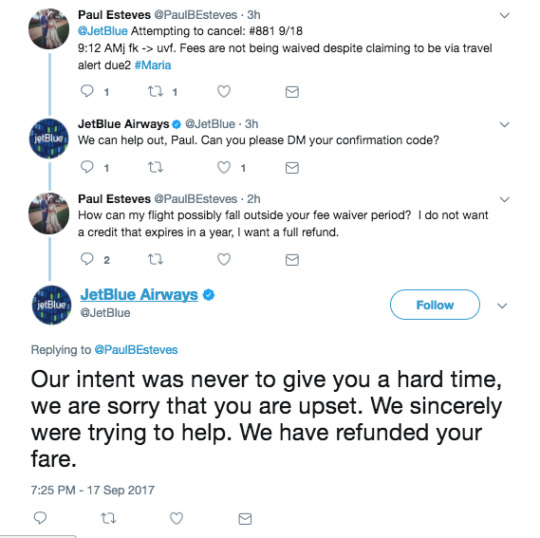
Before things got out of hand, they moved quickly and efficiently to resolve the situation, resulting in a happy, satisfied customer who might buy again.
But that’s not all. JetBlue cares so much about their customer service that they announced a partnership and investment in the customer service startup Gladly.
Here’s what Bonny Simi, the president of JetBlue’s corporate venture group, said about their customer service strategy:
“People just don’t want to call in anymore, so we are aiming for omnichannel communication that is on at all hours.”
He added, “[This communication should] take advantage of AI to resolve customers’ issues as quickly as possible, and that will work with all of the important messenger apps.”
As you work on being responsive on social media, you’ll want to circulate the incredible content (photos, videos, and comments) and great accolades that your users are sharing. User-generated content is incredibly valuable.
Sponsors generally pay influencers to post about their products or content. User-generated content, on the other hand, has no financial incentive.
It makes your brand more authentic.

And it’s needed now more than ever.
Research shows that “92 percent of consumers trust organic, user-generated content (UGC) more than they trust traditional advertising.”
Currently, Southwest Airlines is running a user-generated campaign that they call 175 Stories. This integrated campaign invites customers to share their seat story using the hashtag #175Stories.
They even launched a microsite to further share the content.

Judging by a quick hashtag search, the campaign seems to be effective.
Encouraging users to act as your own photographers and share their content can have a positive impact on your business’s growth.
An active presence on social media is not only beneficial to your customers. It can also do wonders for your brand awareness and revenue.
5. Leverage social messaging apps to reach more customers and connect with existing ones
Mobile messaging marketing has emerged as a new trend in 2018.
It seems like social messaging apps (WhatsApp, Facebook Messenger, and many others) are all the craze these days.
And honestly, they should be.
Influencer marketing shares one message with many people. By using social messaging apps, you can send numerous highly-personalized messages to many people.
Users and businesses on Facebook send approximately 8 billion messages on Messenger every month.
The best part is that they usually have high open and click-through rates, too.
The growth of these messaging apps has skyrocketed in recent years. In 2017, over 76% of smartphone users worldwide used messaging apps.

The graph also shows that, according to current projections, there will be 2.48 billion mobile phone messaging app users by 2021.
If you want to be where your customers are, then you should think about how you’re leveraging your messaging app strategy.
But what’s interesting is that not all marketers, for some reason or another, aren’t using this as a marketing tactic.
“The State of Social 2018” study found that, despite the increase in interest and adoption of messaging apps, nearly 80% of businesses don’t market through them at all.
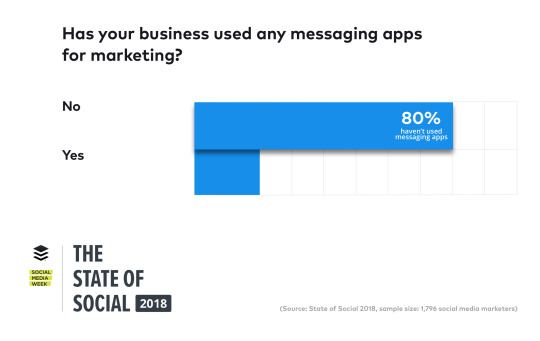
That’s bad for them, but it’s great for you.
Fewer businesses promoting their messages means a greater chance of yours cutting through the clutter.
Messaging apps are a great place to distribute content and offer promotional deals directly to your customers.
Look at how DigitalMarketer used a chatbot to distribute their “Ending the War Between Sales & Marketing” report.
Those interested in the report could connect their Facebook with just a simple click. Then, an automated message would arrive in their Messenger account with a link to the report.
It’s quick, easy, and even feels a little personal.

But this isn’t just a flashy way to distribute content.
It gets results, too.
For example, look at this retargeting campaign that used a chatbot to allow customers to “unlock a special discount.”
The results were incredible. They achieved a 48.2x ROAS (up from 5.6x) and a 1133% conversion rate increase.
HolidayPirates saw incredible success when they used a chatbot to deliver a promotion code to their customers.
They have over nine million digital followers, and they wanted to interact with them on social messaging platforms and send them a holiday promotion.
They grew their WhatsApp following to 750,000+ and achieved open rates of 50-60% and 90% click-through rates for the campaign.
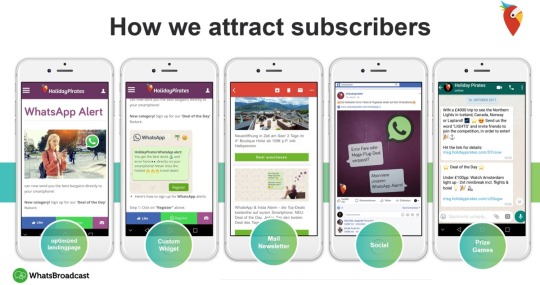
A 90% click-through rate?
That’s something you don’t see every day.
To get a chatbot set up, you just need to follow a few easy steps.
For this example, I’m going to use itsalive.io.
First, visit their homepage and click on “Get Started for Free.”

Then, fill out the information they ask for to register your account.

From there, choose your plan and hit “Next.”

Name and describe your bot, and then hit “Create this bot.”
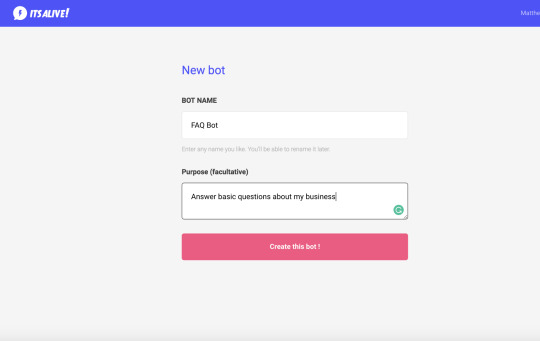
Click on the pencil icon to edit the test bot that you get by default.
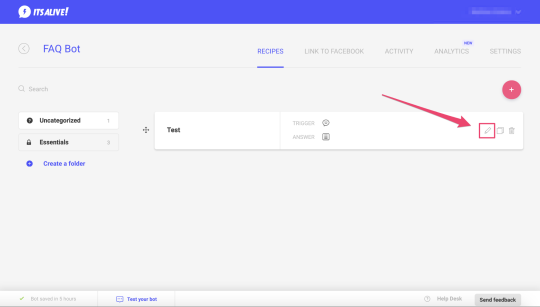
Add your trigger and text. Triggers can vary from keywords to events. You can then program what you’d like the bot to do.
You can add as many triggers and texts as you’d like.
In this case, I am setting up the bot to answer FAQs.
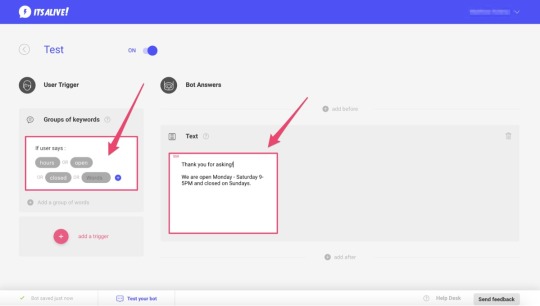
Then, click the back button and select “Link to Facebook” in the menu.
From there, you’ll want to “Connect to your Facebook account” and select your business page.
Take special note of the test code as well. You will have to add that four-character code when you test your bot.
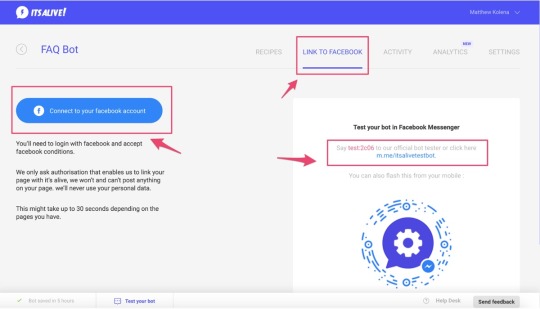
Then, you can test your bot and see it in action for yourself.
Continue to tweak your bot until it accomplishes your business objectives.
Due to the widespread adoption of messaging apps and the generally untapped potential of social messaging marketing, your business could cut directly through the clutter with this tactic.
You should really consider how you can leverage it to reach new customers.
6. Continue to invest in your email marketing strategy
You might be thinking, “Email marketing. That’s so old school.”
While that may be true, it’s still a viable marketing tactic that you should double down on.
One advantage is that you can control and target your audience with email marketing better than you can with influencer marketing.
Emails are part of everyday life, and using them as a marketing medium gets results. After all, users send 149,000+ emails each day.
That might sound like a lot of clutter, and it is. But it’s important that you keep your business top of mind in your customers’ inboxes.
But why?
Email still has the highest ROI when you compare it to any other marketing tactic.
For every $1 businesses spend on email marketing, they average a $38 return.
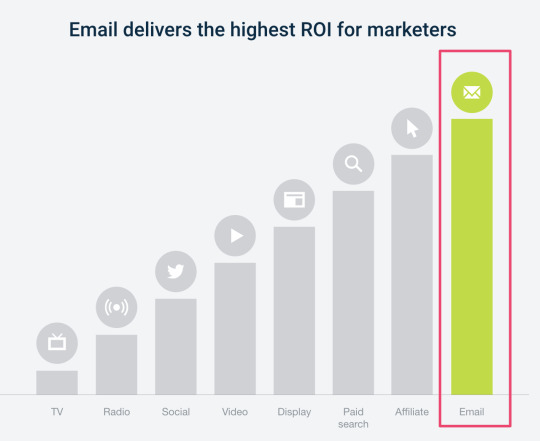
Notice how email marketing soars ahead of affiliate marketing, paid search, display ads, videos, social media marketing, and traditional marketing tactics.
If you want to assess the ROI of your email marketing campaigns, I recommend this email marketing ROI tool.
It’s very easy to use and can provide great insights into your current email marketing efforts.
Marketers even collectively agree that email has staying power in 2018.
In one survey, marketing professionals rated the effectiveness of digital marketing channels. Approximately 35% gave email marketing a “good” rating, and 18% rated it as “excellent.”
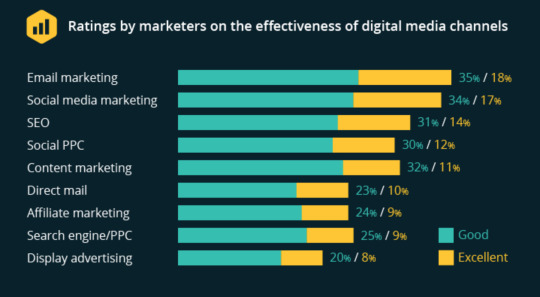
This put email marketing in the lead as one of the most effective digital marketing channels according to marketers.
In 2018, you need to have an email marketing strategy in place and execute highly-personalized and targeted campaigns.
Customers are expecting this in all marketing tactics, but especially in email. If you haven’t targeted your email, they’ll consider it irrelevant to them. You can bet they’ll delete it.
Even worse, they might not open it.
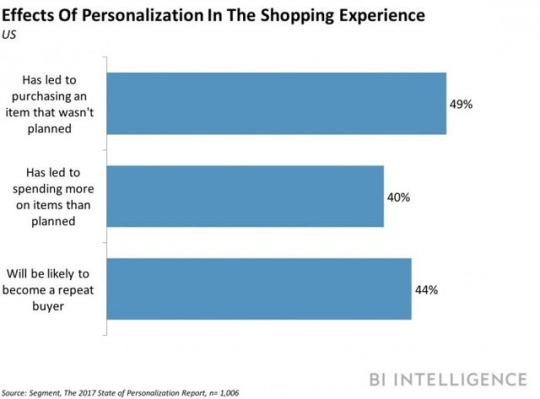
A total of 49% of shoppers said that personalization “has led shoppers to purchase an item that wasn’t planned.”
By personalizing your copy, messaging, design, and even your pricing structure, you can encourage conversions and move customers to buy.
You can do this by segmenting your lists (separating your lists to ensure the correct campaign is going to the right audience) and using dynamic copy or pricing.
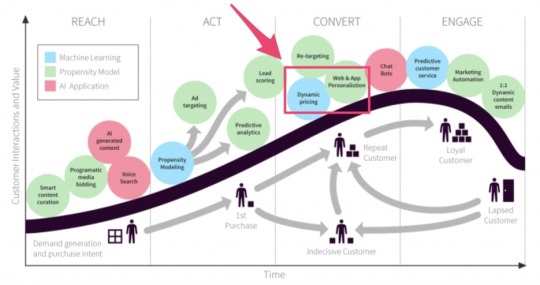
How do you make sure that you’ve personalized your email campaigns and that you’re sending them to the right people?
That’s what the men’s shirt company Twillory had to answer.
The team initiated an email campaign when they moved into a larger warehouse. They sent the below email to their first-tier recipients and achieved a 48.5% open rate and an 8% CTR.

To their less-engaged tier, they stripped the graphic away and took a simpler, personalized, text-based approach.
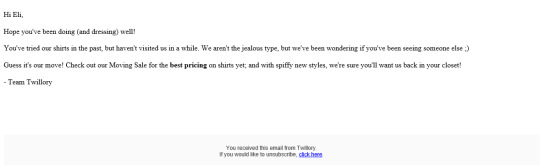
This resulted in “a 33% open rate and 11% click-through rate with a group of people who had not engaged in over 270 days.”
That’s a significant impact for their email marketing efforts.
If you want to effectively reach your customers, then deploy smart, personalized, and targeted email marketing campaigns.
Conclusion
Influencer marketing isn’t dead.
At least, it isn’t dead yet.
For now, it still can perform as a viable part of your marketing strategy. The influencer marketing industry is still booming, and it’s still profitable in many cases.
But it may not be around for much longer. It’s becoming increasingly expensive, there’s no guarantee of results, it’s difficult to track the ROI of campaigns, and users are beginning to trust influencers less.
You need to prepare for alternate ways to acquire customers.
Turn to video content to share a compelling narrative about your brand or help put a product on display.
Engage with customers directly on social media. Go out of your way to provide out-of-this-world service experiences that will turn your customers into passionate fans.
Focus on messenger marketing and directly share content, promotions, and solutions through messaging apps.
Finally, double down on email marketing. But as you do so, make sure that you target the right audience and personalize your messages with dynamic content.
If you do all of this, you’ll be ready if the days of influencer marketing come to an end.
What marketing tactics will you use in place of influencer marketing in 2018?
About the Author: Neil Patel is the cofounder of Neil Patel Digital.
from Search Results for “analytics” – The Kissmetrics Marketing Blog https://ift.tt/2HbCU3e
#Digital #Analytics #Website
0 notes
Text
7 Reasons Why Nobody is Reading Your Content and How to Grab Their Attention
Content, content, content.
It seems like content is the only thing anyone can talk about these days.
You’ve probably read post after post about how “content is king” at least a dozen times.
However, despite your best efforts, you can’t seem to see what the content hype is all about.
You write blog posts.
You create videos.
You participate in social media.
And yet, crickets.
You’re creating content, but it’s not getting you very far.
Unfortunately, creating content isn’t enough to really market your business.
If no one is engaging with what you’re producing, you’re simply wasting time, energy, and resources to clutter an already overcrowded web.
But this doesn’t mean content marketing is ineffective.
In fact, 20% of business owners believe content marketing will have the largest impact on their business in 2018.
If you’re not getting results from the content you’re creating, it typically means you’re doing something wrong.
But with a projected 16% growth rate between 2017 and 2021, content marketing isn’t something you can just hope will pass by.
If you want to market your business successfully, you need to find your errors, shape up your content, and start getting conversions.
To help you improve your content marketing strategy, here are seven of the biggest mistakes you might be making – and what you can do to turn your results around.
1. You have no strategy
Are you posting whatever you want, whenever you want?
A lot of marketers do this.
In fact, only 37% of B2B marketers have a documented content marketing strategy.
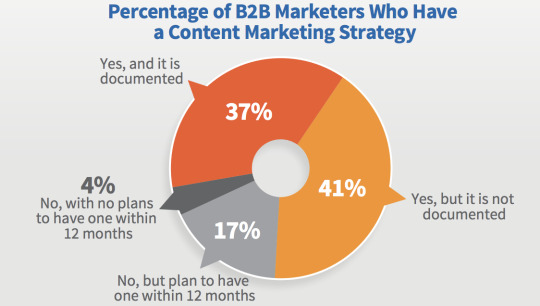
This means the majority of marketers aren’t thinking strategically about the content they’re creating.
This makes it easy for your audience to ignore whatever you’re sharing.
A content marketing strategy helps you identify what you’d like to accomplish with your content, as well as how you’re going to use your content to achieve your larger business goals.
In other words, it forces you to put intention behind your content.
Moz describes content marketing strategy as the overlap between content marketing and content strategy.
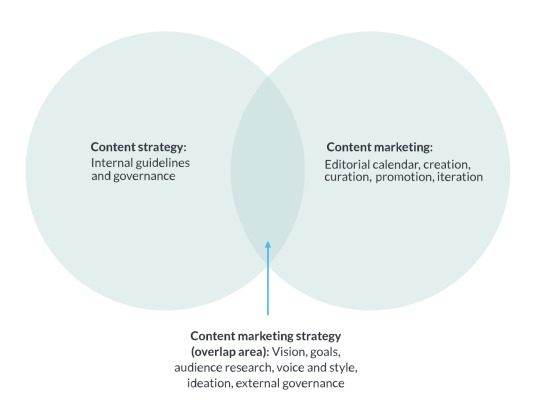
At this intersection, you’re able to use the content you’ve created to bring your business plans to life.
If you’re operating without a content marketing strategy, this disconnect makes it difficult for your target audience to know what you want them to do.
However, when you create a plan, you’re putting a purpose behind your content.
Creating a content marketing plan doesn’t need to be difficult.
In fact, Content Marketing Institute outlines how you can create an effective plan in just one page by outlining your objectives, goals, metrics, and strategy.
Once this is done, you’re ready to move on to an editorial calendar.
Your editorial calendar should work hand-in-hand with the content marketing strategy you’ve created.
Here’s an example of an editorial calendar template from HubSpot.
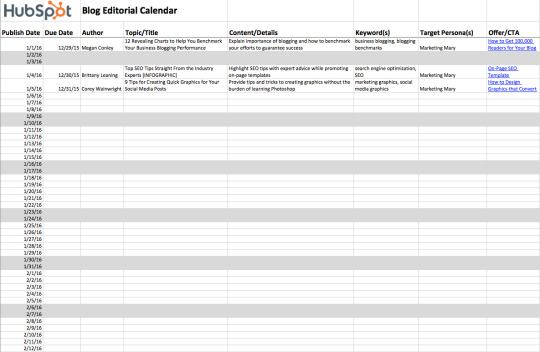
This calendar breaks down exactly when you’re going to publish your blog post, as well as the title name, content details, and keywords you’re going to target.
It also shares which personas you’re trying to reach and what you’re going to offer them.
This kind of well thought out planning means each piece of content you upload fits within the content marketing plan you’ve established.
There are dozens of ways you can create an editorial calendar.
Quickbooks chooses to house their editorial calendar in Airtable – allowing one editor to manage over 4,000 pieces of content.
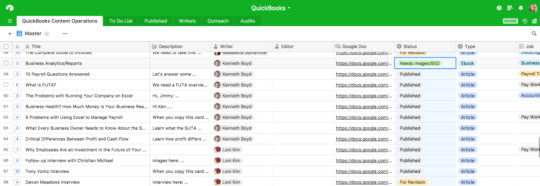
Others, like Buffer, turn to Trello.
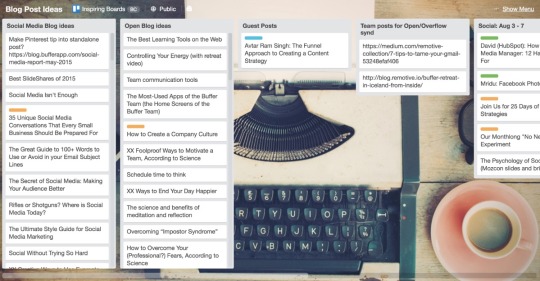
Personally, I like Asana.
But the tool isn’t the point. The best tool is ultimately the one you can get everybody to use consistently.
2. You’re not publishing enough
When it comes to uploading content, quality beats quantity any day.
However, if you’re just posting once a month, you’re going to struggle to grab any real attention.
Consistency is key to building trust and credibility both with your audience and with search engines.
The idea is simple.
When you create more blogs, you’ll drive more traffic to your website.
With more traffic, you can prove to Google that you have content people want to read.
Once they understand you’re sharing valuable information, they’ll give your content a boost on their results pages – bringing in even more traffic and attention.
However, it’s easier said than done.
If you’re stuffing your website with low-quality information that your audience doesn’t care about, it doesn’t matter how frequently you post.
In fact, The Writing Cooperative found that blogging every day actually decreased their views compared to when they were posting just six times a month.
In March 2017, before their posting experiment, The Writing Cooperative was getting about 14,000 views each month.
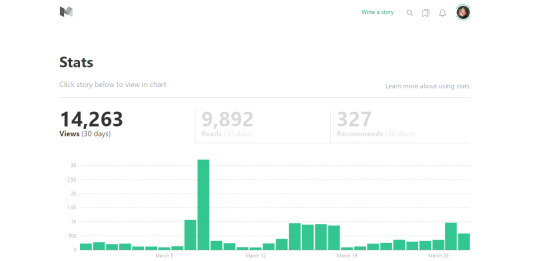
But once they began blogging every day, views began to decrease.
The problem here is that they couldn’t continue to create high-quality content each and every day – and their readers noticed.
The key to getting attention through your content is finding the right balance between quality and quantity.
You also want to go beyond simple blog posts.
While blogging is a great way to bring traffic to your website, it doesn’t appeal to everyone.
Not everyone likes to read blog posts.
In fact, 53% of consumers said they’d like to see more videos in the future.
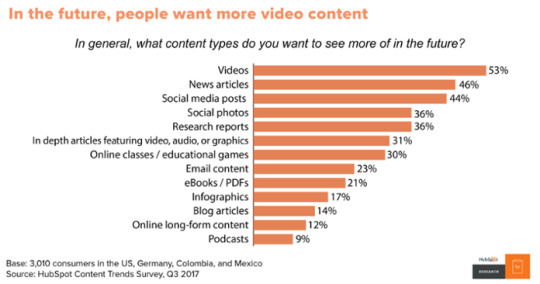
And with customers becoming more and more dependent on voice search and smart speakers, blogging isn’t always the most effective way to deliver content.
When you’re thinking about how often you should publish, you also want to consider what you’re publishing.
Videos can be a great way to grab attention, break down complex topics in a way that is easier for your audience to understand, or show off your products.
For example, Red Bull uses YouTube to show off the extreme sports, events, and competitions they sponsor.
With over seven million subscribers to their channel, Red Bull has one of the most popular YouTube pages out there.
Infographics are another way you can make your content more interesting for your audience, especially if you’re showing off large amounts of data or research.
In fact, over 41% of marketers said that infographics were the most engaging forms of visual content for their audience.
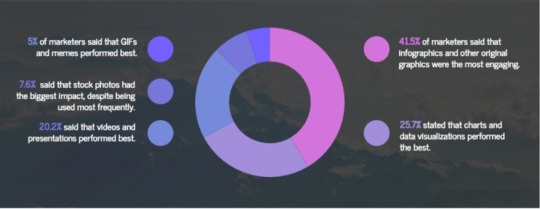
This ranked even higher than videos.
Infographics are insanely popular because they’re easy to skim and visual, making them ideal content for your always-busy customers and clients.
You can also expand your reach and get more attention to your content by producing podcasts.
Podcasts have been increasing in popularity over the past couple of years, with an estimated 67 million individuals listening to podcasts every month in 2017.
Repurposing written content into spoken can help you reach customers who don’t enjoy reading – expanding your audience to new individuals.
When trying to create different kinds of content, don’t be afraid to get creative.
However, you always want to think back to your target audience.
Focus on creating content that your audience will want to engage with.
3. You’re confusing content with sales pitches
Your content shouldn’t sell.
Sure, the whole purpose of marketing is to create interest in your business and drive sales.
But you can’t start out a relationship with a potential lead with a sales pitch.
Today’s customers don’t like being sold to.
That’s mainly because they don’t need to be sold to.
With the Internet at their fingertips, customers are more capable of discovering their options without ever needing to speak with a salesperson.
In fact, 60% of consumers won’t connect with a salesperson until they’ve already created a shortlist of potential purchases.
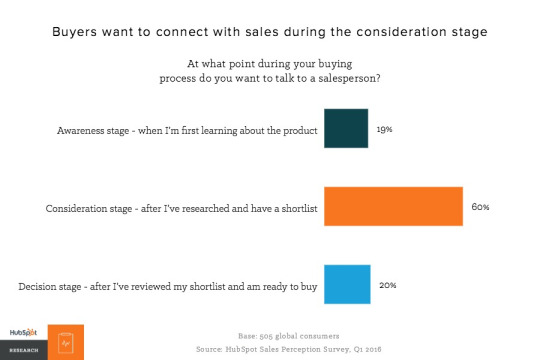
By the time they’re ready to buy, they already know more or less what they’re looking for.
This means you need to use your content to educate them – before you ever have the opportunity to connect.
Your content should be specially formatted to meet the unique needs of your buyer during every stage of their journey.
Let’s break down what that journey looks like.
First, your lead needs to become aware of your brand.
This means you need to be entertaining, engaging, or interesting enough to stand out from the piles of information already on the web.
You can do this in the form of videos, fun blog posts, educational webinars, and engaging social posts.
Take a look at this Instagram post from GoPro.

This high-quality image is attention-grabbing, causing followers to stop their scrolling and take notice.
However, it also shows off what the GoPro is capable of – increasing awareness about the brand and its products.
Next comes the consideration phase.
During consideration, your audience needs to better understand their problem, as well as their available solutions.
The content you might create for them could include product comparison videos or articles, case studies, or podcasts.
Here’s an example of a webinar from Instapage that would attract customers in the consideration phase.

During this webinar, participants learn more about how Instapage and Marketo can help lower their cost of customer acquisition, helping them determine if it’s the right solution for them.
This then brings the lead to the next stage of the buyer’s journey – the decision phase.
At this time, your lead is ready to choose which product or service is right for them.
You can encourage their decision with testimonials, product reviews, and demonstration videos.
Codeacademy uses their Stories page to share how past participants have used their skills to change their lives or careers.

These stories function the same as testimonials, allowing potential customers on the fence about purchasing to see how the decision influenced other customers’ lives.
Raphael Paulin-Daigle of SplitBase.io tells ConversionXL, “A type of social proof that works over and over again is testimonials. Whether it’s in video or written form, they’ve helped increase the conversion rate of the clients’ landing pages in every case.”
If your customer decides to buy, they’ve finally reached the delight phase of the buyer’s journey.
Here, they’ve already purchased, but you want to use your content to encourage them to buy again.
You can do this with newsletters, training webinars, or customer satisfaction surveys.
The Hubspot Academy is an example of content that reaches customers who have entered the delight phase of the buyer’s journey.

By offering training and certifications, Hubspot stays in touch with customers while providing content that can improve their experience as a customer.
Notice how none of these content forms include a sales pitch.
Instead, during each step of the way, the focus is on the customer and helping them find the right solution to their problem.
When your audience feels like you’re helping them, they’ll be more inclined to engage with your content.
4. You don’t know your audience
When you create a piece of content, do you know who you ultimately want to engage with it?
You’re probably thinking “customers.”
Unfortunately, just trying to attract anyone with a credit card isn’t going to get you great results.
With the mass amounts of content and information on the Internet, customers can find content that speaks directly to them – no matter how niche that might be.
To get attention, you need to find your audience and create content just for them.
When you focus your content, you might be narrowing down your audience pool, but you’re making deeper connections.
This can help you see real growth from your content.
Let’s take a look at how Modernweb used a hyper-targeted content strategy to bring in 10,000 visitors in just three weeks.
They started with defining their “who.”
And they got specific.
They came to the conclusion that they would be writing for “technology executives inside of enterprise companies.”
While they had clients who owned startups and small businesses, they weren’t their ideal client. So, they weren’t an area of focus.
Next, they dove into understanding the day-to-day pain points that those individuals experience.
Finally, based on the audience and pain points they established, they created a content plan that addressed those needs.
In this case, Modernweb decided they’d focus on sharing stories from enterprise businesses who had recently switched from older to newer frameworks.
They identified their audience, understood what they were struggling with, then presented them with content that explained how similar individuals handled the same problem.
In just three weeks, their web traffic saw a major jump.
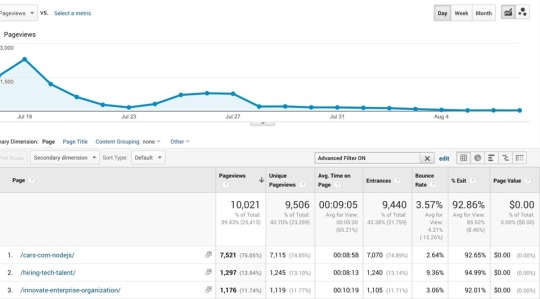
Just from getting to know their audience, they were able to bring more unique visitors to their website and keep them engaged for an average of 9 minutes.
There are a few different ways you can begin to replicate Modernweb’s results.
First, create a buyer persona.
A buyer persona walks you through who your ideal client is.
Here’s an example from ClearVoice.

It breaks down exactly who they are, what problems they experience, and what kinds of solutions they might be looking for.
You can go deeper into your buyer persona to explain things like what they do each day, what kind of education level they have, or what they might do in their spare time.
The more detailed you can get with your buyer persona, the more targeted you can make your content.
If you have a wide range of products or services, you may also want to create multiple personas.
For example, here’s another example from ClearVoice.
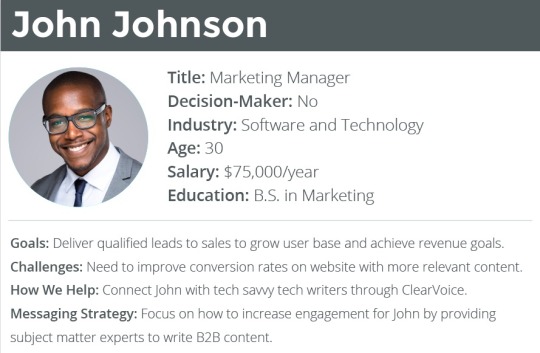
While both John and Sandy have similar needs, they have different goals and challenges – meaning they’ll need to be targeted differently.
This can ensure that each of your audience members is well represented.
Next, pay attention to what they’re doing on social.
Monitoring your customer’s social activity can give you insights into the problems they’re facing, the solutions they may want, and what questions they may have.
You can then use this information to refine your content and guarantee you’re creating something they care about.
Check out the questions they’re asking on traditional platforms like Facebook or Twitter, but also dive into question sites or forums like Quora and Reddit.
For example, if you’re a personal finance firm looking for content ideas, the Personal Finance Reddit page can be a goldmine.
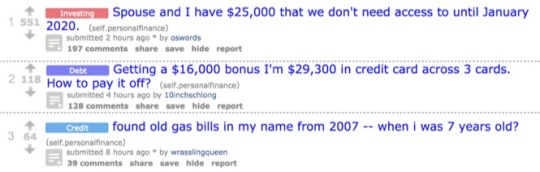
Users are constantly jumping on to ask questions about paying off debt, how to properly invest, or get advice on what to do in credit scams.
Knowing the real-life struggles your audience is facing can help you adjust and refine your content strategy to truly fit their needs.
Both of these pages can give you a great jumping off point for creating new content.
Finally, participate in conversations with your audience.
Get involved in Twitter Chats or Facebook Groups where your audience is hanging out.
Check out how RivalIQ gets involved in a conversation with a participant during the #BufferChat.
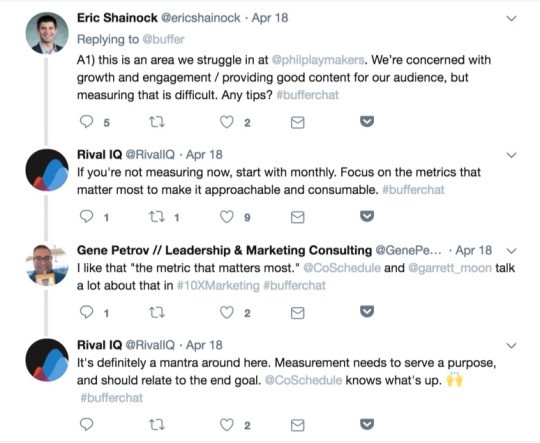
Not only does this allow them to make a great impression, but it also gives them some insight into what potential customers may be struggling with.
As you become familiar with the conversations they’re engaging with, you can refine your messaging and topics to better suit their needs and preferences.
5. Your voice isn’t genuine
Customers want to purchase from companies they believe they can trust.
In fact, the top quality that customers look for in a brand is honesty, followed by friendliness and helpfulness.
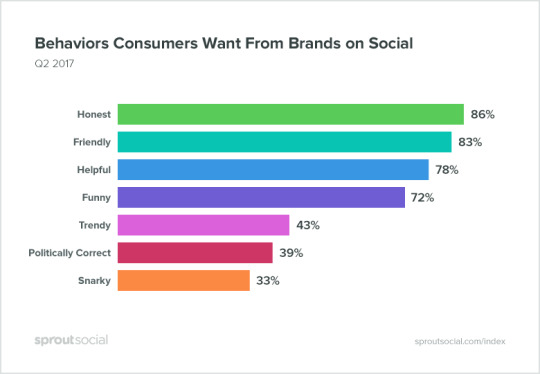
However, if it seems like you’re just putting on a persona for sales, they’re going to be hesitant to connect.
When creating your brand voice, it needs to connect who your brand is with who your audience thinks your brand should be.
Let’s consider this graph for a second.
Snarkiness is the last thing that customers what when it comes to brands on social media.
However, when we look at brands like Wendy’s and MoonPie, their attitude gets them hundreds of thousands of engagements.
So, what’s going on here?
Both Wendy’s and MoonPie have made it their brand persona to be snarky, witty, and sarcastic on social.
It’s who they are – and that’s why it works.
They’re not pretending to have an attitude just for attention.
It’s a unique indicator of their content, allowing them to create a reputation that makes customers want to connect.
Check out this quote from Juntae Delane, Founder of Digital Branding Institute.
According to Juntae, a brand’s voice needs to go beyond simple industry jargon and bland business tones.
Instead, it needs to match with the customer’s needs and provide a human element to the brand.
You can build your brand voice off the buyer persona you’ve created.
Based on your buyer persona, get familiar with the kind of language, tone, or colloquialisms your audience may be using.
Check out how they speak on their own social media platforms.
Then, take a look at the competitors or other brands they’re engaging with.
Once you’re familiar with the way they communicate, create a storyboard for your voice.
Think of your brand as a unique individual.
Outline what your brand likes, what they don’t like, how they perceive themselves, and how they want to be perceived by others.
You’ll also want to dig deeper to consider larger ideas that might not have any direct influence on your brand.
Today’s customers are expecting brands to be more than just a business.
For example, 65% of consumers believe it’s important for brands to take a stand on social or political issues.
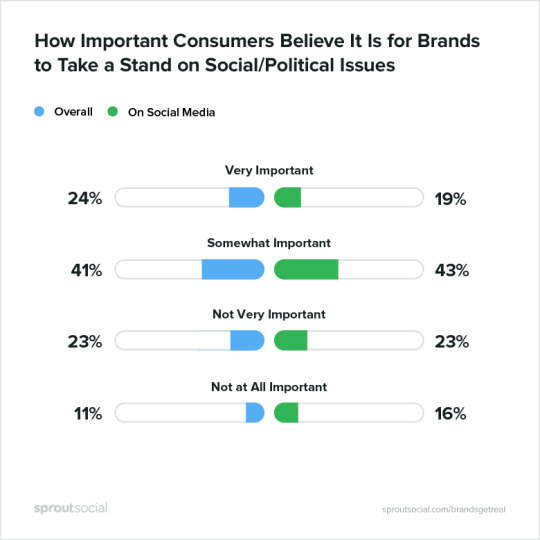
Take a look at the conversation created around Fox News anchor Laura Ingraham criticized Parkland school shooting survivor and gun control advocate, David Hogg, for getting rejected from four colleges.
David responded by calling out all of Ingraham’s advertisers, asking them to pull their support of the show.

Within a few days, companies like Hulu, Bayer, and Nutrish had announced they’d be pulling the ads from Ingraham’s program.
After a few weeks, the program had lost 24 advertisers.
However, not all advertisers chose to separate.
Mike Lindell, founder of the MyPillow, announced he would be leaving his advertisements on the program.

By becoming a part of important conversations and debates, brands can refine their voice and make their opinions and beliefs more well known.
While it’s impossible to prepare for every kind of hurdle or backlash your brand may experience, knowing where your brand falls in these situations can help you create consistent messaging through your content.
6. You’re not promoting
Remember when Beyonce released a surprise album without any marketing?
In three days, she sold almost 830,000 albums.
It was impressive.
However, if you’re trying to use this tactic to promote your content, you’re in for a rude awakening.
Unfortunately, you’re not Beyonce.
And that means you need to promote.
Proper content promotion is really the key to getting attention to your content.
If you’re simply posting links to your latest blog post on your Twitter account, you’re probably going to get ignored.
Take a look at this Tweet from user Vic Maine.

It’s just a link, featuring no context, hashtags, or other interesting information that might entice the reader to engage.
So, it’s not really surprising to see it hasn’t started any conversations or gotten any traction.
However, you can refine your promotion strategy to include email marketing, social, forums, and influencer marketing to improve your results.
First, let’s take a look at social.
Companies have been promoting their content on social for years.
However, the way you should promote and where you should promote is always changing.
Just one shift to the network’s algorithm or design (or even a negative post from an influencer) and your entire promotion strategy might be turned upside down.
Take a look at Facebook, for example.
After changing their algorithm, many brands reported a drop in organic reach.
However, you can work around this algorithm shift by either paying to promote your content or creating content that your audience wants to engage with.
Check out this breakdown Buffer created of important signals that can influence your ranking on Facebook.
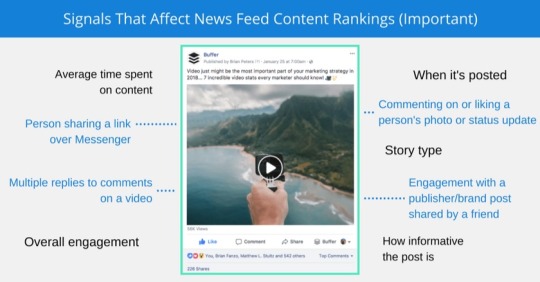
As you can see, some of the most important factors of what gets ranked depends on how users are interacting with the post.
This means you want to focus more on creating content that individuals want to engage with, rather than strictly shock-value content.
You should also make your content easy for your readers or viewers to share your content on their own.
Within blog posts, including “Click to Tweet” bars or share buttons can help encourage visitors to share the content with their friends or family – helping to improve your reach.
Content Marketing Institute frequently uses Click to Tweet bars to make it easier for their readers to share their content.
You can also use more targeted marketing approaches to help reach your audience, such as email marketing.
When you properly segment your email lists, you can share your content with individuals you already know are interested in what you’re sharing.
Take a look at the results MailChimp found for campaigns segmented by interest groups.
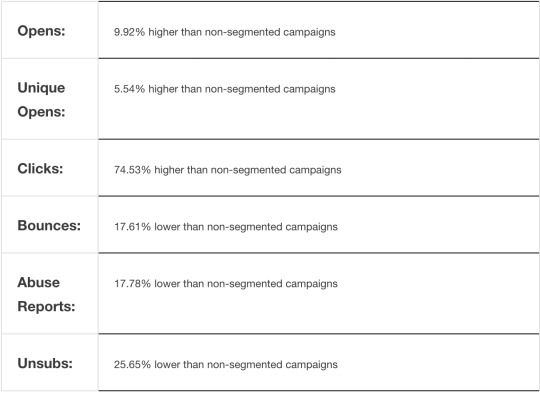
By sending specific content to your audience members based on their interests, you can dramatically improve your campaign results.
7. Your content isn’t properly optimized
Promoting your content is just one side of the coin.
To truly bring attention to what you produce, you want your audience to be able to find what you’re creating.
This means it needs to be properly optimized.
Each piece of content should comply with your greater SEO strategy.
This means going beyond just creating content that your audience wants to read or engage with.
Keywords should be factored into each piece of content you create.
By finding words or phrases that your audience is actually searching online, you can increase your chances of them finding you.
The Keyword Planner from AdWords is one way you can find new keyword opportunities.
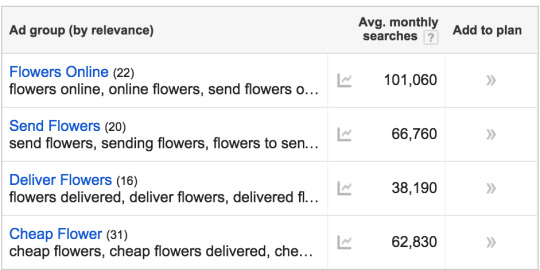
You want to find keywords that are high in average monthly searches but low in competition.
Don’t simply guess at what you think your audience wants.
You also want to make sure your content is properly formatted.
Your titles and heading should be strong and capable of standing on their own.
According to CopyBlogger, 8 in 10 individuals will read a headline – but only 2 in 10 will read the rest.
This means you need to create headlines that your audience can’t resist.
The CoSchedule Headline Analyzer is one tool you can use to improve your headlines.
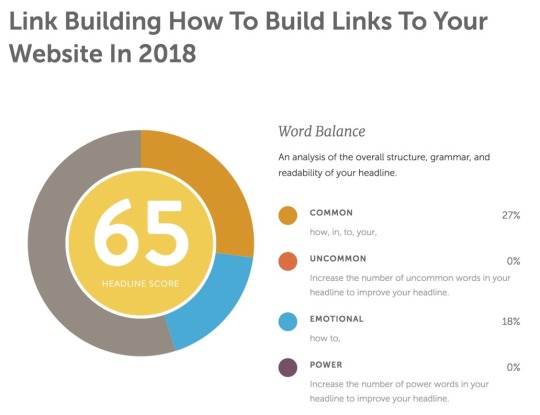
The tool analyzes your word balance to give you an overall score out of 100.
It also provides you with insights on length, sentiment, and even guesses which keywords it believes you’re targeting.
This can help you test the strength of your headlines before you post, saving you trouble and guaranteeing higher results.
But blog content isn’t the only thing you need to optimize.
You also want to make sure your videos, infographics, and images are optimized appropriately.
To optimize your videos on YouTube, start with an optimized title that describes the video and includes the keyword you’re trying to rank for.
This isn’t too much different than writing blog titles.
However, you also want to tag your videos appropriately and write a full description.
Your video description lets the YouTube algorithm know what your video is about.
Check out this description from a DottoTech video.
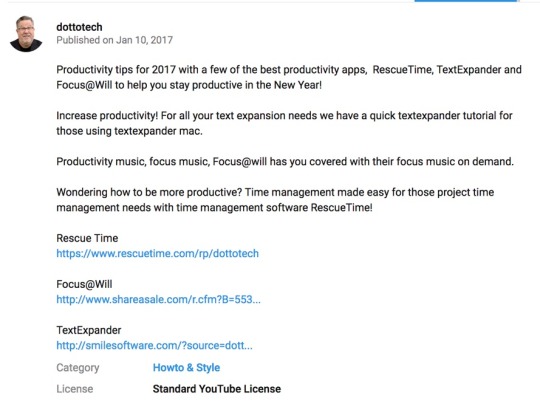
He provides a clear overview of what will be featured in the video, as well as some links to the apps he’s going to talk about.
This can help improve his connection to those pages and gives him the opportunity to further target his keywords.
Images are another area you’ll want to ensure are properly optimized.
First, make sure you’re using high-quality images that are the appropriate size for where they’re being placed.
This can help improve your page load time to keep visitors happy.
You can use a compressor tool to change the size of your image without hurting the quality.
You’ll also want to place the keyword you’re trying to target in the file name.
Because Google can’t actually see what your image is, it’s your responsibility to tell them.
Use captions, alt text, and title text to give Google a better understanding of the image you’re sharing.
Conclusion
In today’s digital age, you can’t afford to create content that is easily ignored.
However, it takes time to craft messaging that your audience will want to engage with.
Keep these seven tips in mind the next time you create content.
What tips or tricks have you found that improve your content-creation process?
About the Author: Neil Patel is the cofounder of Neil Patel Digital.
from Search Results for “analytics” – The Kissmetrics Marketing Blog https://ift.tt/2rEslRi
#Digital #Analytics #Website
0 notes
Text
Landing Pages Are Overrated. Here’s Why and What You Should Do Instead
I used to hate building landing pages.
I’ve certainly made mistakes and had to learn some things the hard way.
For a long time, my landing pages just didn’t work. They were weak and barely converted.
Landing pages are being praised as the magic answer to all of our conversion problems, but it’s not as easy as some people think.
Don’t fall into the trap of thinking you can build a landing page and presto, your conversions will skyrocket.
The conversion rate from a landing page varies across industries, but the average is only 2.35%.
This means that for every 50 people you get to your landing page, only one will actually complete the action you’re trying to get them to do.
That’s a little depressing right?
I have good news for you though. I’ve learned from experience that most landing pages can do better.
The majority of landing pages aren’t really optimized to achieve conversions. They look “pretty,” but they’re not living up to expectations because they’re flawed.
I’m going to show you why landing pages are currently overrated and how to change your game to boost your conversions.
But first, let’s talk about what a landing page really is and what it’s meant to be for.
What is a landing page, really?
In the simplest sense, a landing page is a page you land on.
The problem with that answer is that it’s much too simple.
If someone clicks a link in one of your ads and it takes them to your home page, then by this definition your homepage is a landing page.
Some companies are making that mistake.
Let me show you an example.
I’m searching for “cleaning services seattle” in Google. I click on the paid ad:

That takes me to their homepage:

Now, here’s an example of a landing page done right.
I click this search result:
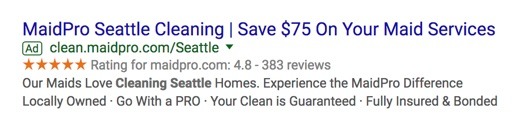
And, here is a landing page tailored to my search preferences:

Your homepage might be a good place to send people if you’re just trying to build general awareness, but it’s not where you’re going to have success with conversions.
A landing page is meant to have one singular goal: To convert.
That’s it. It shouldn’t do anything more than that.
Check out this definition from The Landing Page Course:
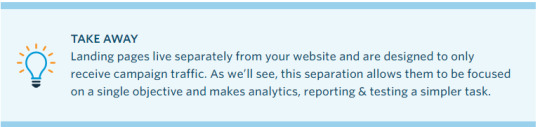
There are two key points here:
They are individual pages with one, singular goal.
They are meant for the single purpose of receiving “campaign traffic,” which means the click-throughs from your Ads and campaigns. This could be social media ads, PPCs or emails.
This means that first, you need to be running a successful ad campaign that is causing the right traffic to click through to your landing page.
After all, if no one is “landing” on your landing page, it’s going to be pretty useless, right?
Assuming that your ad campaign is successful and your CTR is good, then the landing page should have one of two possible purposes:
Capture leads for further communications and to allow you to market to them in the future when they’re further down the sales funnel.
Warm up your potential customers to get them ready and eager to purchase your product or service before sending them through to close the deal.
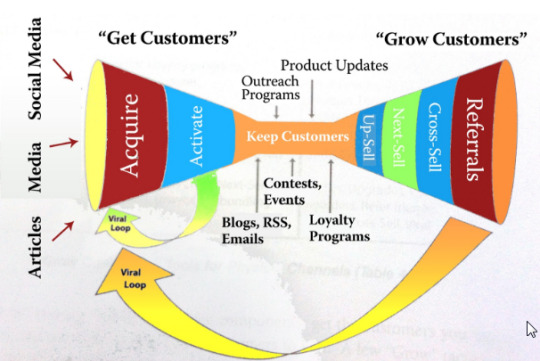
Each of these purposes requires a different type of landing page.
Good landing pages can provide a number of benefits:
They help promote a positive first impression.
Ion Interactive says first impressions are formed in just 1/20th of a second. Landing pages can be customized and designed to help provide strong positive visual impressions quickly.
They can take advantage of trust elements.
Landing pages with images, videos and graphics can not only help attract people, but they will help you make a lasting impression.
People only remember 20% of what they read, but they remember 80% of what they see.
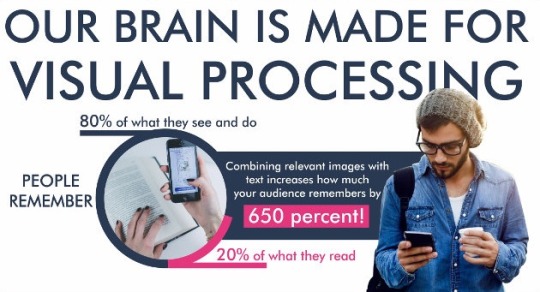
Landing pages promote customer focus.
It’s easier to capture conversions from a well-designed landing page than it is from a homepage or blog post because they have one singular goal. There is less noise to distract your audience.
All of this means that landing pages are the ideal place to get your audience to convert if they’re done right.
Conversion Rate Experts generated $1 million/ year for Moz simply by improving their landing page and doing some email promotion.
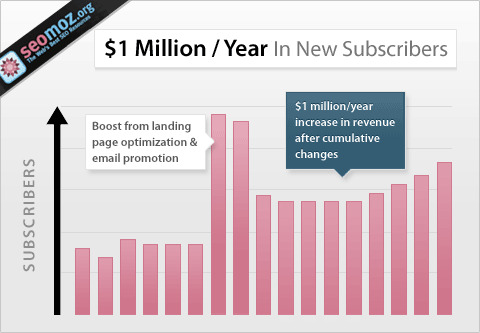
So why are landing pages overrated?
Well, it’s not because they can’t work. It’s just that too often people use a generic template or slap something together that just doesn’t get the job done.
Don’t worry if you’re one of those people. After all, when I started out my landing pages limped along too.
But now I’m going to share with you what I learned and what the most common mistakes are so that you can make sure your landing pages are doing their job.
1. Sync it with your ad campaign
Like I mentioned above, the very first step if to have an effective ad campaign.
You need to be targeting the right audience for your landing page, or nothing else matters.
After all, sending people ready to buy through to a lead generation page is not going to be very successful.
But syncing intent is not the only thing you need to focus on.
Your ad and your landing page need to have a consistent look and feel.
Here’s a great example of consistency:

You can see in this campaign from Highrise that the ad and landing page look very similar.
Here are some of the things they made sure to keep consistent:
The image of the woman is the same.
The theme is the same, including the background color, logo, font, and look of the CTA.
The testimonial is the same.
Now, check out this example:

The ad talks about the “lowest taxation in the EU,” then you click through to a page talking about Bulgaria. What?
After reading the fine print, you can see how they tie together but remember that first impressions happen in seconds.
My guess is a lot of people click that end, see a landing page that doesn’t seem to match and instantly hit their back button. I know I would.
2. Make it mobile-friendly
Mobile landing page optimization is vital now that Google has switched to a mobile-first index.
The number of mobile users increases every year. Last year 66% of the population had a mobile phone.
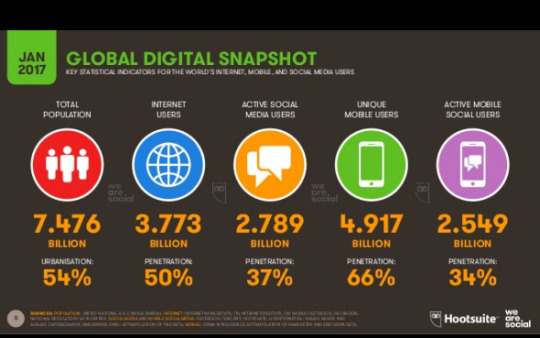
That’s up 5% from the year before. I’m sure when they come out with this year’s stats it will have increased again.
Mobile users are beginning to dominate web traffic.
As of last year, over half of all web traffic is mobile.
Not only that, look at the breakdown by time of day:
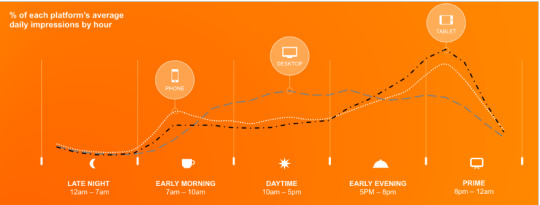
Mobile is dominating the hours when people are typically outside of work.
These are the times people are most likely to be using the web for something other than work, such as browsing the net or shopping.
Which means if you want to capture your audience, you need to plan for them being on a mobile device.
When it comes to mobile traffic, the two most critical aspects of your landing page are speed and simplicity.
Let’s talk about keeping it simple first.
Take a look at these two examples:
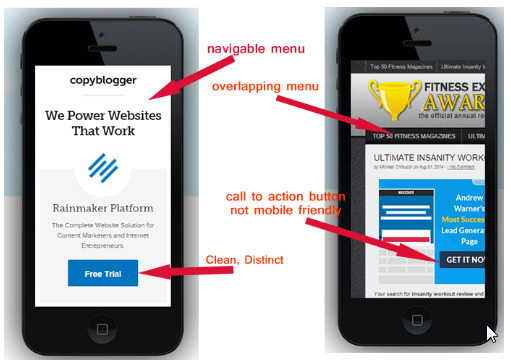
It needs to cut out everything but the absolute necessities, and it needs to be designed for mobile.
Having a CTA that’s only partially visible is going to lower your results.
Making it too difficult to read on a small device is also going to hurt your conversions.
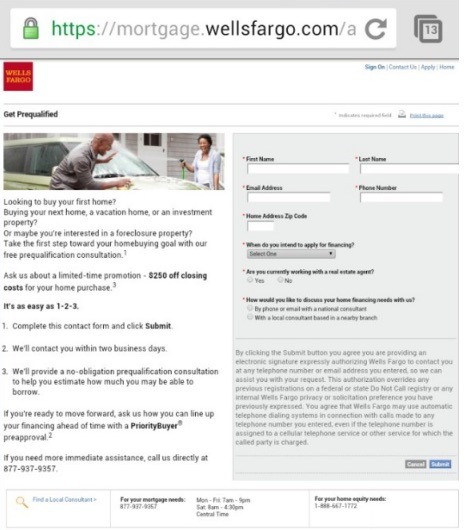
3. Check that your load speed is fast
Page load speed might not be something you first thing of when designing a landing page, but it’s critically important for mobile and desktop traffic.
In fact, Google announced in January that starting July 2018 pagespeed will become one of their ranking factors for mobile searches.
40% of your audience will leave your landing page if it takes longer than three seconds to load.
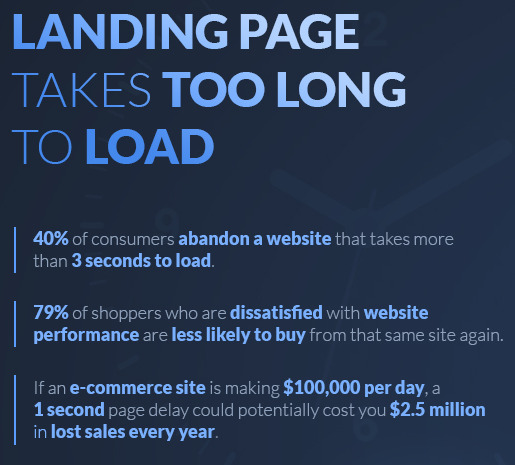
It won’t matter if you get every other step right if no one ever hangs around long enough to actually view your page.
A lot of businesses are struggling with this, especially for mobile.
According to Google, the average time it takes to load a mobile landing page is getting better, but it stills takes an average of 15 seconds.
I just told you 40% of people will leave if it takes longer than three seconds.
When you isolate mobile traffic, that number actually increases to 53%.
So over half your audience will leave in three seconds or less and the average site takes 15 seconds…
Simply fixing your page speed could have a huge effect on your conversions without changing any other thing about your landing page.
Google also found that bounce rate continued to increase the longer page load took.
Here are their findings for mobile traffic:
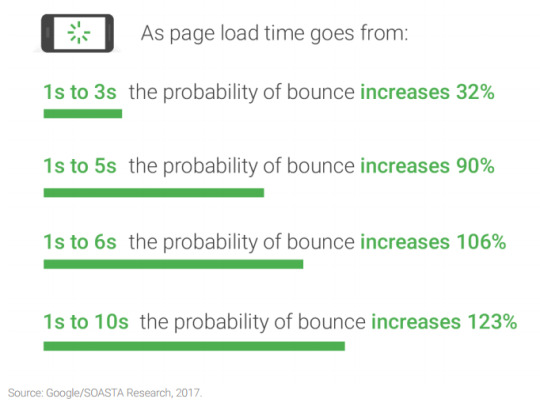
How do you know if your page is too slow?
For desktops, you can test with Google’s PageSpeed Insights.
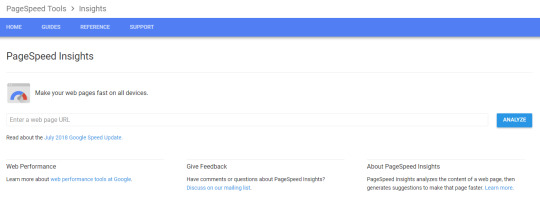
For the mobile version of your site try Test My Site.
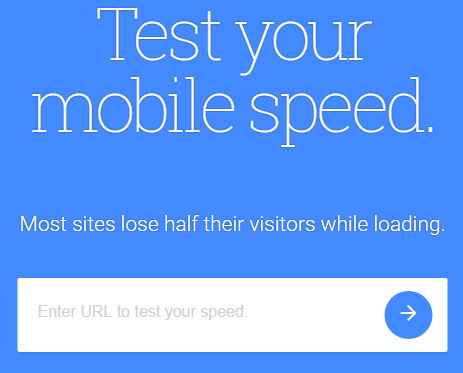
If your speeds are not where they should be, then make sure you take the right steps to boost them before worrying about anything else.
4. Make sure your headings work
Once your page loads, one of the first things your audience will notice is your heading and subheading.
When thinking about landing page design, always keep in mind that first impressions count.
Your headline is one of your first impressions. It needs to be clear, attention-grabbing and reflect the purpose of your page.
Check out this headline:
It’s simple, straightforward and you know what they’re selling.
Their subheading reinforces the message and adds more information, without being too long or distracting.
Now take a look at this one:
The title is catchy, but it doesn’t give you any idea what the product is.
The only thing that saves this is the subheading is perfect. It provides the context that they’re missing in the headline.
The subheading needs to complement and build on the main heading.
Its purpose is to give your readers a little more information while keeping them engaged and enticing them to continue down the page.
Check out Slack’s homepage:
While this is actually a homepage, it captures the key aspects of headings that you should use on your landing pages.
5. Remove all the distractions
One of the key distinctions of landing pages is that they only serve one purpose.
Even though Slack’s homepage is pretty clean, it would fail as a landing page for a couple of different reasons.
The first is that, like any homepage, it has distractions.
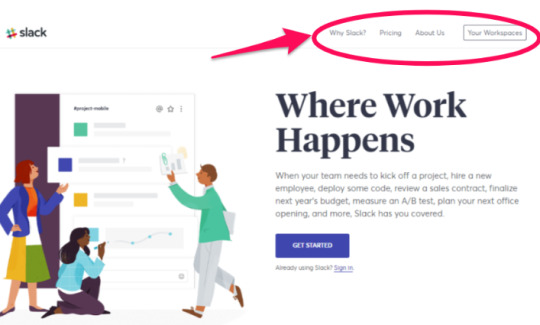
Your landing page shouldn’t have a navigation bar.
Why?
It’s been shown that removing the navigation menu on your landing page can increase your conversions by 100%.
But only 16% of landing pages don’t have navigation bars.
This is a simple fix that more people should be taking advantage of.
Another way you’re distracting your audience is with too many words.
There’s a direct correlation between lower word counts and higher conversions, especially in the health and travel industries.
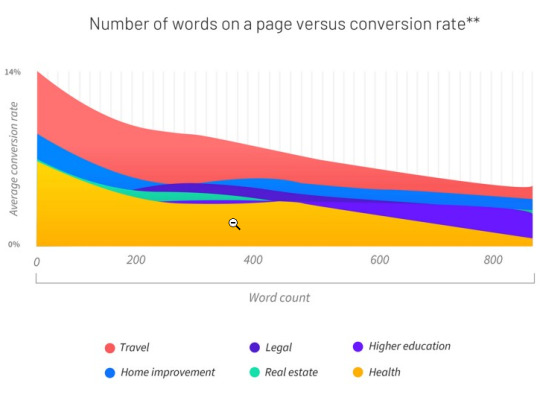
Don’t put too much text on the page. Keep it as visual as possible with bullet points or infographics.
You need to include enough information to make it clear what problem you’re solving for your customer, but in as few words as possible.
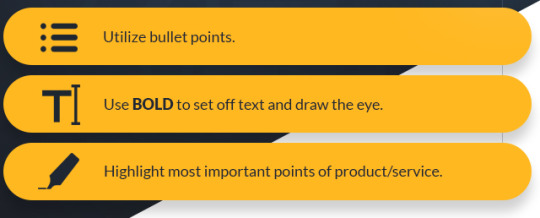
I know it’s a bit of an art, which is why it’s crucial to test your landing pages (we’ll get to that later).
6. Use the right CTA
A landing page should have one call to action.
Over 68% of businesses have five or more CTAs and links on their landing page, yet stats show that having only one CTA boosts conversions.

Choose one specific goal and CTA for each landing page and stick to it.
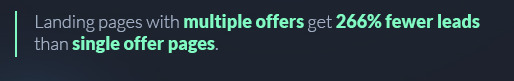
Make sure that your call to action is relevant and consistent with your offering.
Using something vague such as “click here,” “submit,” or “continue” will not convert as well.

Your CTA is the whole reason for a landing page. It is the most important element.
You need to make it stand out.
Choose a bright color, make it a large button with a bigger font.
Draw attention to it, with arrows or other visuals. You want your audience’s’ eyes to be drawn to it naturally.
7. Limit what you ask for
Landing page abandonment can happen in the same way as cart abandonment.
One of the big triggers for abandonment is asking too many questions.
Most companies want to get as much data as possible. However, there are conflicting results when you reduce form fields.
You don’t necessarily have to limit form fields to some artificial number. But you should just focus on what’s important.
For example, asking your audience for their age immediately drops your conversion rate.
There’s often no point in collecting that data up-front!
Here’s a simple example from Optimizely:
You can also use interactive screens, like Oscar Health, to break up the questions.
This increases your chances of your audience interacting and completing the form fields without abandonment, since it breaks up the fields, making it seem like less.
Consider adding a progress bar so that your audience knows they’re getting close to the end and the screens don’t actually go on forever.
Also, keep in mind our fields need to be optimized for mobile. If it’s painful to do on a phone, people will flee.
8. Have the right visuals
First, I should be clear that visuals aren’t just images anymore.
I’ve seen video landing pages convert at 56%!
Here are just some of the benefits of putting a video on your landing page:
They increase audience retention. An engaging video keeps people hanging around longer, which allows your message to penetrate.
They also increase trust. Assuming your video includes a real person, it gives your product a life and voice. This will immediately increase your audience’s trust.
Your audience wants to watch videos. Unbounce found that people prefer to watch a video over reading an article, as long as the video is 5 minutes or less.
If you’re going to incorporate a video, make sure you embed your call to action within it (as well as elsewhere on your landing page).
Take a look at how Derek Halpern included his CTA:
Videos are also a great way to demonstrate your product.
If you have something that is difficult to assemble or use, videos are ideal.
For example, Long Tail Pro includes a video that walks you through exactly how to use their software.

Don’t make it too long; keep your video short, to the point, and useful.
Any images on your landing page should be relevant to your product or service.
Try to choose pictures that meet the following criteria:
They should be large.
They need to be relevant to your product or service. Make sure that if you sell a product, there is an actual picture of it on your landing page.
Don’t ever use stock images.
All your images need to be high-quality.
Including an image of a person looking directly at your call to action is an easy way to boost conversions instantly.
Here’s an example:

When we see someone looking at something, we’re naturally drawn to look at it as well.
It’s a simple yet effective way to direct the attention of your audience to where you want it.
9. Include reassurance and testimonials
Want to hear something controversial?
The best salesperson in your company isn’t actually the best in my experience.
Instead, the best salespeople are often your past customers.
People want to hear from other people’s experience.
That’s why always make sure to use clients’ testimonials on every single landing page I create.
Testimonials help to build trust in your personal brand. People trust other people more than they trust a company.
More than three out of four marketers don’t include social proof, yet it can boost your conversion rate by more than 1%.

1% might not seem like a lot, but the average landing page conversion rate is only 2%.
If you’re new and don’t have many testimonials yet, there are other ways to reassure your customers.
Consider showing your trust indicators to reassure users that your site is safe.

You can also build trust by sticking to the facts and using precise numbers whenever you state any statistics.
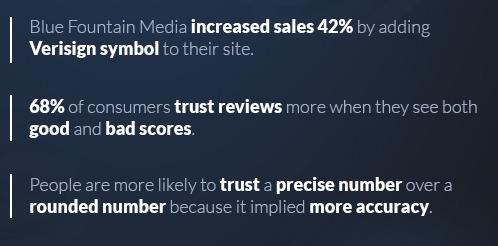
Make sure you don’t overstate results.
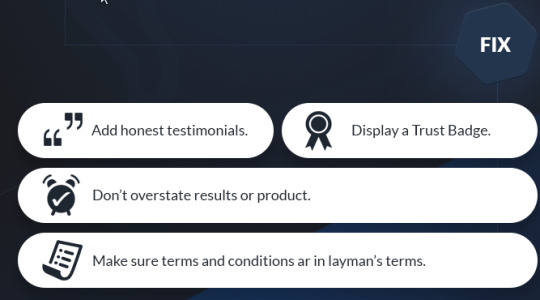
Saying something is the best without backing it up will make people think you’re trying to trick or scam them.
Avoid superlatives like “best,” “fastest,” “cheapest” unless you can prove it with research.
Another way to reassure customers is by offering a guarantee.
Free trials or money back guarantees help build trust and boost conversions since they’re low risk.
You can also increase customer confidence by providing contact info.
SImply giving people a way to reach you can help reassure them your site and product or service is trustworthy.
10. Add a little pressure or incentive
An additional incentive to encourage customers to click your CTA can help boost conversions, particularly if your landing page is for lead generation.
Offering a free e-book or guide can help increase sign-ups.
Just make sure the content you provide is valuable, or any future marketing efforts toward these people won’t work well.
Whatever free gift you choose should be seen as an investment toward later paid conversions.
Remember the old saying about the carrot or the stick?
The gift is a carrot to entice conversions. You can also use a stick or “threat” to scare people into action.
Now, I don’t mean a real threat.
I mean use language such as “limited time offer,” “only 24 hours left” to increase your conversion rate.
11. Test, test, and retest
There is a science to landing page structure, but there is also an art to it.
To find the best landing page design for each of your campaigns you need to test them.
Many marketing blogs will rave about long-form landing pages. But guess what? Those don’t always convert the best.
The catch is that some companies, like Conversion Verve, have found that shorter pages actually converted better for them.

So even when you read about what works best on average, it doesn’t mean it will work best for you.
Sadly, barely half of companies actually test their pages today.
But testing has proven to boost conversion rates.
The companies whose conversion rates have improved year over year are executing 50% more tests on average.
A good way to test your pages is with heat maps.
A heat map gives you a simple visual of where your visitors are looking and clicking when on your landing page.
You can see what areas of your page people are paying attention to and what’s not working.
Of course, I’m a little biased, but my preferred heat map software is Crazy Egg.
All you do is enter the URL of your landing page, create an account, and check out your heat map.
Here’s an example of a scroll heat map:
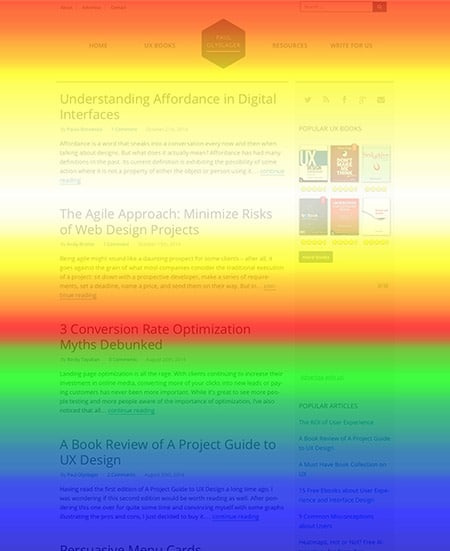
The areas in red are getting the most attention.
In this example, you can see that not a lot of people are making it down to the bottom.
If your CTA were at the bottom, this would be a problem.
You can use heat maps to see where people are clicking:

Heat maps can quickly show you if your headlines, content, or CTAs aren’t getting enough attention.
Conclusion
Landing pages are often expected to convert people effortlessly, yet the average rate is around 2%.
Of course, the problem isn’t with landing pages exactly. It’s with how they’re being built and used.
A landing page needs to have one singular goal, and every part of it needs to be designed to move viewers toward that goal.
First, make sure your landing page is consistent with your campaign, then make sure it’s optimized to be fast and mobile-friendly.
Your headings need to be attention-grabbing, and all distractions, noise, and clutter need to disappear.
Use an effective CTA and limit the amount of information you ask customers to provide.
Make sure you use great visuals and provide social proof or guarantees to reassure people it’s low risk to convert.
Remember, you can always offer an incentive or a little pressure to encourage people to click the button.
Finally, always make sure to test your pages. Use A/B testing or heat maps to see what’s working and improve what isn’t.
What tips or tricks haven’t I mentioned that helped boost your landing page conversions?
About the Author: Neil Patel is the cofounder of Neil Patel Digital.
from Search Results for “analytics” – The Kissmetrics Marketing Blog https://ift.tt/2jIkBJo
#Digital #Analytics #Website
0 notes
Text
Introducing Sherlock — User Engagement Scoring for SaaS Businesses
We are super excited to introduce Sherlock – a new product from Space Pencil (the folks that brought you Kissmetrics) – to the market this week.
Sherlock is a user engagement scoring application built specifically for SaaS businesses – for whom user engagement is…well…pretty much the whole point.
We built Sherlock to help SaaS businesses finally wrap their arms around the elusive beast that is user engagement – to make it tangible and accessible. Oh…and actionable. Very actionable. Sherlock is an analytics product with a purpose – to help make user engagement a centralized metric that drives actional across your SaaS operation.
WHY SHERLOCK EXISTS
Sherlock went from a personal desire, to a hack, to a prototype, to the product we just released over the course of several years. In many ways Sherlock was a passion project – a scratching of our own itch – and in many ways it is filling a need in the market that we can’t believe hasn’t been properly filled.
We build Sherlock for three main reason:
In SaaS, user engagement really matters
There has never been a good way to measure and quantify user engagement
User engagement is a metric that should be operationalized across an entire organization
1. In SaaS, user engagement matters — a lot. No, seriously, a lot.
This sounds like an obvious point, but one that cannot be overstated.
The entire SaaS business model is based on retention. Without retention, there is no SaaS business.
And retention is based on engagement. If people don’t use your product, they will cancel.
No engagement, no retention. No retention, no business. The formula is really not more complicated than that.
User engagement is also one of the true leading indicators for a SaaS business. As investor David Skok said in his great blog post on the topic:
“The goal of a SaaS CEO should be to increase the profit they make from each customer (LTV), and lower the costs in sales and marketing that it takes to acquire each customer (CAC). Measuring Customer Engagement is a key tool that will help you achieve that goal.
Honestly, outside of revenue, there isn’t a metric that is more important to a SaaS business than user engagement.”
In many ways, user engagement is the lifeblood of the entire SaaS business model. So…it’s something that should be measured and managed like any other KPI. However…
2. There has never been a good way to measure actual user engagement
I have been searching for a good solution for measuring user engagement since I started building SaaS businesses. It simply blew me away that there wasn’t an easy (and effective) way to truly measure and understand all sides of user engagement. It has been one of my greatest frustrations over the course of several SaaS businesses.
And yes, yes…I’ve used general analytics tools. I’ve tried almost all of them. But none of them really understood what I wanted. What I needed. While they held all my data, offered many different ways to slice-and-dice, none of them answered my question – quantifiably – on user engagement.
What I always wanted while running SaaS businesses wasn’t that crazy. I wanted to:
Know my best users/accounts
Understand what makes them great
Make more of them
Isn’t that really what every SaaS business wants?
For that to happen, user engagement needed to be quantified in a way that no general analytics tools could do. There needed to be a solution that focus on just this.
3. User engagement is a metric that can & should be operationalized across an entire organization
As a foundational metric that drives a SaaS business, each part of the organization should be using some slice of quantified user engagement to help drive their daily work. For example:
Product should use user engagement scoring to determine if their work building features is actually helping increase overall engagement;
Sales should be prioritizing their outreach to trial accounts based on the engagement level of those accounts (see the Product Qualified Lead model)
Customer Success should be using engagement measurement to drive upsells, save at-risk accounts and give context for all support interactions.
Design should use engagement scoring to determine the best sources for user feedback.
Marketing should use engagement scoring to better target message, identify potential advocates and more.
Boards and investors should use user engagement measurement as a factor in future investment.
User engagement, when done right, can drive operations across the entire organization — this list is really just scratching the surface. A good engagement scoring platform will make it very easy to connect engagement data with the various tools used to drive your operations.
These are the three fundamental reasons why Sherlock now exists in the world. If you need more reasons, this post on the Appcues blog is a good reference.
HOW SHERLOCK WORKS
Sherlock works by giving SaaS teams the ability to create a custom engagement scoring model for their product.
The Sherlock journey starts by sending product usage data to Sherlock via Segment.com (right now, we only accept data from Segment). Then a user simply weighs key product events (with a weight between 1–10) based on their importance to overall engagement. It looks like this:
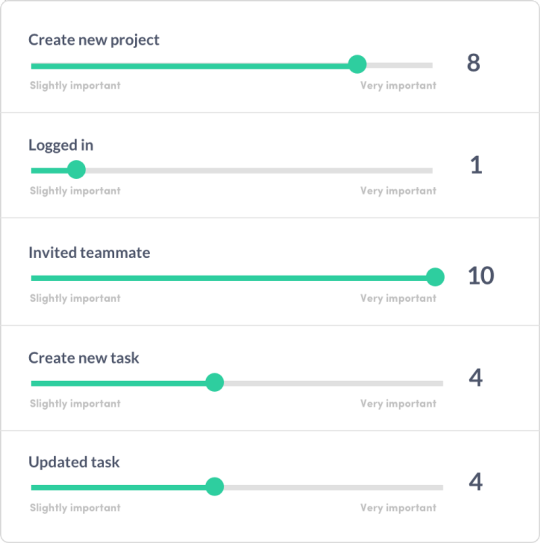
All actions are not created equally. For every product, certain actions (or events) are simply more important than others. You know this better than anyone, that is why Sherlock allows you manually set these weights. Once that is done….voila! The entire Sherlock product is populated from there and you will immediately be able to:
Discover users ranked by engagement
A full list of your users, ranked by their engagement-level with the product.
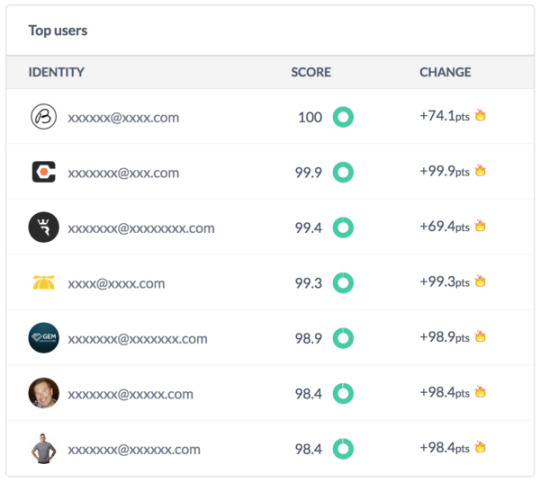
In Sherlock, all users get an engagement score between 1-100. This allows you to discover your top users in seconds (we promise, you WILL be surprised by the people driving engagement). Also, uncover who is rising or falling, what they do and how their engagement trends overtime.
Uncover Account-level engagement
Truly understanding engagement at the account-level is incredibly valuable for SaaS businesses. I would argue essential.
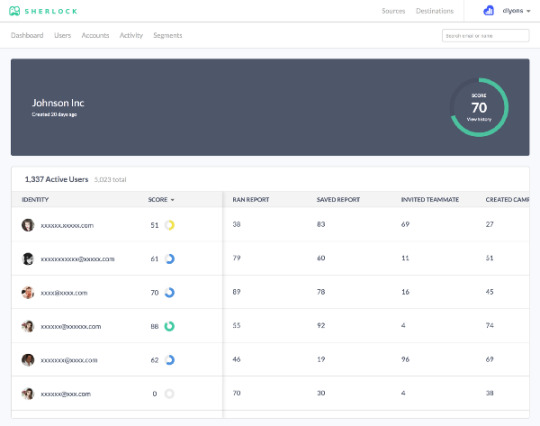
With Sherlock, you get a ranked list of your accounts as well as a list of all users on that account, by engagement level. This is incredibly helpful for many reasons, but especially when planning account management activities.
Track overall product engagement over time
On the dashboard, track total active users, average score per user, as well as total product engagement over time. Nowhere else can you get data that informs you of the overall performance of your product overtime.
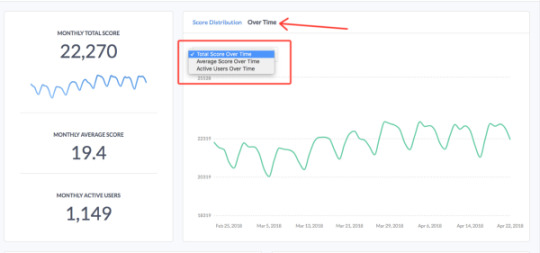
Compare engagement by segment
Create custom segments for different groups of users and compare their engagement.
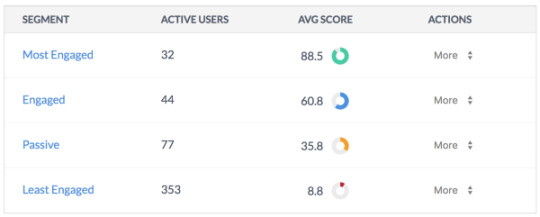
See which events are most engaging
Get a view of all the activities (events) from your product over time and see which events are actually driving more engagement.
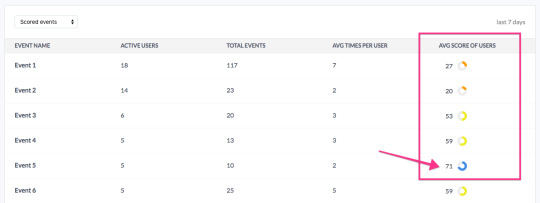
Ship engagement scores to all your important operational tools
The most important thing you can do with this quantified engagement data is to get it make it accessible in the key tools that will allow you to take action on it. We ship engagement data to Segment, Intercom, Salesforce, and Slack.
Again, we are incredibly happy to be able to bring Sherlock to market. If you are running a SaaS company at any stage, I can’t imagine how you can run your business without a clear understanding of user engagement and all the benefits that come from that understanding. This is what Sherlock is built to do and we feel very confident that it will bring a ton of value to your SaaS business
Signup today for a 17-day free trial at https://www.sherlockscore.com
About the Author: Derek Skaletsky is the Head of Product and Customer Success at Kissmetrics. Previously, he founded the engagement automation app Knowtify which was acquired by Kissmetrics.
from Search Results for “analytics” – The Kissmetrics Marketing Blog https://ift.tt/2w6KLyK
#Digital #Analytics #Website
0 notes
Text
How to Repurpose Content (and Why it Matters)
There’s no need to reinvent the wheel.
Ever heard that before? It’s excellent advice for virtually every job, task, industry, and endeavor. If you have something that works, use it.
Build off it. Adapt it. There’s no need to start from nothing
And when it comes to your content marketing, it’ll not only save you time, but it can deliver big, big results.
How so? By repurposing content you’ve already created.
“Repurposing your content opens the doors to reaching more people and breathes life back into old posts that you know are well written and highly informative.” ~Elna Cain, Professional B2B Writer
29% of top marketers repurpose their best content, while 27% listed producing enough quality content as their biggest challenge in a separate survey.

Overall, not having enough time, the quality of their content, creating that content, scaling content creation, and generating ideas were the top five most mentioned challenges facing the modern marketer.
The benefits of repurposing content? Those top five challenges are alleviated and made easier.
You could brainstorm new ideas, conduct research, draft, revise, polish, a/b test headlines and blurbs, publish, and promote a new blog post every few days…
Or you could take an existing asset that’s already a winner, repurpose it, and promote, promote, promote.
Which one sounds like the better use of your time?
What is Repurposing Content?
It’s exactly what it sounds like.
Repurposing content simply means taking an existing piece of content and using it in a new way for a new audience.
Blog series to ebook, for example. Or infographic to video.
There’s no shortage of transformations you could make. Marketers use a wide variety of channels, types, and formats for their content.
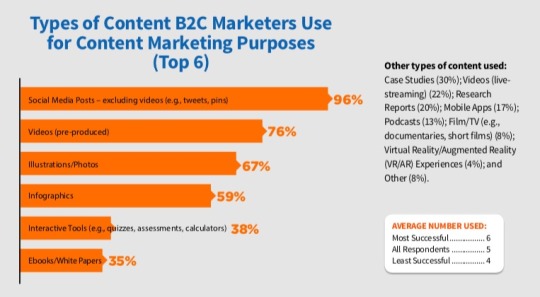
Videos, illustrations, infographics, ebooks, white papers, webinars, case studies, podcasts, charts, graphs, blog posts, quizzes, slide decks, reports, and on and on.
In fact, releasing quality content as only one type is really doing it and your audience a disservice.
Why Should Your Website Repurpose Content?
To begin with, not everyone likes blogs. Or videos. Or white papers. Or infographics.
If you spend hours, days, or weeks creating something spectacular, and you release it to the world as “just” a blog, many people will never give it a second look.
Content marketing is about getting as many eyes on it as possible.
Eyes on it means traffic, traffic means shares and interest, shares mean more eyes and greater awareness which generates still more eyes on it, which means more prospects and potential for conversion, and round and round it goes.
“Content marketing’s purpose is to attract and retain customers by consistently creating and curating relevant and valuable content with the intention of changing or enhancing consumer behavior. It is an ongoing process that is best integrated into your overall marketing strategy, and it focuses on owning media, not renting it.” ~Content Marketing Institute
Attract and retain customers.
Let me ask you this: are you only targeting blog readers? How about only those that watch videos online? Do you only want to keep those existing customers that enjoy infographics? Of course not. You would never intentionally limit yourself, your brand, or your product that way.
But without repurposing your content, that’s essentially what you’re doing. You’re not providing for them in the ways they want and appreciate.
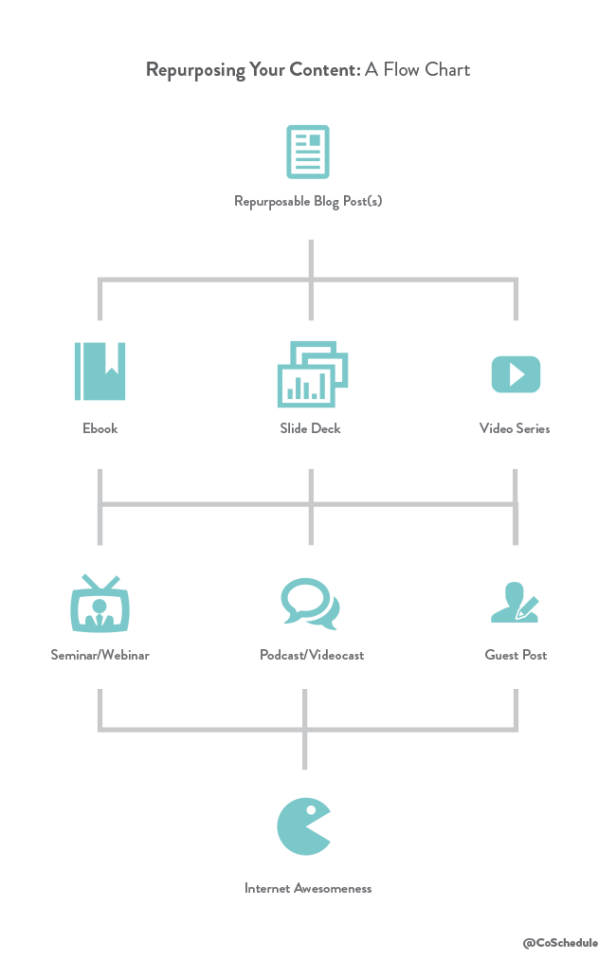
Repurpose your best stuff, and it reaches more of your target audience in the places and ways they want to be reached.
Benefits of Repurposing Content
In addition to reaching a wider audience in the types and formats they want, the benefits of repurposing content include:
Better chance to be seen. We spend a lot of time online: an average of 40 minutes/day on Youtube, 35 minutes on Facebook, and 15 minutes on Instagram. It adds up to 5 years and 4 months over our lives. That’s nothing to sneeze at, but it also means there’s a greater probability of someone missing that tweet about your new blog post than of seeing it. Social media moves too fast, and no one is online all the time. Want your content to be seen? You’ve got to repost and repurpose. The rule of seven tells us that the average consumer needs to see your message seven times before they buy into it…or you.
The life expectancy of a social media post is relatively short: a typical tweet has a half-life of 24 minutes, a Facebook post reaches 75% of its maximum impressions in 2 hours and 30 minutes, and blog posts by top brands receive 50% of their comments in the first 6 hours. The takeaway? Repost, reschedule, and repurpose.
Give your search engine optimization efforts a boost. A well written blog post will have several targeted keywords. Repurpose that content as an infographic or podcast, and you’ve increased the opportunities you have to rank for those keywords. A better rank – or multiple rankings – means a better chance to divert more of that search volume traffic to your digital doorstep. You’ve already done the keyword research, so maximize your possibility of succeeding with it.
Save time for promotion, which is the lifeblood of content marketing. The less time you spend on brainstorming, researching, and creating content, the better. The majority of your time and effort should be spent on promoting it, not making it.
Build your authority and reputation. The more people see your name attached to content on a particular topic or industry, the more your online reputation grows. You need to be seen as an expert. You want to be considered the go-to guy or gal. Authority is one of the six principles of persuasion as outlined by Robert Cialdini. Persuade, then convert.
Increase your return-on-investment. Quality content takes time and money to create. Repurposing blogs, repurposing video content, and content recycling in general lets you squeeze extra value out of money you’ve already spent. Get more with no additional cost. That’s a business strategy everyone can get behind. That $500 blog post can be repurposed for next to nothing, giving you more bang for your original buck.
Diversify your content catalog. No one wants the same thing for supper every night.
Generate more opportunities for quality backlinks. People sharing your content creates backlinks to your site, and they’re a crucial and beneficial ranking factor.
It takes a great deal of resources – time, energy, and money – to produce a valuable, useful piece of high quality content.
Using it once is a waste. You wouldn’t buy a new laptop and log on just once, or use it just for emailing, right?
So why do that with your content? The mantra for content marketing in 2018 and beyond should be “repurpose, promote, repeat”.
4 Repurposing Content Examples For SaaS Business
By now, you should be convinced of the benefits of repurposing and are probably ready to see some content repurposing examples.
The proof, as they say, is in the pudding.
Does it really work? What exactly can be repurposed? Let’s take a closer look.
The No New Content Challenge
Buffer is one of the major players in the content curation and scheduling game.
Many of you likely use its social media management platform in your content marketing.
The Buffer Blog consistently produces high quality and useful content on everything from social and digital marketing to productivity and the customer experience.
For one month in 2015, they wanted to see what would happen if they repurposed their existing content rather than created new stuff.
With a blog that regularly saw 600,000-700,000 monthly visitors, the stakes were high.
Instead of writing new posts, they created new email campaigns and ebooks using old blog posts, updated outdated posts, created SlideShares and videos from blog posts, and republished to Medium.
The result?
While overall traffic dipped slightly, their organic search traffic was up by over 4%, the resulting SlideShares produced nearly 200,000 views, an ebook on social media tips curated from old posts brought in 2397 signups and downloads, and an email drip campaign called “The 7 Day Social Media 101” and a 25-day video course nabbed 17817 and 18185 (in the first 6 days alone) signups, respectively.
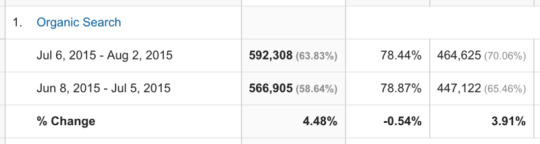
And all with no new content for 30 days. So, does repurposing content work? (hint: yes).
Matthew Woodward
SEO and affiliate marketing professional Matthew Woodward decided to repurpose and republish a couple of blog posts on LinkedIn Pulse. With minimal tweaking, he published with a link to a new landing page for an existing lead magnet.
The experiment garnered 332 new subscribers and a conversion rate of 76.15%.
Convince & Convert
Jay Baer of Convince & Convert creates a lot of content, including 3-minute informational videos.
In order to reach a bigger audience, he and his team began repurposing that video content as blog posts on the C&C website, LinkedIn Pulse, and Medium, and as podcasts (distributed via iTunes), effectively covering the text, video, and audio crowds.
Convince & Convert has been crowned the #1 content marketing blog in the world by CMI, attracting hundreds of thousands of potential prospects for their consulting services and marketing tools.
Moz
It you want to learn about all things SEO, you need look no further than Moz.
Their blog is chock-full of posts on everything from keyword research to link-building to audits and everything in-between.
Once a week since 2007, they’ve repurposed their best blog content as an engaging and informative video series called Whiteboard Friday.
It’s legendary in the industry. Iconic. And its fans are legion.
That kind of loyalty, advocacy, and brand recognition is priceless, bringing in a steady stream of referred traffic and leads.
A mind-boggling 11% of the top SaaS companies in the world do not blog.
That’s shocking at any time, but in 2018 that’s simply insane.
A blog is the foundation of any content marketing plan.
And a blog is the content bank from which you can pull and repurpose from now until the cows come home.
Blog. Promote. Repurpose. Promote. Succeed.
How to Repurpose Content in 2018
By this point, you may be thinking “Okay, okay, I get it. Repurposing content is extremely beneficial and efficient.” And you’d be right.
But, you’re probably also thinking “How do I do it?” It’s one thing to know why, but something else entirely to know how.
It’s easier than you might be expecting.
Identify the Posts Worthy of Republishing
If you’ve got a sizeable content catalog, deciding which ones deserve your repurpose attention is step one.
Head on over to your analytics dashboard and check to see what posts have been your best performers in the past month, past year, and possibly even past 4-5 years.
Look for those posts with the highest pageviews and/or average time on page.
Use a tool like BuzzSumo to find your most shared pieces.
These are the pieces resonating most with your audience and visitors.
This is the content most likely to benefit from a little repurposing magic.
For each asset, consider how you might be able to transform it.
Blog to video, video to transcript, podcast to infographic, series to ebook, and so on.
While you’re at it, be on the lookout for content that is either a) outdated, or b) a topic on which you have greater knowledge now than you did when you wrote it.
These can be updated and expanded with little effort, allowing you to promote the new and improved version.
“Content repurposing doesn’t just mean that you reuse an old piece of content again and again. True repurposing requires that we alter it to make it fresh and appealing to a new audience.” ~Garrett Moon, CEO and Co-founder of CoSchedule
Repurposing content takes little effort, not zero effort.
What themes are still relevant? What topics are still popular?
On what subjects do you have more to say? Find content that fits in to those categories, and you’ve got yourself a winner.
Turn Old Blog Posts into Fresh and Complete Guides
This is perhaps the easiest repurposing you can do, but don’t let that fool you into thinking it’s not worthwhile.
The world moves pretty fast.
Some industries move even faster.
Posts you wrote last year – or even several months ago – can already be outdated.
Sometimes the just need a few tweaks.
At other times, they might need a partial or complete rewrite. Either way, you end up with something “new” to promote on your channels.
Even better, take several blog posts that share a broad subject and combine them into one complete guide.
A post about gaining Instagram followers, using that platform for business, how to write an Instagram bio, and best practices for increasing engagement can join together to create a powerful “Complete Guide to Instagram for Business”.
The “complete” or “ultimate” or “definitive” guide-type posts will always be popular. Harness that with minimal effort.
Create White Papers and Infographics
What type of content do you think drives lead generation? You might be surprised to learn its white papers.
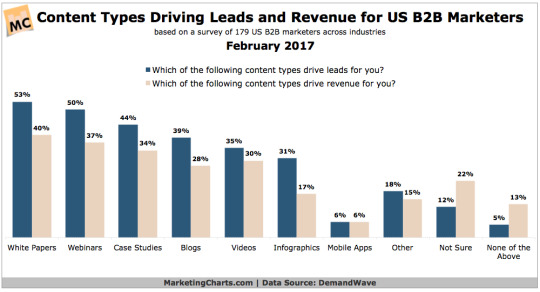
White papers are authoritative.
They cover a particular topic, presenting hard data and research to ultimately argue for a specific solution to a specific problem. They inform and persuade based on facts and evidence.
Done right, white papers build trust, increase your authority, and generate credibility for you and your brand.
They are research, data, chart, and graph heavy. Writing a white paper can be a time-consuming task.
But the don’t have to be. Your blog posts are full of data, graphics, and research already, right? Use that.
Combine several posts on the same basic subject, and you should have enough raw material to pull it together into a high quality white paper in half the time it would take to write one from scratch.
Use a template and save even more time. In the B2B sphere, they’re an absolute must.
And then we have infographics. Popular, powerful, and persuasive, a good infographic can disseminate information like few other types can. Consider:
We process visual data 60,000x faster than text.
It takes us just 13 milliseconds to process an image.
Infographics are 30x more likely to be read than a text post.
Infographics are liked and shared 3x more than any other content type.
74% of surveyed content marketers use them (tied for first), and 17% list them as the best performer in their marketing mix (second only to research/original data).
We are hardwired to understand and enjoy visuals, and infographics are very popular with both marketers and consumers alike.
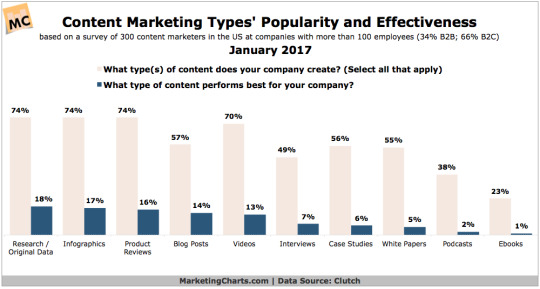
What’s more, creating infographics from existing content assets is quick and easy.
Services like Visually can do it for you, or tools like Infogram, Easelly, and Canva allow you to do it yourself.
The data collection and research is the “hard” part…and that’s already done and ready to use.
Turn Posts into a Webinar
Few content types are as engaging as a webinar or live stream.
They allow you to share your expertise, build credibility, and connect, communicate, and engage with your customers and leads in real-time.
The best webinars focus on one specific topic that you understand exceedingly well and can dig deep on. They have a spectacular slide deck that supports and complements the “script” you’ve written beforehand.
“There’s a lot of logistical things to think about, so even if you think you know what you want to say, you’ll be surprised at how quickly you forget once you get into presentation mode. Create a list of the questions as they come in so you can keep them organized. Lastly, relax! The attendees are there to listen and learn, not judge.” ~Chris McHale, Nurture Marketing Specialist at WordStream
Your most popular posts are prime candidates for the webinar treatment. Identify them, use them to create your slide deck and script, and promote your upcoming webinar everywhere you can.
Service providers like WebinarNinja and GoToWebcast can help with the logistics and host hundreds if not thousands of attendees.
And once your webinar is finished, don’t forget to upload your slide deck to SlideShare, and post the recorded video to your blog. That’s 3-for-1. That’s repurposing like a boss.
Create Videos
Think about how much video you consume on an average day.
A lot, right?
We love video. We seek it out. It rules the online roost:
55% of people watch video online every day.
More video content is uploaded online every month than television has created in the past 30 years.
Internet video will account for 80% of consumer internet traffic by 2019.
53% of consumers want to see more video content from marketers.
Video posts have 135% greater organic reach than photo posts on Facebook.
Brands that use video see 41% more traffic from search than brands that do not.
Repurpose your best content into a one-off or video series.
Record yourself and upload to YouTube or Skillshare.
If you’re camera shy, consider an animated video using Powtoon or GoAnimate.
A tool like VideoScribe automatically animates whatever you place on its canvas.
ScreenFlow lets you record your screen.
Whatever kind of video you want to make, a tool exists to help you get it done.
There are a lot of people who would rather watch than read, so give them what they want. Teach, inform, entertain, instruct, explain, and more.
Turn Posts into Ebooks
Taking several related posts and turning them into an ebook is a quick win.
You may need to fill it out a bit, write a few connecting paragraphs, and/or add a few more high quality visuals, but the bulk of the writing is ready to go.
Turning blog posts into ebooks is fast and easy for you, but they’re well regarded by people.
They carry more weight. They seem “better” than a blog post because they’re longer and more detailed.
They can be downloaded and carried with them wherever they go.
Darren Rowse of Problogger launched 31 Days to Build a Better Blog made up largely – though not exclusively – of repurposed blog material. The ebook remains one of his best sellers to this day.
You can share your ebook for free, use it as a lead magnet, sell it, or make it a reward in a contest or challenge. It’s entirely up to you.
An ebook gives an instant boost to your credibility and reputation.
Programs like Scrivener and Vellum allow you to save in a wide variety of formats, including Amazon Kindle, PDF, and iBooks. Maximum impact. Minimum effort.

Anyone can start a blog. But not everyone has their own series of ebooks. Stand out from the crowd.
Podcasts and Audio
Just as many people are visual learners and prefer videos and graphics, many people learn best by listening rather than reading.
Turning your best stuff into a podcast or audio file couldn’t be easier.
In fact, it may require little more than reading the post and injecting a bit of personality. That’s it.
Hate the sound of your voice? Hire someone else to do it for you. Believe it or not, Fiverr actually has a voiceover section. Who knows, you might just stumble upon the new voice of your brand.
Podcasts and audio files are fantastic because they not only reach a new audience, but much like an ebook, they carry an element of authority and sophistication.
Consumers can download them, and listen in their car, at home, on their commute, at rest, at work, or an the go.
That’s some serious reach. 44% of the American population has listened to a podcast, and 80% of them listen to all or most of it.
Services like Podomatic, PodBean, iTunes, and SoundCloud assist with everything from creation to editing, and hosting to promotion.
Increasingly popular, easily shared, and simple to do.
And Repurpose into the mix – it automatically converts your podcast to a video and shares to the most popular sites like YouTube and Facebook – and you have your bases covered.
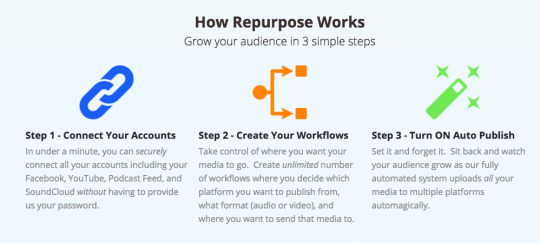
Medium is a Good Platform for SaaS Business
Republishing your 5-star content on Medium can give you a big traffic and exposure boost.
And you’re literally just republishing content without making any changes (unless you want to, of course).
And before you start to worry about the dreaded “duplicate content penalty” from Google, don’t. It’s a myth. It doesn’t exist.
Medium boasts 60 million monthly readers, 140,000 new stories each week, and dozens of topics and categories.
Sign up, get started, and get sharing.
Think of it as half social network and half writing platform. It’s the best of both worlds.
Benjamin Hardy went from zero to 50,000 subscribers using Medium in only 16 months. How’s that sound?
Don’t Forget to Republish Older Posts
Finally, you don’t want to neglect your older posts.
Just because they’ve fallen off the radar, doesn’t mean they’re worthless. High quality, evergreen content can be reposted to tremendous effect.
We’ve already mentioned the short life span on a typical social media post.
The harsh reality is that most people won’t see it the first time around.
Share it again though, and you’ve increased the eyes on it. Share a third time, and it’s still more.
Reposting your content on a regular schedule will capture a bigger audience for it, reach people in different time zones, and generally increase your traffic.
Some studies have shown it’s possible to get 75% of the engagement of the original post. What’s not to like?
So share it. Share it again later that day, the next day, next week, next month, and two months from now. Experiment with the best times to share on different platforms. Use a scheduler like Buffer or Hootsuite to do it all for you.
You’ve already put in the effort. Don’t let it go to waste.
Conclusion
Your content is the heart of your marketing. Make it work for you by using a consistent repurpose and reschedule plan.
“Create less, promote more.” ~Salma Jafri
Everything can be repurposed into something else.
Old is new again.
The less time you spend on creating and the more time you spend on promoting, the higher the return you’ll see on content marketing.
You don’t need to reinvent the wheel every time you need to move something from Point A to Point B.
You might need to change it up a bit – size of wheel, number of wheels, material of wheel – but it’s still fundamentally the same thing.
The same goes for your content.
Slide deck into video. Podcast into transcript. Blog series into webinar. Data into infographic. The possibilities are endless.
Have you tried repurposing your best content? What strategies and tools have you tried? Leave your comments below:
About the Author: Neil Patel is the cofounder of Neil Patel Digital.
from Search Results for “analytics” – The Kissmetrics Marketing Blog https://ift.tt/2w457sr
#Digital #Analytics #Website
0 notes
Text
Why SaaS Brand Advocacy Is More Important than Ever in 2018
Although it’s no secret that the realm of marketing is constantly evolving, it seems that the space is changing especially dramatically for SaaS companies nowadays.
And these changes are cause for concern for brands looking to flourish in 2018.
For starters, consider the overwhelming push toward personalization.
This signals the need for SaaS brands to segment their content assets and interfaces to hone in on messages that speak directly to specific customers.
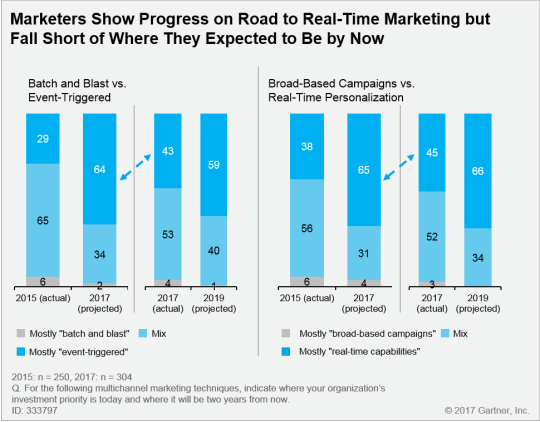
Gartner predicts that by 2020, 90% of all brands will practice at least some form of real-time personalization. Currently, nearly half of the businesses polled use real-time personalization to inform the majority of their messaging. In the SaaS industry, where every interaction is ideally tracked, the opportunities are enormous.
Then, there are the recently announced changes to Facebook’s algorithm that basically mean that organic reach for pages is finally altogether dead.
Afraid of being frozen out of users’ feeds, SaaS marketers are trying not to panic in the face of what could potentially put their existing marketing funnels in jeopardy.
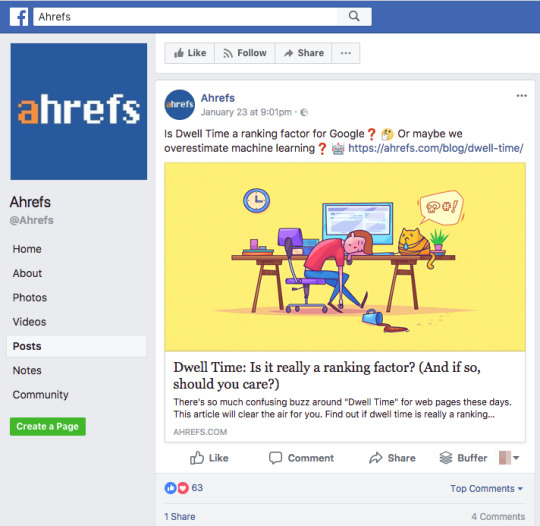
There’s also the rise of automation to think about.
SaaS companies are investing heavily in AI and machine learning to reduce churn and win more new customers simultaneously. From services that provide A/B testing to conversational bots that capture leads on-site, brands are rapidly experimenting with new ways to optimize their content.
Why Brand Advocacy Is Such a Big Deal for SaaS
Simply put, your content marketing strategy is at the core of your capacity to adapt as a SaaS brand. Beyond the basic benefits of driving traffic and raising brand awareness, an effective content strategy is essential to consistently nurture and onboard leads.
Conventional wisdom says that we should shell out piles of money for paid media or sponsoring influencer posts to grab people’s attention. However, is this sort of “pay-to-play” strategy really the best way to go?
In an era where social proof is such a powerful currency for marketers, it’s more important than ever for SaaS marketers to seek out brand advocates wherever we possibly can.
And who could possibly be better brand advocates than your own customers and employees? These people are already emotionally invested in your product’s success, and they know your brand better than anyone else.
Encouraging your own network to promote your content and product from their personal social accounts is a potential game-changer for SaaS brands. Rather than spend the resources to chase paid outlets and influencers, brands should focus on advocacy, which can produce better results in a shorter amount of time.
“By creating a product that solved a problem that a lot of people faced, it meant there were already millions of people looking for us when we launched,” Canva CEO Melanie Perkins recently told Forbes, “so when they found us, they told their colleagues, friends and families.”
Here are some of the biggest benefits associated with brand advocacy, along with some ways that SaaS marketers can get started with realizing them.
1. Overcome Content Overload and Mistrust
In an era where people are consuming a staggering 12 hours or more of content per day, your customers obviously have a lot to sift through. And trust in the media – which includes “platforms” like social apps, by the way – continues to sit on shaky ground.
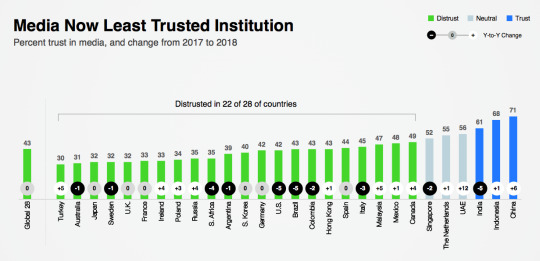
While the concept of “quality content” might be cliché at this point, consider how a higher volume of shares highlights a piece of content as buzzworthy. This is social proof at its best.
Content shares and product recommendations work because people trust peers and thought leaders more than they trust brands and institutions.
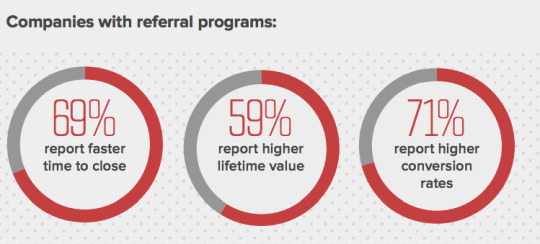
Bear in mind that employees who serve as active advocates on social media can quickly emerge as influencers on your behalf. Indeed, transforming your own employees into thought leaders is a desirable byproduct of brand advocacy.
2. Expand Your Reach Organically
No matter how you slice it, competition in the SaaS space is fierce.
Considering that there are approximately 5,000 brands in the martech space alone, SaaS companies must fight tooth and nail for the attention of potential customers.
Think of advocacy as a sort of numbers game. The more people promoting your content, paid or otherwise, the more likely you are to break through the noise and reach the people who need your product most.
When you encourage employees to regularly promote your content with their own social media audiences, you essentially amass a small army of promoters you can call on time and time again. This year’s State of Employee Advocacy study from JEM Consulting found that over 75% of respondents see their advocacy program as yielding satisfactory or better results.
Whether you’re dealing with a few dozen or a few hundred employees, those numbers are nothing to scoff at. Through social brand advocacy, you exponentially increase your social reach and potential to be seen by leads.
And keep in mind – in many cases, all it takes is for the right person to see a link and opt in for a free trial to pave the way to the sale. TOPO CEO Scott Albro notes that the smaller the company your prospect works for, the more likely he or she will be to stick with your product once the trial period expires:
“SaaS buyers won’t engage in more than one trial. Our data shows that this is particularly true in the small and medium size business market where buyers tend to comparison-shop less. You need to make sure that buyers find your trial first. You also need to make sure that you don’t squander that opportunity when you get it.”
3. Engage Your Employees
Perhaps one of the most overlooked aspects of encouraging brand advocates among employees is the actually task of asking them to do so.
While most workers would be glad to promote your content, keep in mind that brands should treat advocacy like any other sort of campaign. That means having a defined strategy and measuring performance.
But SaaS teams often have highly specialized skill sets. You can’t expect everyone to be a seasoned content marketer and social seller, too. Instead of having employees post content haphazardly, consider some of the tools out there that help streamline the process of internal brand advocacy.
One such tool is Smarp, which aggregates company news and industry-relevant content to categorized feeds. Team members can pick up the content that speaks to them most and schedule posts for their own profiles with just a few clicks.
This cuts down on potential wastes of time on social media and streamlines the process of sharing new content amongst your workers.
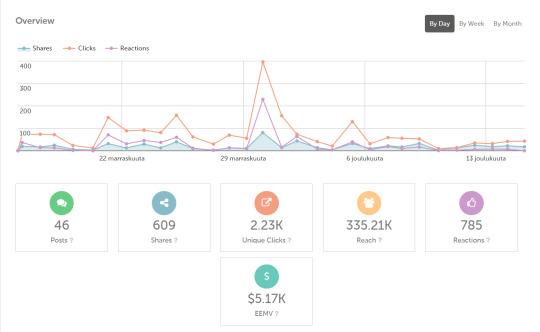
Features such as gamification signal the most active advocates within any given company, providing additional incentives for employees to become eager advocates. In addition to content aggregation, Smarp provides analytics on both a company-wide and personal level to identify top advocates.
This type of system works because it makes employees from all departments into partners in your SaaS product’s exponential sales growth success, a process which Roketto Co-founder Ulf Lonegren compares to the growth of a tree that spawns more trees:
“Make your employees proud of the work they do, make them feel like an important part of the process by reminding them how the software provides value and informing them of the successes, listen to their ideas, and provide a sales chart in the engine room that tracks the progress. Set sales goals and provide rewards for reaching those goals. Provide incentives for team members to make sales. In this world of mass marketing, word of mouth often provides the authenticity that buyers want when seeking a product, so remember that every member of your team could be that one oak tree, and from one tree many nuts can fall.”
4. Supercharge Your Social Selling
SaaS customers are heavily influenced by what they see on social media when it comes time to make purchases.
This rings true in terms of how often they see content and the sharers of that content. If social posts from sales pros, marketers and brands themselves are deemed less worthy of people’s attention than social posts from peers and laymen, then it follows logically that your prospects are more likely to respond favorably to content shared by a high volume of people.
Research from Sana indicates that social media is the number two driver of digital sales in the B2B sector, ranking just behind onsite buying.

Again, the numbers game of brand advocacy comes to light based on what your customers see on social media.
According to LinkedIn, 87% of social customers have a favorable view of products that were introduced them through their own network. By promoting products via employees, you have access to personal networks that you might not otherwise reach exclusively through a brand channel.
Keep in mind that the average buyer consumes over 11 pieces of content before they’re ready to respond favorably to a sales pitch. Similarly, 61% of customers have made a purchase based on a recommendation from a blog. A greater number of brand advocates translates into more brand equity in the minds of potential customers, which makes it easier for sales reps to build relationships on social channels and to close more deals in shorter sales cycles.
And those sales cycles need as much shortening as they can get, in order to remain scalable. The Bridge Group’s Matt Bertuzzi notes that total contract value for a SaaS conversion correlates with the number of days it takes sales reps to seal the deal. According to his firm’s data, B2B SaaS sales cycles can last anywhere from five weeks to five months.
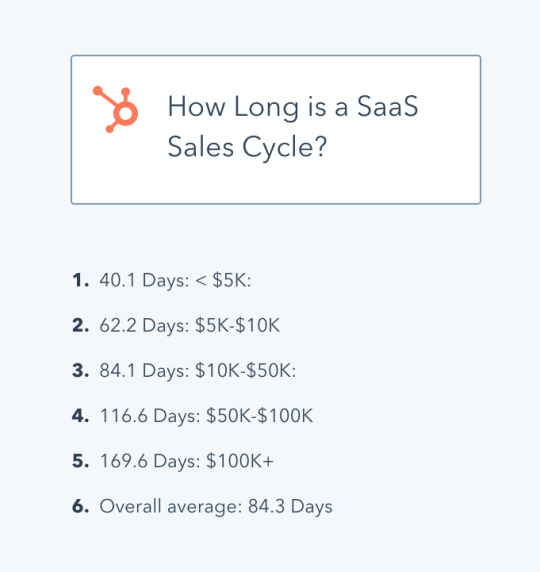
Dennis Koutoudis from LinkedIn SuperPowers told SalesHacker that he sees prospecting on social media, especially on LinkedIn, as one of the key SaaS sales opportunities of 2018:
“I predict that the usage of LinkedIn Sales Navigator by Sales Teams will increase considerably, enabling them both to zero in on their target prospects with extreme precision and also to delve deeper into Social Selling. The key here is to focus on providing value, build trust and develop solid professional relationships with target prospects that will ultimately improve sales figures. Great emphasis will also be placed on the way we present ourselves as Sales Professionals on the LinkedIn platform since with such fierce competition, now more than ever, we need to not only stand out in our professional field but also to engage in actions that will significantly increase our visibility on the LinkedIn platform.”
Prospecting platforms like 2Factr’s SocialPort are major game-changers in this regard. Social selling teams can use this tool to scale operations, thanks to smart libraries of content assets that reps can append to posts on the fly, as well as sophisticated contact intelligence data that can be used for qualifying leads mid-discussion and enriching CRM entries.
5. Keep Your Content Budget Under Control
According to Content Marketing Institute, 38% of brands are looking to up their content marketing budgets in 2018. Even so, that’s no excuse for brands to spend recklessly.
And given the emphasis on automation and other tools that could potentially cut into any given SaaS company’s budget, a leaner content marketing strategy just plain makes sense.
When your employees and customers are doing the legwork of promoting your brand, you cut out any sort of middleman when it comes to promotion. While there might be a time and place for paid media or influencers, SaaS brands should focus on an organic promotion strategy that keeps costs down.
Encouraging brand advocacy costs next to nothing compared to paid media. Additionally, popping up more and more via social media could actually score you earned media mentions as an added bonus.
Based on the previously noted CMI study, 50% of marketers believe that their ROI is closely linked to the way they go about distributing content. Rather than paying for promotion and distribution, creating your own advocates represents a more financially sensible strategy.
Conclusion
As competition continues to emerge in the SaaS space, having voices on deck to promote your content becomes a critical piece of standing out from the crowd.
Not only does advocacy keep content marketing costs down, but allows SaaS brands to seamlessly signal their authority. Rather than pay for that same credibility, why not generate it yourself?
And while marketing strategies at large never stay the same for long, brand advocacy is here to stay.
About the Author: Nadav is a veteran online marketer and the Founder & CEO of InboundJunction, an Israel-based content marketing company. Nadav helps well-known brands in boosting their online visibility through PR, SEO and Social Media.
from Search Results for “analytics” – The Kissmetrics Marketing Blog https://ift.tt/2FwUH3Z
#Digital #Analytics #Website
0 notes
Text
Breaking Silos: Passive Consumption + Active Engagement FTW!
Today something complex, advanced, that is most applicable to those who are at the edges of spending money, and thus have an intricate web of internal and external teams to deliver customer engagement and business success.
The Marketing Industrial Empire is made up of number of components.
If you consider the largest pieces, there is the internal (you, the company) and the external (agencies, consultants).
If you consider entities, you’ve got your media agency, your creative agency, your various advertising agencies, your website and retail store teams, your analysts, marketers, advertising experts, the UX teams, campaign analysts, fulfillment folks, the data analysts who are scattered throughout the aforementioned entities, the CMO, CFO, and hopefully your CEO. And I'm only talking about the small portion of your existence that is your marketing and analytics.
Whether you consider the large, simplistic perspective (internal – external) or the more complex entity view, it’s really easy to see how things can become siloed very quickly.
It’s so easy for each little piece (you!) to solve for your little piece and optimize for a local maxima. You win (bonus/promotion/award). It is rare that your company wins in these siloed existence.
That’s simply because silos don’t promote consideration of all the variables at play for the business. They don’t result in taking the entire business strategy or the complete customer journey. Mining a cubic zirconia is celebrated as if it is a diamond.
Heartbreakingly, this is very common at large and extra-large sized companies. (This happens a lot less at small companies because of how easily death comes with a local maxima focus.)
So how can you avoid this? How do you encourage broader, more out-of-the-box thinking?
This might seem simplistic, but sometimes it helps to give things names. Naming things clarifies, frames, and when done well it exposes the gaps in our thinking.
Today, I want to name two of the most common silos in large and extra-large companies, in the hope that it’ll force you to see them and subsequently abandon siloed thinking and solve for a global maxima.
1. The Advertising Ecosystem: Passive Consumption.
2. The Business Ecosystem: Active Engagement.
3. Accelerating Success: Five Quick Changes.
4. Closing Thoughts.
Name abstract ideas, draw pictures, deepen appreciation, take action.
Could not be simpler, right? :)
Let’s go!
The Advertising Ecosystem: Passive Consumption.
I'm randomly going to use Geico as an illustrative example because the frequency at which they are buying ads means that every human, animal, and potted plant in the United States has seen a Geico commercial at least once in the last 6 hours (contributing to Geico’s business success).
Typically the ads we see are the result of the external creative and media agencies, and their partners in the internal company team/s.
Geico purchases every kind of ad: TV spots, radio ads, billboards (OOH), digital displays (video, online,– social media), print (magazines, newspaper, your cousin's Christmas letter), and so much more.
The teams naturally gravitate towards optimization and measurement that spans their individual mini-universes.
Was that a great ad? Can we test different spending levels in that market? What is the best way to get people to remember the delightful gecko? Can we automate the placement of display ads based on desired psychographics?
Did we get the TRPs that we were shooting for? What was the change in awareness and consideration? What was the reach/frequency for the Washington Post? How many impressions did our Twitter ads get, and how many people were exposed to our billboards?
These are important questions facets of, and delivery optimization of, the advertising. Questions like these, and adjacent others, tend to drive the entire lives of creative and media agencies/teams. For entirely understandable reasons. Siloed incentives delivering siloed local maxima results.
I cannot stress enough that these results can be positive (for the ad business and, in this case, the sales of insurance products). And yet, as a global maxima person it does not take a whole lot of effort to see a whole lot of opportunity if both the siloed incentives can siloed execution implied by the above questions can be changed.
Here’s an incredible simple way that every human seeking global maxima can look beyond the silo: “So, what happens after?”
As in, what happens after the finite confines that are the scope of my responsibility/view?
To see that, the first step is to paint a picture that illustrates the current purpose (your silo), and then give it a name.
Here’s that picture for the example we are using, and the name I gave it is “passive consumption.”
Over 90% of advertising is passive consumption. This means that the ad is in front of the human and they may see it or not see it.
Even on the platforms where interactivity is at its very core (Instagram, Facebook, YouTube, etc.), almost all of the advertising does not elicit any sort of interactivity. If you look at the percentages, almost no one clicks on banner ads, a small percentage on search ads, and you need only speak with a few people around you to see how many people actively engage with TV ads vs. run to the bathroom or pull out their mobile phone the moment forced-watch TV ads come on.
Keep in mind, this is not a ding against passive consumption or the hard work done by Geico's agency and internal teams. Blasting ads on TV does cause a teeny tiny micro percentage to buy insurance – a fact provable via Matched Market Tests, Media Mix Models. The teeny tiny micro infinitesimally small number of views of brand display ads will cause outcomes. (Hold this thought, we’ll come back to that in a moment.)
So, what is the passive consumption challenge?
First, how far the vision of the creative and media agencies/teams will see (thus limiting success – global maxima). Second, trapped in the silo the vision for what will be measured and deemed as success.
The first is heartbreaking. The second ensures the death of any long-term impact.
Let me explain.
With over 90% passive consumption…. Well, passive… Smart media and advertising agencies/teams will primarily use post-exposure surveys to measure awareness (what companies provide car insurance) and consideration (which brands you would consider).
The brilliant agencies will also measure elements such as purchase intent (how likely it is that you'll consider Geico as your next car insurance provider) and likelihood to recommend (how likely is it that you'll recommend Geico to your family and friends).
All of these metrics will cause surveys to be sent via various mediums to people who've seen the TV ads, the banners on Facebook, and the video ads on YouTube. And a subset of users who were not exposed to the ads. Usually, there is anywhere between a few hundred to a thousand survey responses that will end up providing a statistically significant sample.
The scores from these responses are presented in weekly, monthly, or quarterly meetings. Segmented by marketing activity, they are the end-all be-all justification for media spending. Snapchat increased aided awareness by +23%, let us spend more there. Or, billboards in Georgetown and Austin shifted purchase intent by +2%, we should triple our spend in Chicago.
Every measurement and optimization initiative is based on this cocktail of metrics. Thus delivering a positive, but local, maxima.
Even the next best innovation in media will be based on results from the same metrics cocktail. Thus delivering a little more positive, but still local, maxima.
Why not global maxima?
Because success is determined by, innovation is driven by, measurement that is self-reported feelings.
That name captures the actual thing that is being measured (feelings) by the metrics above, and where the data comes from (self-reported) after being exposed to our advertising.
This will help your company, your agencies, understand limits. Limits in terms of what’s happening (mostly, passive consumption) and what data we are looking at (all post-exposure and self-reported).
Limits in measurement that incentivize solving for a local maxima.
Let me repeat one more time. Passive consumption measured by self-reported feelings does drive some success – else Geico would not be the financial success it is. In the short-term some campaigns are trying to drive long-term brand influence or causing a shift in public opinion or simply to remind people your brand still exists as a choice. All good. Self-reported feelings are wonderful. Appreciate that even in those cases where you are not trying to drive short-term sales, if all you have are feelings converted into metrics… You are limiting imagination.
An obsession with just passive consumption by your agencies and internal teams delivers 18 points of success. I’m saying if you think global maxima, remove limits, you can do 88 points!
The Business Ecosystem: Active Engagement.
Getting those additional 70 points success requires breaking the self-imposed creative/media/advertising silo and caring about the human behavior if people lean-in instead of passive consumption – when they take an action (a click, a phone call, a store visit).
Time to draw another picture, and give this behavior a name.
I call it… drum roll please… Active Engagement!
Some people, between 0.01% to 10% (so rare!), who see Geico’s online ads will visit a Geico retail store or Geico's website.
People are actually doing something. They are walking into your store, talking to an agent, picking up the literature, calling you on the phone, clicking on to your site, watching videos, comparison shopping, and more. This is all human behavior that your tools can report for you.
A small percentage will end up buying insurance – mazel tov! –, providing perhaps the most valuable data.
The lucky thing about active engagement is that, in addition to self-reported feelings, you also get tons of highly-useful quantitative data representing human behavior.
I call this type of data: Observed Human Behavior.
If you are a part of an creative, media, or an internal company team, you have two powerful issues you can solve for: passive consumption (happens most of the time) AND active engagement (happens some of the time).
Likewise, you can seek to understand performance using self-reported data where the people reflect on how they feel, along with behavior data that represents what they actually do.
The combination of these two factors deliver the much needed Global Maxima perspective.
That is how you shatter silos. The creative agency has to care about how ads perform in their labs, in the real world, and what kind of online and offline behavior the creative is driving (end-to-end baby!). The media agency has to care about the creative and where it needs to get delivered (recency, frequency FTW!), and the bounce rate (70% ouch, 30% hurray!) and profit from each campaign. The retail experience team, the call center delight team, and the site experience team will break their silo and reach back into understanding the self-reported feelings data from the media agencies and the ideas that lead to the creative that delivered a human to them.
Everyone cares about the before and after, solving for the overall business rather than their little silo. Passive consumption plus active engagement equals global maxima. Or, self-reported feelings plus observed human behavior equals global maxima.
: )
Here’s a massively underappreciated benefit: It also encourages every employee – internal and external – to take full credit for their impact on the short and long-term effects of their effort.
It is rare to see this happen in real life, even at top American and European companies.
What’s usual is to see the three silos between creative agencies, media agencies, and company internal team. There is usually further sub-segmentation into passive consumption teams (also lovingly referred as brand agencies/advertisers) and active engagement teams (performance agencies/advertisers). The further sub-sub-segmentation into products and services (depending on the company).
They then quickly fall into their respective measurement silos, solving for the local maxima.
Change starts with naming things and drawing pictures. Gather the key leaders at your company and agency partners. Show them passive consumption and self-reported feelings along with active engagement and observed human behavior. Talk through the implications of each picture. Ask this influential audience: What can you contribute to when it comes to breaking silos?
I have yet to meet a single company where simply drawing the picture did not result in a dramatic rethinking of focus areas, responsibilities, and ultimately priorities.
Accelerating Success: Five Quick Changes.
Once you have that discussion, what should you do to truly cause a significant change in behavior?
Five Es form the core of the strategies that I end up using (please share your's via comments below). They are:
1. Expand the scope of data your employees use.
For the people who buy your television ads, include both store and website traffic data. Break the shackles of GRPs and Frequency.
For people buying your display ads on Facebook, include page depth, bounce rate, as well as micro-conversion rates for those campaigns. Break the shackles Awareness and Views.
For people buying your videos ads on Hulu, complement Hulu's self-reported feelings metrics with user behavior and conversion rates.
And continue going in this fashion.
2. Expand the incentives structures for your employees.
Most marketing employees, both internal and external, undertaking passive consumption initiatives are rewarded for cost per TRP, effective reach, awareness and consideration increases, etc. Whatever this bucket as an employee incentive, it can stay.
Consider adding one or two KPIs from active engagement. For example: Store visits, phone calls (as a result of that increase in consideration). Website visits, loyalty, micro-outcomes, and 25 other easily-available observed human behavior metrics are available to you pretty much in real-time.
For people who own responsibility for your stores, call center and website, take a metric or two from passive consumption and make it a small part of their incentive structure.
People respond to what they are compensated with, or promoted for. Use it to solve for a global maxima in the company and its customers.
3. Expand the time horizon for success.
This is really hard.
You buy 100 TRPs, it’s expensive, and the executives tend to start badgering you for immediate results.
The problem is that self-reported feelings data takes time, and since at least 90% of passive consumption leads to no immediate active engagement, all this does is incentivize bad behavior by your agencies and employees. Long-term objectives are thrown onto the chopping block and long-term strategies are judged on short-term success – which immediately ruins the campaign’s measurement. Oh and the audience being bombarded by your ads that are trying to deliver short-term outcomes from long-term creative and campaigns… They despise you because you are sucking, they can see that, and they instantly realize your are wasting their time.
No matter how much your wish, a Chicken won’t birth a Lion’s cub.
If you want short-term success, define the clearly as a goal, pick the right short-term self-reported feelings metric and observed behavior metric, now unleash your creative agency and their ideas (on that short-term horizon), then plead with your media agency to buy optimal placements, and ensure the retail/phone/web experience is not some soft and fuzzy experience, rather it is tied to that clear goal and success metrics. Sit back. Win.
If you want long-term success… Same as above, replace short with long. How amazing is that?
4. Expand the datasets that teach your smart algorithms.
If you’ve only visited this blog once in the last 12 months, or read just one edition of my truly amazing newsletter :), Marketing <> Analytics Intersect, it is quite likely I have infected you with the passion to start investing in machine learning in order to bring smart automation to your marketing and user-experience initiatives.
If you are following my advice, make absolutely sure that you are not training your algorithms based solely on passive consumption, self-reported feelings data. It is necessary, but not sufficient.
Rich observed behavior data will provide your algorithm the same broad view of success as we are trying to provide the humans in #2 above. In fact, the algorithms can ingest way more data and complexity. Thus allowing them to solve for a super-global maxima compared to our humble abilities.
Every algorithm is only as smart as the data you use to educate it. Don't short-change the algorithm.
5. Expand leadership comfort level with ambiguity.
For your TV efforts, there are limits to what you can measure. You have self-reported feelings data, and usually that’s about it. If you have a sophisticated world-class measurement team, you may be running some controlled experiments to measure one or two elements of active engagement observed human behavior data.
For YouTube or Hulu on the other hand, you’ll have additional self-reported feelings data, and if you follow my advice today, plenty of directly-causal observed human behavior data at your disposal.
Get very comfortable with this reality, and execute accordingly.
When some executives are not comfortable with this reality, they typically end up gravitating towards the lowest common denominator. Even in regards to strategies where more is possible (digital), they just end up using self-reported feelings data for everything.
I do understand why this is; executives are pressed for time, so the executive dashboard needs only one metric they can compare across initiatives. This instantly dumbs-down the intelligence that could help contribute to smarter decisions.
Kindly explain this to your executives, share with them the value of being comfortable with a little ambiguity that comes from using the best metric for each initiative type.
We can achieve smarter global maxima decisions if we just use different metrics in some instances.
Closing Thoughts.
The larger the company, the harder it is to solve for a global maxima. Companies need command and control. Companies worry that people are going to run wild in 15 different directions. Companies need to reward an individual, that means creating a finite role that can be defined and measured at a small level. Companies add layers upon layers to manage. Companies create org clusters (divisions). And, more.
Every one of these actions forces a local maxima. Every human can see their few pixels and have no idea what the image looks like.
Even if then the company progresses little by little, they’ll run out of luck one day. Worse some nimble small company – that does not yet have to worry about all of the above – will come eat your breakfast first, then dinner and then lunch.
The lesson in this post applies across the entire business, even if in this instance it is applied to marketing and advertising.
Paint a picture of what the local maxima execution looks like in your division – or better still company. Give these pieces a name. Then, figure out, like I’ve done above, what the connective tissue is that’ll incentivize global maxima thinking and execution.
Carpe diem!
As always, it is your turn now.
In your specific role, are you solving for the global maxima or a local maxima? How about your creative and media agencies? Your internal marketing or product teams? Has your company done something special to ensure that teams are considering both self-reported feelings and observed human behavior? Is there a magic metric you feel that’ll encourage each piece of the business success puzzle to solve for a global maxima?
Please share your wisdom, tips and secrets to success via comments below.
Thank you.
The post Breaking Silos: Passive Consumption + Active Engagement FTW! appeared first on Occam's Razor by Avinash Kaushik.
from Occam's Razor by Avinash Kaushik https://ift.tt/2FqGl4V
#Digital #Analytics #Website
0 notes
Text
6 Instagram Marketing Trends To Be Aware Of In 2018
Last year, my friend checked her Instagram engagement numbers and noticed something unusual.
They tanked.
“I used to get lots of likes and comments, but now it has totally dropped off,” she told me.
I asked her what she was doing differently.
Her answer?
“Nothing.”
And that was the issue.
Instagram has changed a lot since it first launched in 2010.
They now have 800,000,000 monthly active users.
And while that number is incredible, what is more striking is the rate at which the platform is growing.
In 2013, it had 100,000,000 users.
In 2016, it had 500,000,000 users.
By April 2017, it had 700,000,000 users.
By September 2017, it had 800,000,000 users.
This means its user base rocketed by 100,000,000 users in five months.
This graph maps out Instagram’s impressive growth numbers over the years.
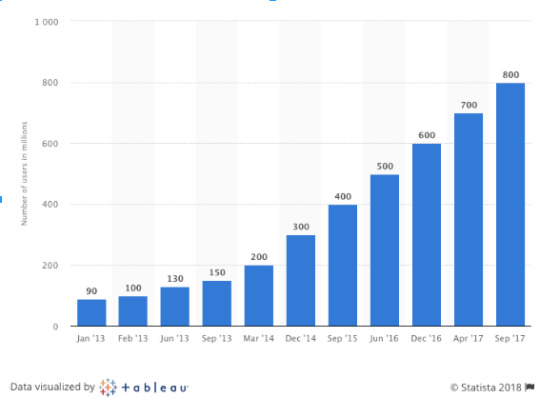
Since Instagram is purely visual, it’s an incredibly captivating way to make a connection with your customers.
But only if you know how to use it in 2018.
Let’s take a look at the top Instagram trends all marketers need to know about in 2018.
1. Instagram is becoming ‘pay to play’
At first, access to 800 million users might sound like a marketer’s dream.
But the more you think about that number, 800 million users means more competition.
And more clutter.
To make matters worse, Instagram continues to make changes to their algorithm, negatively affecting brands’ organic reach.
In March 2018, Instagram announced that “introducing [algorithm] changes to give you more control over your feed and ensure the posts you see are timely.”
These changes include:
Testing a “new posts” button to help users control when their page refreshes to see new posts in their timeline
An update “to ensure that newer posts are more likely to appear first in your feed.”
What does this mean? Instagram is still toying with their algorithm.
Good for users. Bad for brands.
That said, it isn’t all doom and gloom for businesses.
For one thing, 8 out of 10 users follow at least one business.
Increased competition means more saturation. That fact, combined with decreasing organic reach, means you’re going to have to pay to play in 2018.
Promoting your basic Instagram posts isn’t the same as running an Instagram ad campaign. But it is your best shot at getting content to stick out from the crowd.
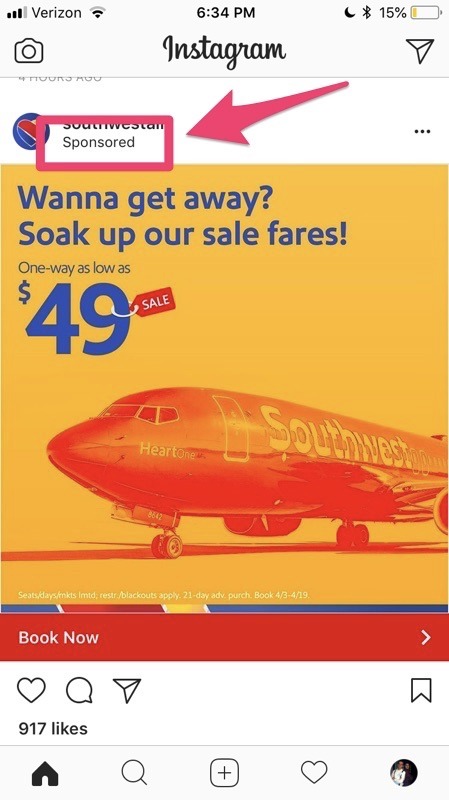
Only Instagram Business Accounts have access to promoting posts.
To get started, make sure your profile is set to public. You can do this by heading over to your profile.
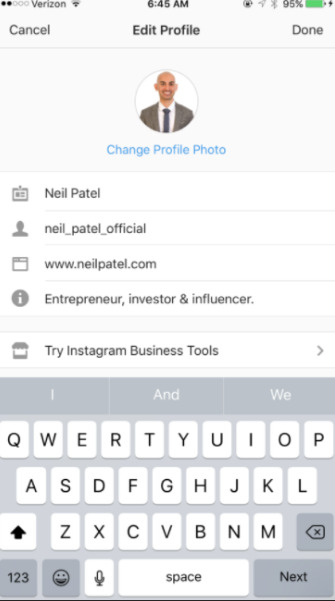
Then click the gear shift wheel icon and switch to a Business Profile.
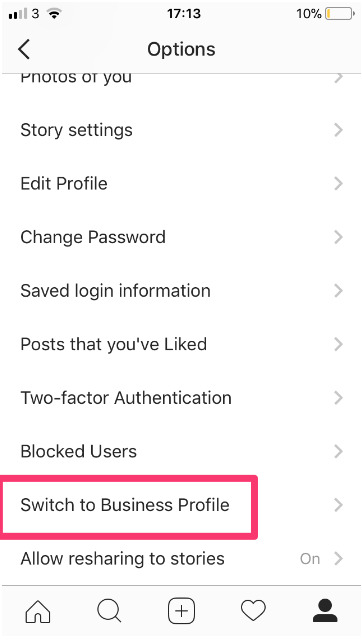
Tap on the post you want to promote, select “Promote” and then tap to fill in the required details. Here is an example:
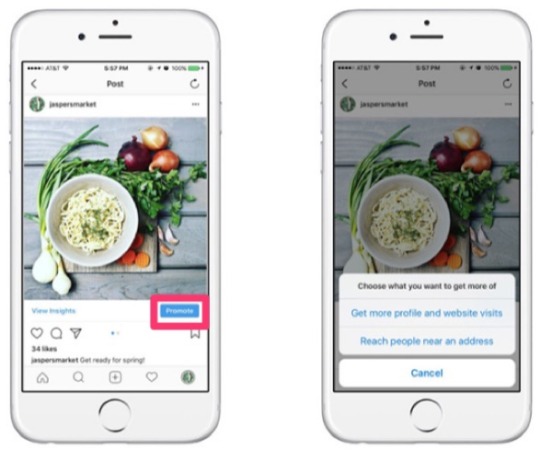
Setting up a boosted ad is one thing, but knowing which posts to boost is another.
Naturally, you’ll only want to boost posts that people are engaging with.
Your Insights will quickly aggregate all of this basic reach data.
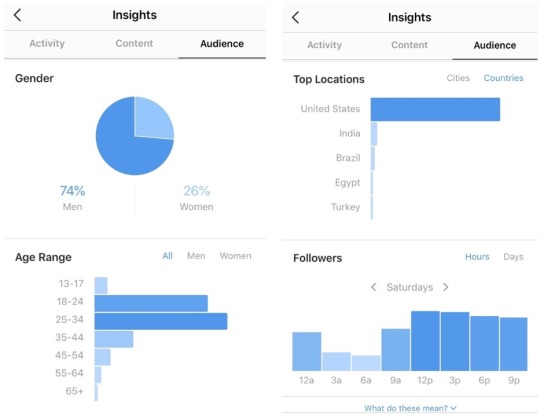
But there also third-party tools you can use including Socialbakers, Simply Measured, and Union Metrics.
To get even more engagement for your posts, you need to pick the right hashtags.
How to pick your hashtags
If you use trending hashtags that are relevant to your audience, your posts’ discoverability will increase.
But how do you make sure you pick the right ones?
Well, there are a variety of tools that can help you decide which hashtags are the right ones for you:
Command – This tool will show you how your hashtags are performing. However, it is only available in the App Store for iOS users for $1.99 – $9.99.
Hashtagify – This is a free service that will allow you to search any hashtag. It will provide you with the hashtag’s popularity, current trend, and other related hashtags to consider.
KeyHole – This tool is interesting because it allows you to track a hashtag in real-time, provided up-to-date data on the hashtag over a set period of time.
SeekMetrics – SeekMetrics’ Hashtag Generator will source popular hashtags based on the keywords you input.
But how many should you add to a single post?
TrackMaven took a look at hashtags on Instagram and found that 9 is the optimum amount for engagement. The report also found that longer hashtags (we’re talking around 24 characters) outperform shorter ones.
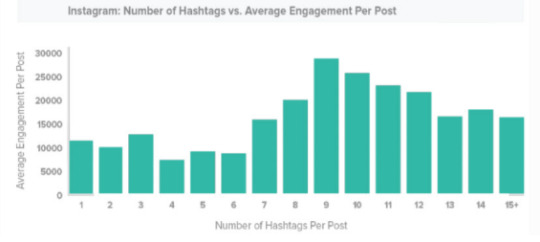
But you can always check to see what hashtags your competitors and your customers are using.
To do this, type into Instagram’s search bar. The app will display the most closely related hashtags.

It will even tell you how many times that hashtag has been used in total by Instagram’s users.
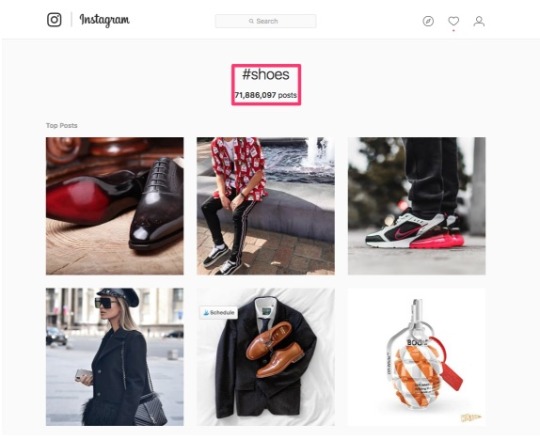
Once you have a decent collection of hashtags together that are aligned well with your target audience, you can then start posting with them.
But don’t just post and forget about them. Follow them. At the end of 2017, Instagram released a new update allowing users to follow hashtags.
Simple, but effective.
2. Customers can buy direct with Instagram shopping features
Got an e-commerce store?
If so, you need to be using Instagram’s Shopping feature.
Like, right now.
It improves product discovery on the app by condensing and making information available in one place.
Shoppable posts can be identified on account profiles by a white shopping bag icon at the top right-hand corner of posts.

Users can see these posts natively in their feed while scrolling. Each post that uses this feature will show a white shopping bag icon or a “Tap to View Products” pop-up.
Instead of having to click on links to get access to product pricing and descriptions, this key info will be available on a brand’s Instagram post.
Shoppers can do their browsing without leaving the app.

For businesses, the advantages are obvious; it’s simply an easier way than ever for customers to push your products.
The stats don’t lie either. According to Instagram, 75% of users who see a business post take action.
The clothing company, Lulus, tested this feature with great success. They found “nearly 33% of people who tap to learn more about a product visit our site through ‘Shop Now’.”

This tells you one key thing: consumers love to connect with brands on Instagram.
So how to get started? Well, Instagram is busy rolling out the feature, but you still need to be approved to use it.
Once you are approved, simply upload a post to Instagram like you usually would. Then, tag the product using the “tag products” feature.
It’s just like tagging a person.
Then, simply share your post to your page, and you’re done.
How to increase the reach of your shopping posts
To take things one step further, there are numerous integrations and tools to increase conversions depending on what platform you are using. Some of my favorites are:
Snappt – You can use this tool to embed your shoppable Instagram feed on your website. It makes a nice gallery that will be linked to your feed and dashboard.
Salesforce Marketing Cloud – This tool helps you manage campaigns that will help drive engagement and optimize your shoppable Instagram posts.
Integrations with BigCommerce and Shopify – This makes it easier than ever for small businesses using these platforms to integrate the shopping feature.
3. Reach more followers organically with live streaming
Gulp. Going live fills many of us with dread.
But let’s face it. Instagram Live is a fantastic way to connect with your audience, answer questions on the fly and solve any issues they might have.
Daunting? Sure. But it’s so easy to go live.
Start by tapping the camera icon on your screen (top left).
This will open the camera.
Tap “Live” followed by “Start Live Video.”

Provided your notifications are turned on, your followers will be notified that you’ve gone live.
But what should you do? Here are some live content types:
How-To Demonstration
Behind the Scenes
Event Updates/Streaming
Exclusive Content
Contests
Product Demonstrations
Cross partnerships
Exclusive Content
For example, Dunkin Donuts mastered Instagram Live by providing a behind-the-scenes look at some of their sweet creations inside their test kitchen on Valentine’s Day.

Beyond Yoga used Instagram Live to showcase how their clothing items fared after performing various yoga poses.

Want even more engagement? Use Instagram Live with friends.
Instagram Live with friends means you’re live on camera with a guest. This can be a great way to involve another brand or partner in the mix.
Jared Leto and Gucci teamed up for an Instagram Live with friends broadcast.
This provided a chance for Gucci’s Instagram audience to be exposed to Jared Leto’s brand and vice versa.

Want more added exposure? The more popular your broadcast is, the more of a chance it has of appearing in the Explore tab.

Awesome, right? There’s also such a thing as Top Live Instagram Stories. The more viewers and guests you’ve got, the higher you will rank.
It’s easy enough to use too, but there’s a big thing you need to bear in mind: comment moderation.
Comment moderation should be turned on if you’ve got a “clean” brand with an audience that wouldn’t want to be subjected to bad words in the comments.
To moderate comments, go to your Settings, head on down to “Comments” and pick the comment moderation options that you’d prefer.
Another thing you need to do is promote your Live broadcast in advance.
Use Instagram Insights to discover a good time to go live (this will be a time when your engagement is usually at its peak).
But that’s not all. Instagram recently made it available for you to save your live streams to your camera roll.
Now, you have great content to repurpose for other social media channels as well.
4. Target micro influencers to promote you
In his book #AskGaryVee, Gary Vaynerchuk says that anyone who has a following on Instagram is an influencer.
Gary knows what he is talking about, with having over 3 million followers.

You might be thinking, “3 million followers?! My brand doesn’t come close to that.”
Don’t panic.
You don’t necessarily need thousands of followers to make an impact. Studies show engagement peaks at just 1,000 followers.
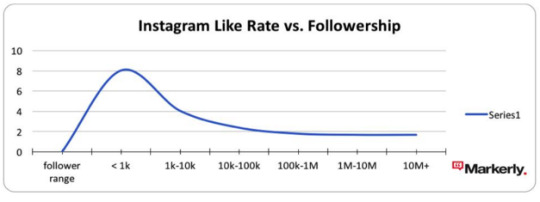
This is why micro influencers are great.
Those with mid-range followings (1000 – 10,000+) can have strong engagement numbers and be incredibly impactful for your brand.
Launching a micro influencer campaign doesn’t have to be costly either. In fact, working with influencers on Instagram can often give you a better ROI.
Influencer Marketing Days performed a test to compare the value between micro and mega influencers. Their results were interesting, although not surprising.
Mega influencers had high engagement numbers, but low sales. Micro influencers resulted in high sales, but low engagement numbers.
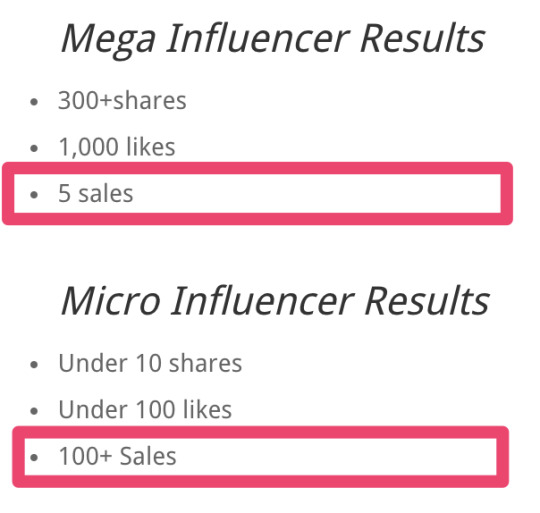
Why was that the result?
Despite smaller following than influencers, micro influencers often have a higher engagement rate and more of a personal relationship with their followers.
They might even think of their followers as friends and vice versa.
Additionally, most micro influencers are invested in their craft which makes them useful for marketers targeting niche markets.
Below you can see Erika advertising Capri Blue candles. A perfect fit for her brand and audience.

She tagged the post with “#ad,” which is incredibly important. The FCC has imposed regulations to ensure that influencers and brands state their relationships on posts.
How to get in touch with an influencer
You can find influencers by searching for popular hashtags related to your product.
Sometimes you don’t even have to look past your current followers. A passionate fan could also be a great micro influencer for your product.
If you’re stuck and can’t find anyone who fits your target audience, there are platforms to help you source micro influencers. Some include Upfluence, Grin, and Gnack.
Once you find an influencer, you can contact them through their DM’s or email. If they are commonly involved in campaigns, they might have their email on their page.
If so, simply email them to connect. Many leave their email addresses in their bio.
But what do you say?
You can send them a simple email like this to begin the conversation:
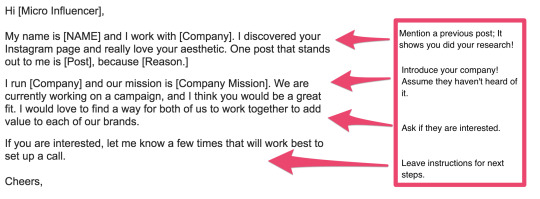
They get additional content for their channel. You get additional exposure.
It’s a win-win scenario.
5. Instagram Stories offer real-time engagement
Nope, I hadn’t forgotten Instagram Stories. Maybe I was saving the best for last?
There are a few reasons why Instagram’s user base keeps on growing at a crazy rate, and one of the reasons is Instagram Stories.
Of course, we’ve all seen a similar feature before over at Snapchat.
Snapchat’s business plan is built around their Stories feature, a popular feature which is arguably responsible for them experiencing a surge in daily active users over the years.
By the end of 2017, Snapchat had 187 million daily active users.
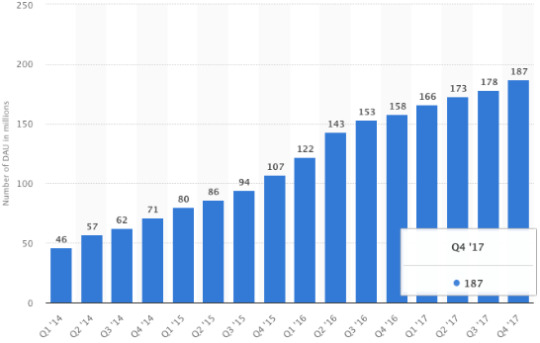
Instagram then went and launched their own Stories feature in mid-2017, and it has paid off.
Since adding it, Instagram’s user base has rocketed by 100 million.
By August 2017, the feature had 250 million daily active users, a figure which eclipses Snapchat.
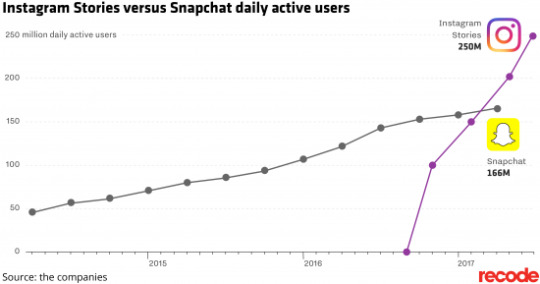
This means Instagram Stories has a bigger audience, which you need to target.
It also has a wider audience too, which means you’ve got a better chance of reaching your targeted persona.
Snapchat is experiencing a downturn in users at the moment, with studies showing that a percentage of its audience is actually heading over to Instagram instead.
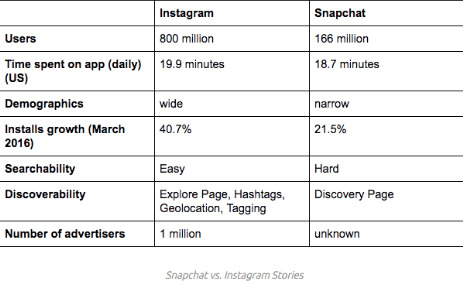
What does all this mean for you?
You need to use Instagram Stories.
Stories can now be viewed on desktop, while Story Highlights is a brand new feature that lets you showcase your most popular Story for longer than the usual 24-hour limit.
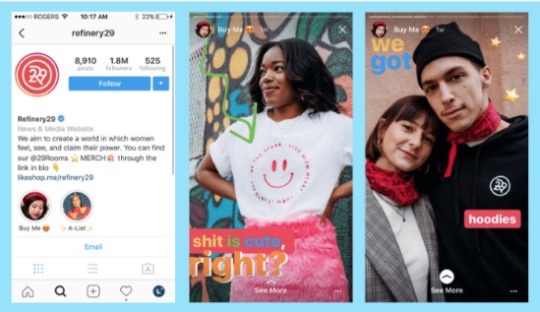
How to maximize Instagram Stories
Whether you use photos or videos, Instagram Stories are a great way to give your audience a “behind-the-scenes” glimpse of your business.
Below you can see the company Benefit sharing behind-the-scenes footage of their beauty shoot.
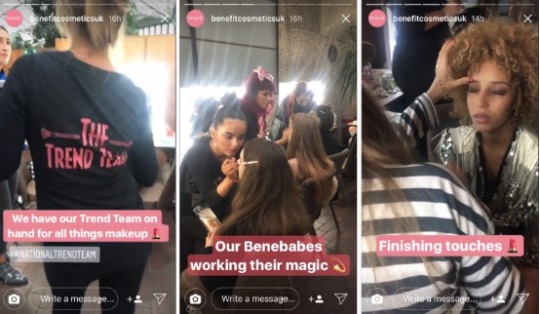
But your story doesn’t have to just be showing what’s going on.
You can craft a compelling narrative, too.
If customers or employees are happy to be involved, you should make them the stars! NASA spotlighted their employees who shared why they like working at NASA.

It’s really easy to record a video, too.
All you need to do is head over to the main Instagram Stories screen and press the icon at the top left-hand corner of the screen.

Then press the middle button and hold it, before releasing once the video is done.
To take a picture, just tap the button once and release.
Then, upload the video (or image) and add a caption or draw text onto it.
Off-the-cuff videos work because users appreciate live footage. It creates a sense of intimacy between you and your audience, and it’s good for transparency.
You can also use Instagram Stories to create a series of how-to articles or do-it-yourself tips on your page.
Below you can see Real Simple share quick household tips in their Instagram Story.
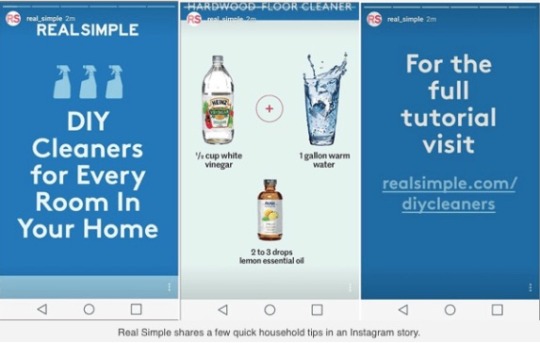
How to put together a how-to article via Instagram Stories?
The best way to do it is by using slides.
Simply put the slides together in a sequence before uploading them to Instagram Stories.
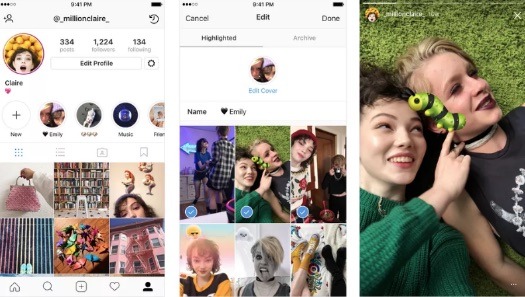
The slides need to be eye-catching, colorful and engaging.
If you’re not the most visually creative person in the world, you can use Canva to design your Story before uploading. It’s very easy to use for non-designers.
End each how-to Story with a compelling call to action that tells the viewer what they need to do next.

6. Showcase brand personality with augmented reality branded face filters
Instagram developed face filters for its users.
Some can make you look like a rabbit, and others can give you a crown on your head.
The filters work when using both the front and back camera on your phone.
But how can these filters benefit your business?

By using branded face filters.
We know that Instagram is in hot pursuit of Snapchat.
And we have already seen Snapchat offer sponsored Snapchat lenses for Red Bull, Mountain Dew, Michael Kors, and more.

So, Instagram likely isn’t far behind from opening face filters up to brands.
But this feature might not be available to every brand until 2019 and also may not be cheap.
A source that previously bought a branded filter on Snapchat and Facebook for their company spoke to AdAge and agreed Instagram’s branded face filters are impactful.
They said, “Instagram is a better place than Facebook for lenses. The way people use Instagram, it’s just more of a camera app.”
But that’s still a ways off.
For now, consider adding a hashtag sticker to your Story for more context.
To do this, create your Story first.
Then simply tap the sticker icon at the top right of your screen.
Next select and customize your hashtag.
Finally, add it to your Story.
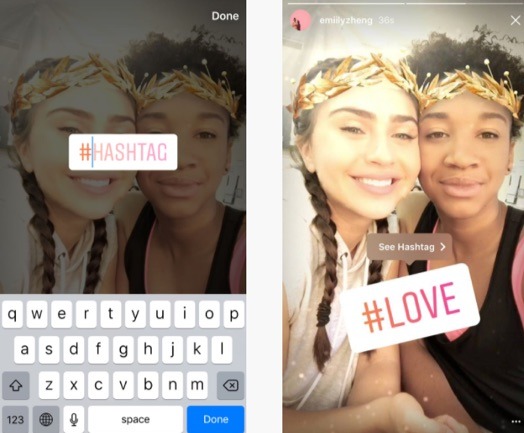
Of course, make sure the Instagram app on your phone is always updated.
You don’t want to miss out on any new features being dropped.
Head over to the Play Store for Android users or the App Store for Apple users.
Remember, people are less likely to follow an Instagram page that looks messy and inconsistent.
60% of the best brands use a consistent filter on Instagram.
A consistent aesthetic – and this includes the color palette, content, font, composition – is going to be essential to Instagram success in 2018.
Have a look at Desenio.
They use the same colors over and over again.

Take a step back and look at your feed as a whole. Do the images look good together? Is your aesthetic compelling and consistent?
If one moment a business is posting photos of food and the next moment they’re wading in on the current political climate, it’s going to be hugely confusing.
Their core message will be lost.
Don’t let this be your business.
Leave behind the bad habit of throwing your followers a curveball with a post that adds no value and makes little sense. Be predictable.
If there are old posts that no longer fit your aesthetic, you can either delete them or hide them using the Instagram Archives feature.
Conclusion
Instagram isn’t going away any time soon.
Users will continue to have faith in Instagram, and its audience is only going to grow and grow.
But unless you adapt to the changing trends, you’ll fall way behind your competitors.
Each time Instagram rolls out a new feature, such as Instagram Stories, don’t sit back and hope it goes away because you don’t like change. Be among the first to adopt it.
Take advantage of micro-influencer marketing. Target influencers in your niche that have already developed a relationship and trust with their audience.
Use Instagram live to create a sense of intimacy with your followers and connect with them regularly.
Carefully analyze your analytics so that you don’t waste your money on boosted posts. Take the time to build a community and treat your page just like you treat your brand.
Next, consider branded face filters. They may be available for your company to use very soon.
What trends are you using in your current Instagram campaign?
About the Author: Neil Patel is the cofounder of Neil Patel Digital.
from Search Results for “analytics” – The Kissmetrics Marketing Blog https://ift.tt/2vFD16m
#Digital #Analytics #Website
0 notes
Text
How these 10 Trendsetting Companies use Product Tutorials to Activate Every Single Sign Up
If you’re looking to take your business to the next level and help your products stand out, you can’t afford to ignore the power of product tutorials.
Ever tried to use a product without any instructions? It’s not a fun process, is it?
Product tutorials solve that problem by helping current and future customers understand the value of what you’re selling because they showcase exactly how to use it.
But when a product tutorial is too lengthy, too complicated, or doesn’t look like something your customer needs, they might end up abandoning it all together.
And that’s not a good sales strategy for anyone.
Because the end goal isn’t to get a customer, it’s to keep a customer.
And that means creating a product tutorial that makes it super easy for a new customer to start using—and succeed at using—your product.
So much so that they want to keep on using it. You know, forever.
Here are a few companies that did just that.
1. Buffer keeps it simple
The global average for cart abandonment across desktop, tablet, and mobile devices is a staggering 77.24%.

That means there is an extremely likely chance you’ll lose your hard-won customers before they even make it through the onboarding process.
Avoid this classic pitfall by keeping your product tutorial super simple. Just like Buffer.
To get started, you just have to connect your social network accounts.
And compose your first social media post.
Buffer sends a series of onboarding emails to customers to help them navigate their service, starting with this welcome email:
The email cross-promotes the Buffer browser extension and provides a brief breakdown of why it’s useful.
A few days later, the company sends a similar email that explains their Android and iOS app.
The entire signup process takes less than five minutes and is virtually foolproof. The onboarding email series guides customers along the way without overwhelming them.
The Co-Founder of Buffer, Leo Widrich, explained it best in this Chargify blog post:
“As entrepreneurs we’re often so excited about the possibilities of our product that we feel like we need to show our customers everything the second they sign up for our product.
Instead of doing that, at Buffer we focused on taking a step back and think about what the most successful customers did when they first joined Buffer.”
Try a similar approach with a series of short onboarding emails about your products and services.
Mint breaks their product tutorials down into small tasks to keep things simple, transparent, and easy.
2. Mint breaks it down into smaller tasks
The goal of many online products is to make something that is ordinarily complex, simple.
Mint, a financial services company, allows customers to view all of their banking accounts, credit cards, loans, investment accounts, and properties in one place.
But to see all of this information in one spot, a user first has to sort through all of their accounts, remember usernames and passwords, and upload them to Mint.
As you can imagine, this can be a rather arduous task.
That’s why Mint breaks up a rather lengthy onboarding process into just one task: Add a bank account.
That’s it. Just one bank account.
Once a customer has added an account, they can already see a small picture of their finances.
They already have a taste of success.
It’s so easy—and so gratifying—that it makes them want to do it again. And again.
And the onboarding emails sent by Mint are one of many reasons why the company grew to 1.5 million users in just two years.
Once customers sign up for the service, Mint sends out a welcome email to help users “manage their money” in five short steps.
From there, users receive customized weekly emails summarizing their account activity.
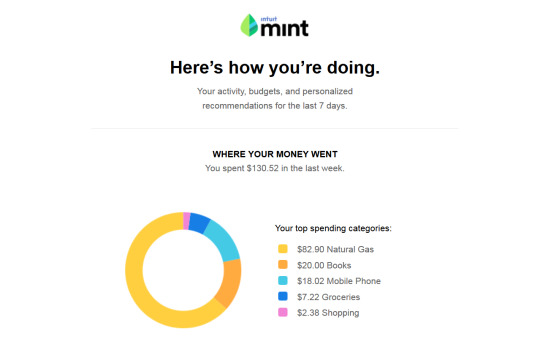
By simplifying a complex process into smaller, more manageable steps, you’ll increase the likelihood that your customer will stick around to complete them.
It doesn’t hurt to have a little fun throughout the process.
3. Canva makes it fun
Virgin America rocked the airline industry when they introduced a safety video people actually wanted to watch.
It was so good that more than 12 million people voluntarily watched it on YouTube—without ever stepping foot on an airplane.
Your product tutorial can be the fun part. Take Canva for example. Their growth process is simple, fun, and proven to work.
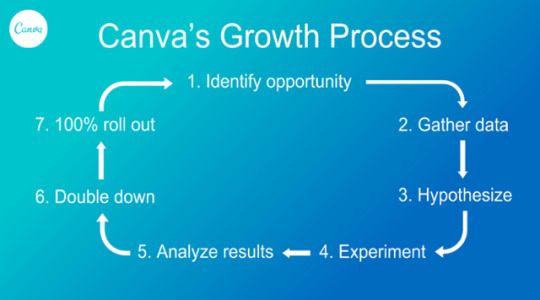
Once the customer opens the program, they’re immediately taken through the process of creating their first Canva design.
The customer can pick what they want to use the design platform for.
And what they want to design.

Then Canva uses animation to show them how to create design elements.
As the customer works their way through the design process, they can choose the colors, fonts, graphics, and design elements they want to create just about anything.
The fun, personalized product tutorial resulted in a 10% boost in activation for the company.
Canva’s emails are just as fun. They list which “Canva member number” that each new user is:
You can find similar success by creating exciting product tutorials and onboarding emails.
4. Evernote gets you to start now
As Ankit Jain puts it, “The key to [product tutorial] success is to get the users hooked during that critical first 3-7 day period.”
That means your customer needs to experience a taste of what your product has to offer as quickly as possible.
That’s exactly what Evernote does.
The note-taking program gives customers an opportunity to stay organized while keeping track of their meeting notes.
To get customers hooked, Evernote wants their customers to write their first notes right away.
So the second the customer signs-up there is a note there waiting for them.
It tells them how to compose their first note and all the fun things they can do with it.
Once the customer starts taking notes, they’ll likely be hooked.
In fact, they might eventually have so many notes that they need to pay for a premium Evernote account.
That’s probably why more than 220 million users use Evernote.
Evernote introduces new users to their service with a series of onboarding emails that teach them how to use the service to its full potential.
The series starts with a welcome email that wastes no time at all. There is a “Download Evernote” button right in the email body.
Cut to the chase quicker, just like Evernote, to activate more of your sign-ups.
5. Maven makes it personal
We know that email marketing is much more effective when it’s personalized. So why aren’t our product tutorials personalized as well?
For example, remember when doctors used to make house calls? Yeah me neither.
Despite the fact that house calls were way before my time, I still yearn for that level of personalized care.
I don’t want to look up answers to my health challenges online. That does nothing to reassure me.
And I don’t want to go to an urgent care clinic where no one knows me. They’ll just prescribe me something I don’t need.
Instead, I want to feel heard. I want to feel as though I’m taken care of.
And that’s exactly what Maven Clinic taps into.
Maven Clinic allows customers to schedule video appointments with doctors, physical therapists, and mental health professionals.
Even though it operates entirely online, it still feels personal, and they reinforce that level of intimacy throughout the entire product tutorial process.
And the company’s emails follow the exact same tone.
Maven’s founder, Kate Ryder, says that this personal touch is what makes the company such a success.
“The responses we get from clients after launching Maven are fantastic — they get great feedback from their employees about how this sends a positive message about supporting a family-friendly culture.”
The second a customer signs-up they receive a welcome note from their own personal wellness coordinator.
The note gives the customer the opportunity to feel welcome, to feel taken care, and to feel as though there is someone available to care for their needs.
This level of personalization is important. Especially in a field as intimate as health care.
Customers want to feel as though they are part of something bigger. They want to feel connected to the world around them.
They don’t want to feel as though they are all alone in the world.
And companies are reaping the benefits. One Maven client offered unlimited maternity leave to employees.
But with the personal features offered by Maven, the longest leave taken was only 7.5 months.
Tap into that emotionality by personalizing your product tutorial.
Customers that feel included are more likely to engage with what you’ve created for them.
6. Asana lets you customize
The point of a product tutorial is not to help you get more customers, it’s to help your customers use—and love—your product.
If your customer goes through your product tutorial only to find that it doesn’t meet their needs, they’re never going to use it again.
But if you use the product tutorial as a way for your customers to customize the experience of your product, that’s a win-win.
Asana, a project management tool, does this brilliantly, which is probably why the company is worth over $600 million.
And because there is an infinite number of reasons a team might need a project management tool, the first thing Asana does is ask the customer to customize it to their needs.
It asks about their teams:
Their first project:
And how they want that project laid out.

From there, the customer can start adding tasks to their projects.
And by the end of the product tutorial, the customer will have a product that is specifically catered to their needs.
Asana’s welcome emails are just as effective. The headline reads: “What do you need to get done today?”
The result is that the customer always gets what they want.
And that’s always a winning strategy.
7. Timely has two fields
How many fields do you really need your customers to fill out?
Historically speaking, analysts have recommended using no more than three form fields on a landing page.
Yet so many onboarding processes ask for way too much information. Do you really need your customer’s first name? Last name? Phone number?
Every field you ask your customer to fill out is another chance they might not stick around to get through it.
This is an era of instant gratification we’re living in.
If you don’t need a field, don’t ask for it.
In the case of time management software Timely, they only ask for two fields.
From there the customer can get right to managing their time.
And if they need more information, there’s an email for that.
Timely understands what their customers are looking for and they only need two pieces of information to give it to them.
A good product tutorial should do the same. Ask only for what is most vital to getting your customer into your product and engaged with it.
Anything extra is just giving your customer an easy out.
8. Slack gives you the basics
I know. You want to teach your customers all about your product.
After all, you created all of those amazing features and benefits just for them.
But if your product is a little more complicated to use, please don’t try to teach your customer everything they can do with it at once.
Instead, start with just the basics. Give your customer the bare minimum of functionality they need to get started.
Once they’re hooked, you can teach them more. But at the beginning, the last thing you want is for your customer to get overwhelmed and quit.
Take Slack for example. The company has over 5 million daily active users and 1.5 million paid users.
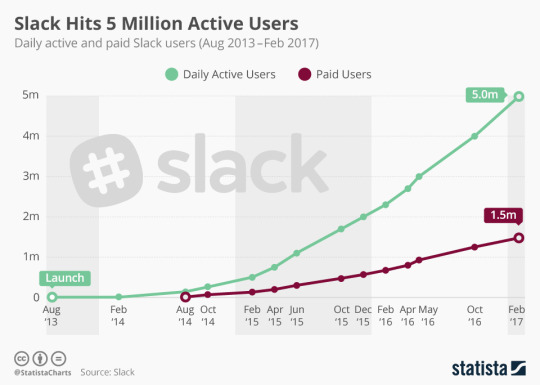
The workplace communication service was designed to roll email, instant messenger, and video chat into one app. And they even do so much more than that.
But they don’t tell you that all at once. Instead, they tell you the three most basic things you can do with their app.
They tell you all about channels:
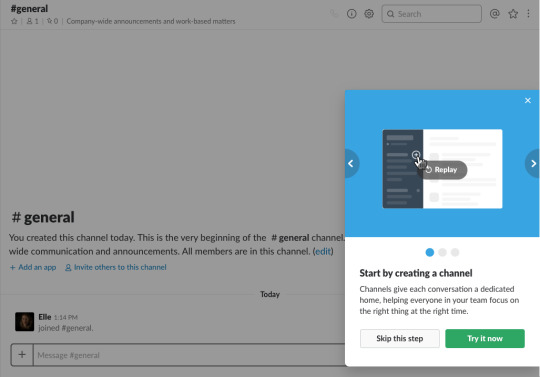
Messages:
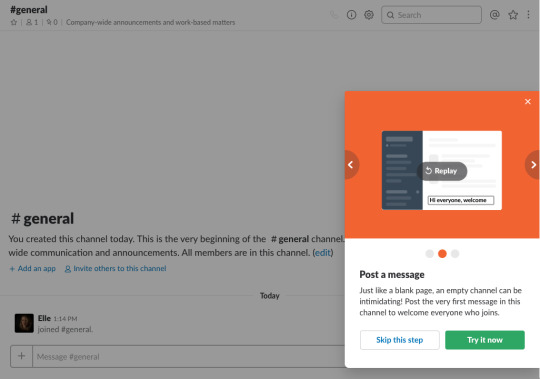
And uploads:
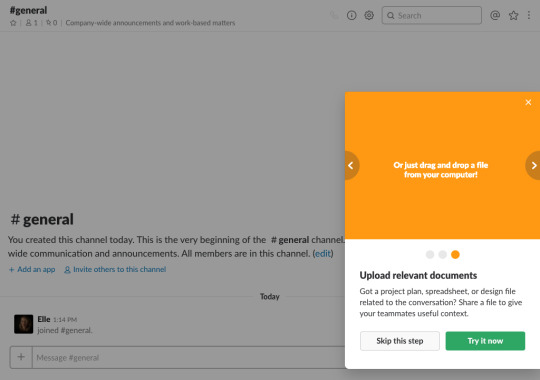
Once you have the basics mastered, Slack tells you how you can learn about the rest when you’re ready:
Slack CEO Stewart Butterfield explained this tactic in an interview:
He said, “It’s less (about) features that are ahead of where the users are and trying to understand” [the need of the customers].
Slack’s onboarding emails keep it basic, too. Their welcome emails are sleek, simple, and get to the point right away.
By keeping to the basics, Slack users can get right to work reading through their channels, sending messages to their co-workers, and uploading important documents.
Once they see the value of your product, they’ll come back for more.
Until then, give them the bare minimum they need to succeed.
9. MailChimp hides their advanced functionality
Most businesses don’t start out with 100,000 customers. In fact, most businesses start out with just one.
Over time they grow and scale and require a lot more functionality than they used to.
But at the beginning, they don’t need all that functionality.
More likely than not, they need only the most basic functionality.
MailChimp gets that. The email platform has every bell and whistle you could possibly imagine.
That’s probably why the company made more than $400 million in 2016 and grew their user base from 12 million to six million in just one year.
They have A/B testing, integration with Salesforce, newsletter sign-up forms, and complex analytics.
But when you’re just starting out, you don’t need any of that.
In fact, when you’re just starting out, all you need is to be able to email your customers.
That’s where Tiny Letter comes in.
Tiny Letter is MailChimp’s lite program. All you do is sign-up, upload your existing customers, and send them an email.
That’s all there is to it.
There’s no analytics. There’s no A/B testing. There are no embedded forms. There are no design elements.
It’s just a simple way for your business to send an email to everyone you want to send an email to.
You can keep using Tiny Letter until you have 5,000 subscribers. But by then you’ll probably want to add a bell or whistle or two.
That’s when MailChimp pulls back the curtain and lets you see all of your deepest desires.
But not a moment before you’re ready to see them.
MailChimp emails are designed to serve the exact same purpose.
Online training, a knowledge base, marketing guides, and a blog are listed to help users become acquainted with the service before diving in deeper toward advanced features.
10. Expensify makes it easy
In some cases, it’s relatively easy for a customer to want your product and even to sign-up for it, but then they struggle to roll it out for their employees.
The product tutorial is the perfect opportunity for you to address those concerns.
Take Expensify, who doubled their customer base in six months, for example.
Expensify lets employees submit their expense reports and get reimbursed for them.
But getting employees to start using the program means making it as easy as pie.
Expensify simply asks who it should submit receipts to.
And when they should be submitted each week.
That’s it! The employee can immediately start uploading pictures of their receipts.

And Expensify will do all the rest.
The brand doesn’t even require users to create a password at first. Instead, users can create a password once they receive a welcome email. The entire sign up process is practically infallible.
The easier it is for companies to roll your product out to their employees, the more likely they are to bridge the gap from purchaser to loyal customer.
Mind the gap. Make it easy.
Conclusion
You should be thinking about your customer and what they need from your product. Period.
Find ways to make your product tutorial simple and engaging. Give your customers what they came for. And fast.
Your product tutorial should be so easy and intuitive that anyone can get started. Even your grandmother.
Encourage your customers to take (at least one) action right away, like sending an email.
They’ll be able to see what your product can do. And whether or not they prefer your product to another one.
Keep tutorials simple like Buffer or break things down into actionable, smaller steps like Mint.
Spice tutorials up and make them fun like Canva or make users get started right away like Evernote.
Be personable like Maven or let users customize their experience like Asana.
Timely only has two required fields, which could help you keep onboard customers more effectively. Slack only gives users the basics, which keeps them from becoming overwhelmed.
MailChimp hides advanced features until users are much more experienced, while Expensify makes it easy to sign up for their service right away.
As a result, users of these services can get hooked on using these products and services monthly, weekly, or daily.
That’s what a successful product tutorial should do. It shouldn’t turn your subscribers into churners. It should turn your subscribers into users.
How have you used product tutorials to activate your sign-ups?
About the Author: Neil Patel is the cofounder of Neil Patel Digital.
from Search Results for “analytics” – The Kissmetrics Marketing Blog https://ift.tt/2FaJZzV
#Digital #Analytics #Website
0 notes
Text
Is Facebook Organic Reach Really Dead? Here’s How to Break Through It for More Social Engagement
Every now and then, the overlords of the Internet decide to change things up in the digital marketing world.
And with how fast things change, it can sometimes be easy to miss a noteworthy tidbit of news.
One such tidbit recently came to light, and it’s definitely worth your attention.
Namely, Facebook has started taking steps to change the Organic Reach of pages on their platform.
And that has some implications for everyone.
It doesn’t matter if your Facebook Page shares memes, connects a community, or is a landing page for your brand.
You’re going to see some changes, and chances are they will come sooner rather than later.
To help cut through the clutter and keep a clear picture of the path ahead, I’m going to lay out what’s actually changing.
And at the end, we’ll give you some insightful ways to come out ahead.
Hopefully, you’ll be able to take action accordingly and still have a healthy Facebook presence.
But first, let’s talk a bit more about what Organic Reach actually is, and why it’s changing.
What is Facebook Organic Reach?
Organic Reach on Facebook is simply a measurement of how many people can find you on Facebook for free.
It’s much like organic rankings on a search engine, although in the case of Facebook it’s based on aspects like popularity, post frequency, and other contributing factors.
And when you think about the current state of Facebook, it seems logical that Facebook would be making some big changes.
With more and more content being generated and shared, plus with how the News Feeds curates the content you see, it’s natural that Facebook would need to fine-tune their system from time to time.
And so Facebook is making changes.
Specifically, they’re changing Organic Reach to look and feel a little more like the Paid Reach measurements.

The newer look really only changes a few minor elements, but the numbers will look bad nonetheless.
Previously, Facebook counted Organic Reach as any time an unpaid post appeared in someone’s News Feed.
Now, Organic Reach will only give you a hit if your unpaid post actually enters a person’s screen.
The changes don’t affect how your post is shown to anyone, nor does it really change anything about how posts are displayed at all.
It just affects how Organic Reach is tallied, but that makes a difference.
The seeming paradox then is that you can expect your Organic Search traffic to take a big hit, but that particular metric should be a lot more accurate.
According to Mark Zuckerberg, there’s a good reason for the death of Facebook’s Organic Reach:
“Recently we’ve gotten feedback from our community that public content — posts from businesses, brands, and media — is crowding out the personal moments that lead us to connect more with each other.”
He goes on to discuss how Facebook will be changing to mitigate this issue.
Specifically, Zuckerberg wants Facebook to be better geared to curate content that builds meaningful relationships.
And it’s worth mentioning that Zuckerberg himself lost about $3.3 billion because of this decision.
But what exactly is this “death” in terms anyone can understand?
More importantly for you, how might this affect your business?
To give you an idea, you have to look back a little bit.
Because as of June 2016, the Organic Reach of a Facebook Page had fallen to a mere 2%.

That’s a crazy drop from just four years prior, and Facebook and Zuckerberg still think that there’s too much Organic Reach for a Page.
So it’s pretty clear that if 2% reach is too much, we’re nearing the end of an era in terms of Organic Reach being the best viable option for spreading your brand on social media.
And the implication is pretty clear for business owners.
Your page is going to have less Organic Reach.
And with Reach dropping, you can fully expect that engagement is going to go with it.
So at this point, you’re probably wondering if there is any hope beyond the doomsday hype?
The answer is yes.
Because Organic Reach is not totally gone, and it probably won’t ever be.
The key here is to simply understand the changes taking place in the Organic Reach algorithms.
The consensus is that Facebook waging war against low-quality content, which means there are still avenues you can take that will help your Organic Reach.
You simply need a different strategy than saturation.
So now that you know what’s going on, let’s look at some ways you can use these changes to your advantage.
Tip #1: Focus on quality, not quantity
First and foremost, you need to understand that Facebook is changing to emphasize quality over quantity.
I’m going to repeat that for emphasis: Quality over quantity is the first place to start.
There’s been a long-running misconception that posting more or less on Facebook equates to more reach, but that’s as ludicrous as treating a “Like” as a useful metric.
You’re just making things worse for yourself if your goal is to post as frequently as possible, especially with the new changes.
And posting infrequently doesn’t do you any favors either.
Because the data points to a truth that couldn’t be further from a quantity-driven approach.
First of all, studies have shown that a moderate amount of posting seems to edge out posting too much or too little.
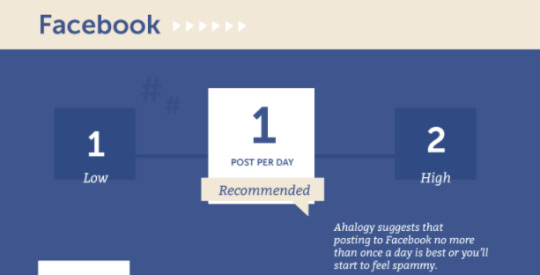
So when there are fewer posts, it becomes less likely that a post gets lost in your audience’s feed.
Which means your Organic Reach is going to do better with just a few, high-quality posts.
But don’t get carried away thinking high-quality posts can still be posted as often as possible.
Because the data still points in the opposite direction.
Buffer conducted some tests that help prove this point beyond any doubt.
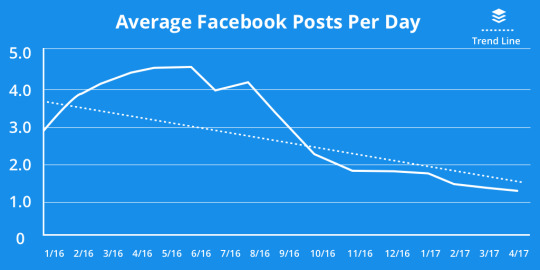
They started by evaluating how many posts were being created per day on their Page.
As you can note, over the course of 2016 and into 2017 they say a fairly significant drop in how many times they posted.
To be precise, they were posting at half the peak rate by the middle of 2017.
And oddly enough, this trend helped them increase their Organic Reach:
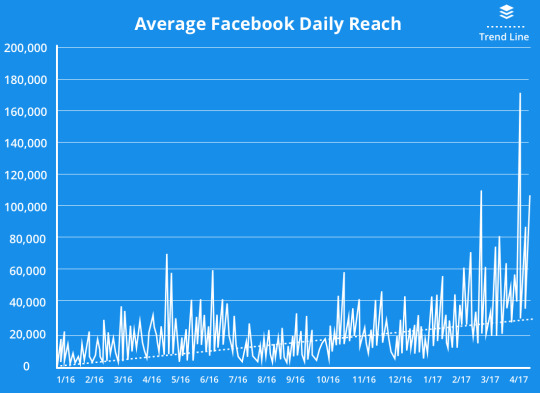
They went from capping out with an Organic Reach of ~70,000 to a top reach of ~170,000.
That’s a 100,000 Reach spike that can be directly related to the frequency with which they posted on their Page.
And what’s more, they also saw a boost in direct engagement from this study as well:
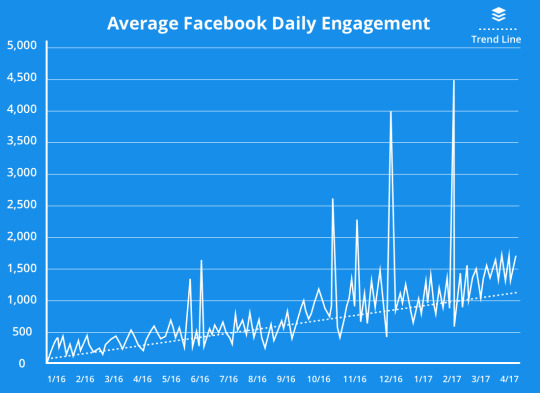
This is a powerful illustration of how simply posting less and focusing on quality can improve your overall Organic performance on Facebook.
And this isn’t just a fluke.
It starts and ends with original and share-worthy content that will actually engage your audience.
Which means you need to focus less on pumping out content and focus more on crafting something that’s truly shareworthy.
You’ll see better Organic Reach, and you won’t regret it.
Tip #2: Know what your audience is looking for
A high-quality post isn’t just going to come from nowhere.
It starts with a more concerted effort to offer higher-quality content around your brand as a whole.
That means finding topics that are meaningful and then generating something that’s both shareworthy and relevant.
The more specifically targeted your approach, the better off you’ll be.
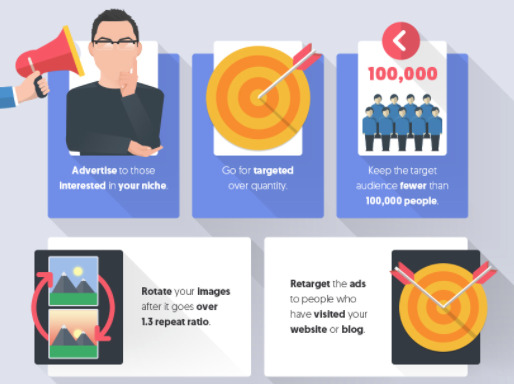
Small changes go a long way in improving quality, and the ultimate application is up to your unique brand.
The only way to truly know what “quality” means for your Page is to create some, test it, and then start making changes.
But that doesn’t mean you don’t have any other direction before you just start creating content.
One place you can start is simply by knowing which posts are right on Facebook, such as video.
Sharpie does a great job of creating interesting video that generates views and shares throughout their audience.
Here’s a recent example of one of their videos that partners Sharpie with NBA star Chris Paul:
Even if you can’t partner with a celebrity, you can use video to help boost your Organic Reach and increase engagement.
And success on Facebook through video isn’t just speculation either.
There are plenty of success stories, like this one from Audi:
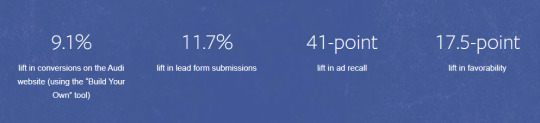
Even in the highly competitive automotive industry, they were able to boost their lead generation by almost 12%.
And if that doesn’t convince you, I highly recommend you go check out more success stories.
It doesn’t even have to be long video either, as Facebook recently launched their own Boomerang application.
And whether you use video or not, just remember that high-performing and popular Facebook posts are a mixture of entertaining and educational.
Don’t mistake that as an either/or situation.
You need a mix of both if you want to succeed.
Most importantly, I recommend looking into what online audiences are actually consuming these days.
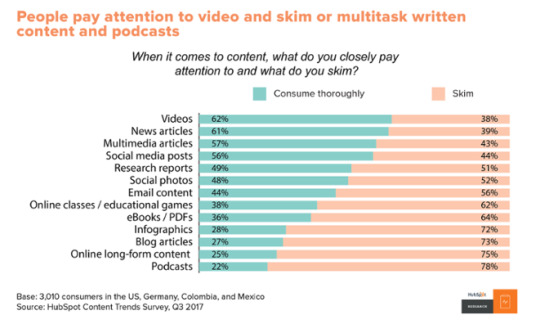
You might love creating and sharing your podcast for a blog post, but you’ll get more facetime with a sharp video or even just a simple photo.
And then there’s also the problem of engagement baiting, which Facebook has started to crack down on.

You might think it’s okay to ask for Likes, Shares, or “votes,” but the dark days of those posts are behind us.
Facebook now filters posts like these and gives them a lower priority than posts with more engaging content and imagery.
So all things considered, you have a lot to consider when you’re trying to pin down what your audience wants to see.
But if you put in the effort, you can develop a system that keeps your brand in the spotlight without dipping into your ad budget.
Tip #3: Consider your timing
You may have heard the news already, but there is such a thing as an “optimal time” when you’re posting to Facebook.
It just depends on a few essential elements.
The basics are pretty simple though.
Knowing when Facebook tends to be most active overall can help you time your posts accordingly.
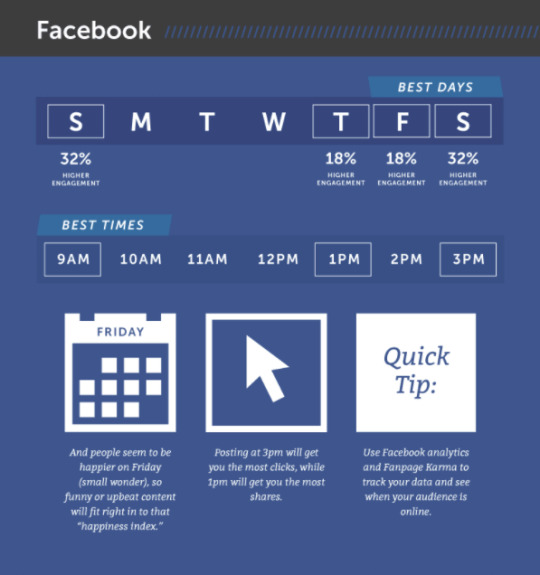
Studies show that sharing at different times will affect Likes, Shares, and overall engagement statistics.
You can also try to take advantage of multiple spikes like this, but remember you want quality over quantity.
One or two posts per day will do just fine.
If you post at the right time, it’s more likely that your audience will actually be on to see your post.
That by itself could increase your Organic Reach and help you engage with your followers.
But keep in mind that performance can be industry specific as well, so do your homework before you simply start changing all of your posting times.
And once you check your own industry’s trends, make sure that the information you uncovered accurately matches your own audience by examining your own Facebook Page’s Insights tab.
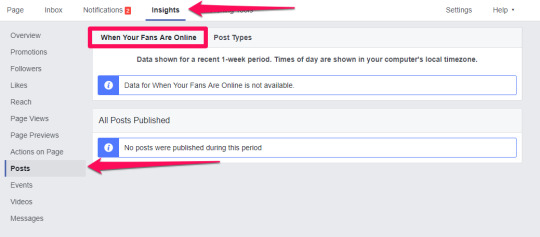
Your goal here is to simply avoid posting at times when your audience is unlikely to see posts.
If there’s a verifiable time when engagement and Reach dips, you might not want to share your best content at those times.
And there are a lot more studies on this topic than just the ones above.
Kissmetrics has put together research that verifies the science of timing posts.
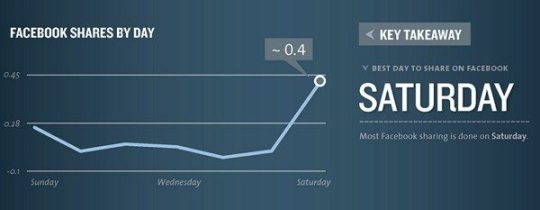
All of this research points to one thing in regard to Organic Reach.
Namely, that it’s best for you to let the Facebook algorithm focus on delivering one piece of content to your audience.
This approach mitigates the need for Facebook to filter and select your strongest content.
If you only ever share your best content at the best times, Facebook will still work well for you.
The trick is just to know when to post on Facebook.
Do your own research, and then use the results you find to your advantage.
Tip #4: Variety helps, so start curating
Curation can be a tricky topic.
Why would you want to put another brand’s content on your page?
Isn’t that counterintuitive?
You may be surprised, but it could actually help.
Recent studies suggest that the curating on Facebook can solve many common issues faced by marketers:
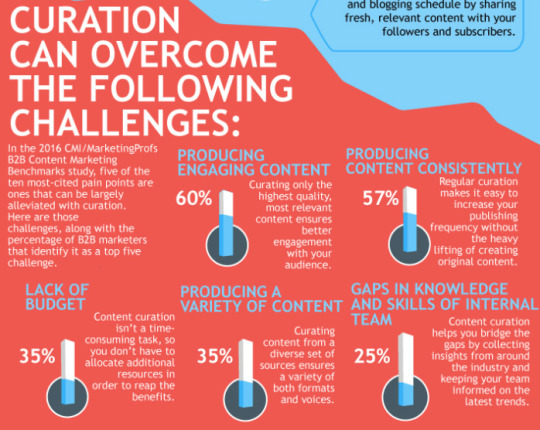
As long as you’re mindful of brands and companies that have a strong following or high brand loyalty, you can leverage a strategic tag to increase your own engagement.
So it’s a good idea to start sharing more curated content in addition to the content you create.
Curating content is the relatively simple process of finding great content from other sources on the Internet and then sharing it with your own audience.
As long as you know your audience, and find posts that match your target, you can provide supplemental content that still helps your brand’s Organic Reach on Facebook.
It’s also a good idea to add tags to posts like this when and where it’s appropriate.
In essence, this practice “signals” to Facebook that you have interesting content that needs to be shown more often.
As long as you’re following your analytics closely with this type of targeting, you’ll see good results over time.
Tip #5: Stop selling
One of the biggest toe-stubbing moves that can hurt your Organic Reach is trying to sell too much.
And with Facebook essentially turning the tables on solely commercial content, this is a bigger deal than ever.
But think of it in terms of volume alone.
Even in your own industry, you’ve likely found that there’s an increasingly saturated social media network that you have to wade through.
With Facebook focusing more on engagement, simply trying to route traffic to your website can be a mistake.
That means that Facebook is also evaluating intent when it filters content.
This particular trend isn’t exactly in your favor.
And when you tack on that Facebook users are savvy enough to filter out the content that they don’t want to see even if it makes it past the News Feed algorithms, you have a recipe for disaster.
That’s why understanding where social media fits into the sales funnel and focusing on brand awareness will serve you better for Organic Reach.
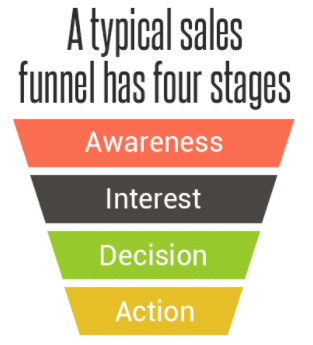
Social media is a top-of-the-funnel endeavor, and you have to treat it that way.
Going for a hard sell just isn’t going to work, and that type of content is just going to get filtered out by either Facebook or your audience.
There’s a greater need now more than ever to engage directly with your community.
That means instead of just posting random articles, you need to find ways to have discussions on your Page.
You need to spend more time being active and replying to comments on posts, even unhelpful ones.
Because your audience craves acknowledgement more than anything.
They just want to be heard.
Real-time engagement can help the Organic Reach of your brand more than a sales-oriented post ever could.
That’s why you need to ditch the old sales funnel approach to social media and adopt a more accurate idea of what social funnels look like.

Notice how the elements in the top part of this funnel are more relationship oriented.
That’s because your Organic Reach relies on audience building with Facebook, not sales.
And I can’t over-emphasize how important this shift is.
Because business are almost always affected by changes to social networks, which is why the idea is to share content users are interested in and will actually engage with.
You need to worry about sales a little later, preferably once your audience is established and loyal to your brand.
Which oddly enough means you need to be smarter about your Facebook Ads budget.
Because that’s one of the best ways to invest in building your audience with a longer funnel.
You need to embrace Facebook as a pay-to-play game, because it is for better or worse.
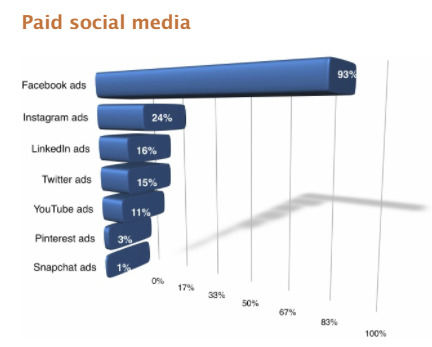
More and more marketers are coming to Facebook, and it’s already the top source of paid social media in the world by a long shot.
Which means the only way you can play, or win, is to start investing your money in it wisely.
Try boosting posts that have already proven to be strong performers, not just the posts you think will perform well.
That means you need to post content first, then check your engagement.
Then if your audience engagement is strong, boost that post so that it reaches even more people.
In sum, create and boost great content, not just any content.
Because if recent trends have shown us anything, it’s that we’re only going to see an increase in spending on paid digital advertising in the coming years.
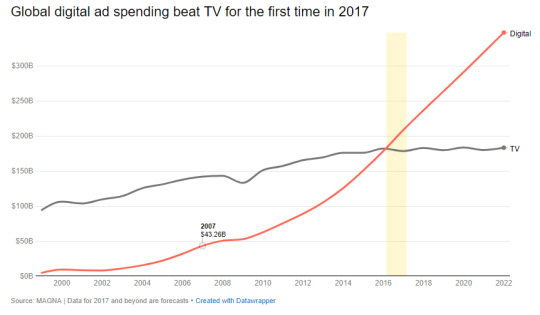
So learning to couple the pay-to-play element with the other tactics in this post is the best way to move forward.
Since you can’t just rest on your laurels and coast off of Organic Reach anymore, you have to take action.
Tip #6: Consider an alternative route
The final piece of advice that I want to leave you with revolves around a rather unsung element of Facebook: Groups.
From a marketing point of view, Facebook Groups have been relatively incognito due to how a sort of risk-reward equation that always tipped more toward risk.
It was just easier to post on your Page, pay for your ads, and ignore Groups.
But now, they’re looking more attractive.
And this makes sense. A Group around your brand is one that consumers will have to opt into.
Which means they get notifications and engage with your brand at a deeper level.
Plus, they’re free, which can’t be beat.
And Facebook has been giving quite a bit of attention to Groups lately:
With more than one billion Facebook users involved in Groups, we may well be looking at a new frontier for social media marketers.
It may take time to lay the groundwork and build your community, but there’s no denying the potential power of your own Group.
They could be the ultimate answer to the Organic Search issue.
Conclusion
The truth of the matter is that Facebook Organic Reach is not dead.
It’s just different than what you’re used to.
Facebook has changed the game, but that doesn’t mean you can’t still play it well.
You just have to realize that your metrics only look different. In reality, your Organic Reach is more accurate than ever, which is a good thing.
But these changes require that you take a new approach to maintaining and improving your social engagement.
A simple change like focusing on quality over quantity is by far the best places to start.
But more than that, try to find the format that fits your audience. Use blog posts, images, and especially video to engage to the fullest.
Then take strides to post your best content at the right time on the right day of the week.
You can also start to curate content that your audience will be interested in, which tells Facebook that your content is shareworthy.
Overall, just focus on brand building, not sales.
And remember that Facebook is now a pay-to-play system for marketers. If you want to win, bring your checkbook.
Finally, start considering Groups as an alternative for opt-in engagement. You could be suprised by what you find.
At the end of the day, your Organic Reach rises and falls on how well you execute the strategies in this post.
All you have to do now is find a way to stick with these changes.
What methods have worked best for keeping Organic Reach up for your brand?
About the Author: Neil Patel is the cofounder of Neil Patel Digital.
from Search Results for “analytics” – The Kissmetrics Marketing Blog https://ift.tt/2K1l7hG
#Digital #Analytics #Website
0 notes