
Last Seen Blogs

dyketectivecomics
Sirens Karaoke Night

catshoponwheels
Cat Shop on Wheels

ter2seok
memories.

how2parent
PARENTING, CHILD CARE, BRAIN DEVELOPMENT, MOM CARE

megatronsimp
Until All are One
Text
Testing with a Moderator
Null hypothesis: The age of an adolescent does not affect the number of friends s/he has.
Alternative hypothesis: As an adolescent grows up, s/he will make more than 1 friend.
Code:
#subset of data containing all adolescents, no. of friends, age, rowdiness
sub9 = data[['Friends', 'age', 'Rowdy']]
sub10 = sub9.copy()
#remove needless data from Rowdy
sub10['Rowdy']=sub10['Rowdy'].replace(6, numpy.nan)
sub10['Rowdy']=sub10['Rowdy'].replace(8, numpy.nan)
sub10['Rowdy']=sub10['Rowdy'].replace(9, numpy.nan)
data_clean2=sub10.dropna()
data_clean3=data_clean2.copy()
print('association btw age and number of friends: (r, p-value)')
print(scipy.stats.pearsonr(data_clean3['age'], data_clean3['Friends']))
print()
#categorising ages
def agegrp(row):
if row['age'] < 13:
return 12
elif row['age'] < 14:
return 13
elif row['age'] < 15:
return 14
elif row['age'] < 16:
return 15
elif row['age'] < 17:
return 16
elif row['age'] < 18:
return 17
elif row['age'] < 19:
return 18
elif row['age'] < 20:
return 19
elif row['age'] < 21:
return 20
else:
return 21
#splitting moderator into 3 categories
def rowdygrp(row):
if row['Rowdy'] == 0:
return 1
elif row['Rowdy'] == 1:
return 2
elif row['Rowdy'] >= 2:
return 3
data_clean3['RowdyGrp'] = data_clean3.apply(lambda row: rowdygrp(row), axis=1)
data_clean3['age'] = data_clean3.apply(lambda row: agegrp(row), axis=1)
print(data_clean3['RowdyGrp'].value_counts(sort=False))
print()
SA = data_clean3[(data_clean3['RowdyGrp']==1)]
someSA = data_clean3[(data_clean3['RowdyGrp']==2)]
noSA = data_clean3[(data_clean3['RowdyGrp']==3)]
#pearson correlation
print('association btw age and no. of friends for adolescents who are socially aware:')
print(scipy.stats.pearsonr(SA['age'], SA['Friends']))
print()
print('association btw age and no. of friends for adolescents with some social awareness:')
print(scipy.stats.pearsonr(someSA['age'], someSA['Friends']))
print()
print('association btw age and no. of friends for adolescents without social awareness:')
print(scipy.stats.pearsonr(noSA['age'], noSA['Friends']))
#graphs
scatSA = seaborn.regplot(x='age', y='Friends', data=SA)
plt.xlabel('Age')
plt.ylabel('No. of friends')
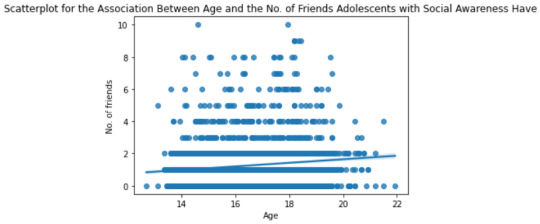
plt.title('Scatterplot for the Association Between Age and the No. of Friends Adolescents with Social Awareness Have')
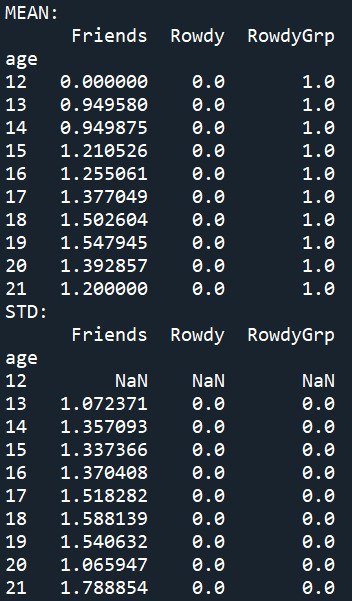
print('MEAN:')
print(SA.groupby('age').mean())
print('STD:')
print(SA.groupby('age').std())
print()
scatSomeSA = seaborn.regplot(x='age', y='Friends', data=someSA)
plt.xlabel('Age')
plt.ylabel('No. of friends')
plt.title('Scatterplot for the Association Between Age and the No. of Friends Adolescents with Some Social Awareness Have')
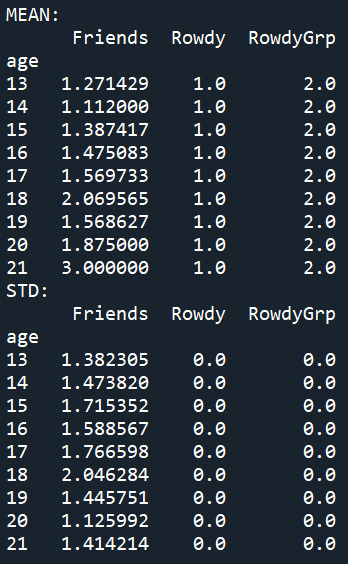
print('MEAN:')
print(someSA.groupby('age').mean())
print("STD:")
print(someSA.groupby('age').std())
print()
scatNoSA = seaborn.regplot(x='age', y='Friends', data=noSA)
plt.xlabel('Age')
plt.ylabel('No. of Friends')
plt.title('Scatterplot for the Association Between Age and the No. of Friends Adolescents Without Social Awareness Have')
print("MEAN:")
print(noSA.groupby('age').mean())
print("STD:")
print(noSA.groupby('age').std())
Results:


Summary:
Based on the results, there is enough evidence to reject the null hypothesis, where age does not affect the number of friends an adolescent has, as p-value is very low (2.37e-10). There is a weak positive association between age and number of friends (0.121), and based on age, we can only predict 1.5% (r2) of the variability we'll see in the number of friends.
A possible factor that can affect the number of friends an adolescent has is their awareness within society (moderator). I have split the moderator into 3 categories:
- Socially aware (not rowdy in public)
- Some social awareness (rowdy in public 1-2 times)
- No social awareness (rowdy in public 3 or more times)
Within the 3 categories, we can confidently reject the null hypothesis for adolescents across all categories of social awareness as p-value in each category is <0.05. However, it would be the hardest to predict the number of friends adolescents with no social awareness have due to its lowest r2 value of 0.00539.
Adolescents are likely to make a mean of 1 friend as they grow up, with a standard deviation of +- 1. However, older adolescents with some social awareness are more likely to have more friends than adolescents in other groups.
0 notes
Text
Pearson's correlation coefficient
Code:

Results:


Comparing the two quantitative variables - age of adolescents (explanatory) and the number of friends made (response), we can see a weak positive association between the two variables (r=0.120, p=6.913-17). Given the extremely small p-value, we can reject the null hypothesis that age does not affect the number of friends adolescents have.
The r squared value is 0.0143, suggesting that if we know the age of an adolescent, we can only predict 1.43% of the variability we will see for their respective number of friends.
0 notes
Text
Chi-square test of independence
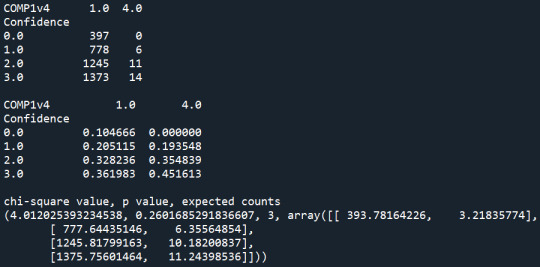
When examining the association between the number of friends an adolescent has (categorical explanatory: collapsed into 4 categories) and their confidence level (categorical response), a chi-square test of independence revealed that among adolescents with more than 1 friend (my sample), there was no evidence to reject the null hypothesis, where having more friends boosts confidence levels. Adolescents with 9-10 friends were similarly confident most/all of the time (45.2%) as those with only 1-2 friends (36.2%), X2 =10.72, 3 df, p=0.296.

The degree of freedom (df) is the number of levels of the explanatory variable -1. Here, the df is 3 as there are 4 levels of confidence experienced by the adolescents (df 4-1=3). Hence, for the association to be significant, p-value should be less 0.0167 (p < 0.05/3 = 0.0167).
Further post hoc chi-square test was done, which emphasises the lack of association.
Post hoc comparisons of the number of friends an adolescent has by pairs revealed that the highest level of confidence experienced by adolescents was similar among those with 1-2 friends, and those with 3-5 (X2=0.244, p=0.97), 6-8 (X2=6.28, p=0.0988), or 9-10 (X2=4.01, p=0.260) friends. While there were no significant associations it may be helpful to note that during the paired comparisons, adolescents with more friends tend to experience higher levels of confidence, with the exception of 1-2 (36.2%) vs 3-5 (35.3%).


Code:
#group children into categories (0, 1-10; 1-2, 3-5, 6-10)
data['FrenCat'] = pandas.cut(data.Friends, [-1, 0, 10])
#print(data.groupby('FrenCat').size())
sub3['FrenCat2'] = pandas.cut(sub3.Friends, [0, 2, 5, 8, 10])
print(sub3.groupby('FrenCat2').size())
print()
#subset variables in new data frame, sub1
sub4 = data[['FrenCat', 'Confidence','Hopeful', 'Happy', 'Enjoy']]
#subset variables in new data frame, sub3
sub5 = sub3[['FrenCat2', 'Confidence', 'Hopeful', 'Happy', 'Enjoy']]
sub6 = sub5.copy()
#contingency table of observed counts
ct1=pandas.crosstab(sub5['Confidence'], sub5['FrenCat2'])
print (ct1)
print()
ct2=pandas.crosstab(sub5['Hopeful'], sub5['FrenCat2'])
print (ct2)
print()
ct3=pandas.crosstab(sub5['Happy'], sub5['FrenCat2'])
print (ct3)
print()
ct4=pandas.crosstab(sub5['Enjoy'], sub5['FrenCat2'])
print (ct4)
print()
column percentages
colsum=ct1.sum(axis=0)
colpct=ct1/colsum
print(colpct)
print()
#chi-square
print ('chi-square value, p value, expected counts')
cs1= scipy.stats.chi2_contingency(ct1)
print (cs1)
#graph percent with confidence level within each no. of friends group
seaborn.catplot(x="FrenCat2", y="Confidence", data=sub5, kind="bar", ci=None)
plt.xlabel('No. of friends')
plt.ylabel('Confidence level')
#categorising friend categories
def label(x):
if x <= 2: #1-2
return 1
elif 2 < x <= 5: #3-5
return 2
elif 5 < x <= 8: #6-8
return 3
else: #9-10
return 4
sub6["FrenCat3"] = sub3["Friends"].apply(lambda x: label(x))
recode1 = {1:1, 2:2}
sub6['COMP1v2'] = sub6['FrenCat3'].map(recode1)
#contingency table of observed counts
ct1_1=pandas.crosstab(sub6['Confidence'], sub6['COMP1v2'])
print (ct1_1)
print()
#column percentages
colsum=ct1_1.sum(axis=0)
colpct=ct1_1/colsum
print(colpct)
print()
print ('chi-square value, p value, expected counts')
cs1_1= scipy.stats.chi2_contingency(ct1_1)
print (cs1_1)
print()
recode2 = {1: 1, 3: 3}
sub6['COMP1v3']= sub6['FrenCat3'].map(recode2)
#contingency table of observed counts
ct1_2=pandas.crosstab(sub6['Confidence'], sub6['COMP1v3'])
print (ct1_2)
print()
#column percentages
colsum=ct1_2.sum(axis=0)
colpct=ct1_2/colsum
print(colpct)
print()
print ('chi-square value, p value, expected counts')
cs1_2= scipy.stats.chi2_contingency(ct1_2)
print (cs1_2)
print()
recode3 = {1:1, 4:4}
sub6['COMP1v4'] = sub6['FrenCat3'].map(recode3)
ct1_3=pandas.crosstab(sub6['Confidence'], sub6['COMP1v4'])
print(ct1_3)
print()
colsum=ct1_3.sum(axis=0)
colpct=ct1_3/colsum
print(colpct)
print()
print('chi-square value, p value, expected counts')
cs1_3=scipy.stats.chi2_contingency(ct1_3)
print(cs1_3)
print()
0 notes
Text
Analysis of variance
Null hypothesis:
Having 1 or more friends does not benefit an adolescent's mental well-being (indicated by their confidence, hopefulness, happiness and enjoyment levels).
Alternative hypothesis:
Having 1 or more friends benefits an adolescent's mental well-being (indicated by their confidence, hopefulness, happiness and enjoyment levels).
ANOVA code:

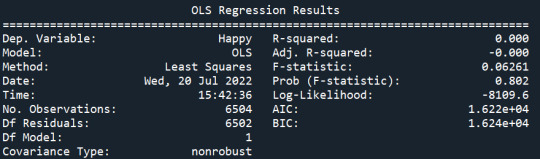
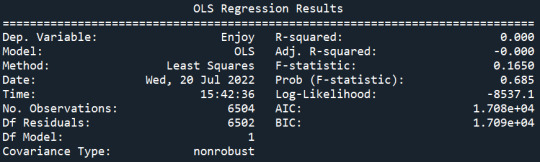
ANOVA revealed that among adolescents (my sample), those with 1 or more friends (collapsed into 5 ordered categories, which is the categorical explanatory variable) and their confidence level (categorical response variable), F (5, 6504)=0.8022, p=0.370; hopefulness level, F(5, 6404)=6.969, p=0.404; happiness level, F(5, 6504)=0.06261, p=0.802; enjoyment level, F(5, 6504)=0.650, p=0.685 were not associated.
These results suggest that there is not enough evidence to reject the null hypothesis. Adolescents with no friends were as confident (mean=1.93, s.d. ±1.17), as hopeful (mean=1.89, s.d. ±1.18), as happy (mean=2.14, s.d. ±0.926), and enjoy life (mean=2.25, s.d. ±1.00) as much as adolescents with friends (mean=1.96, s.d. ±0.997; mean=1.86, s.d. ±1.00; mean=2.14, s.d. ±0.806; mean=2.26, s.d. ±0.854).
Results:


0 notes
Text
Visualising data
The following graphs describe the different variables used in the study between having friends and a child's mental wellbeing.
The code for the univariate graphs:
#univariate graphs
sub2['Confidence'] = sub2['Confidence'].astype('category')
sub2['Hopeful'] = sub2['Hopeful'].astype('category')
sub2['Happy'] = sub2['Happy'].astype('category')
sub2['Enjoy life'] = sub2['Enjoy life'].astype('category')
sub2['Friends'] = sub2['Friends'].astype('category')
seaborn.countplot(x='Confidence', data=sub2)
plt.xlabel('Frequency where a child felt confident')
plt.ylabel('No. of children')
plt.title('Confidence frequency')
seaborn.countplot(x='Hopeful', data=sub2)
plt.xlabel('Frequency where a child felt hopeful')
plt.ylabel('No. of children')
plt.title('Hopefulness frequency')
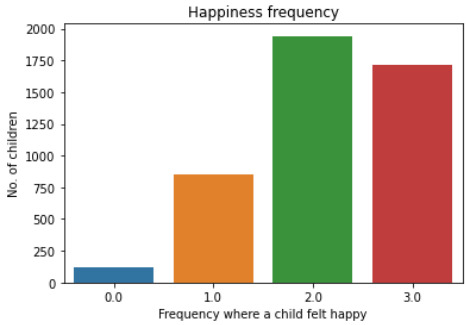
seaborn.countplot(x='Happy', data=sub2)
plt.xlabel('Frequency where a child felt happy')
plt.ylabel('No. of children')
plt.title('Happiness frequency')
seaborn.countplot(x='Enjoy life', data=sub2)
plt.xlabel('Frequency where a child enjoyed life')
plt.ylabel('No. of children')
plt.title('Enjoyment frequency')
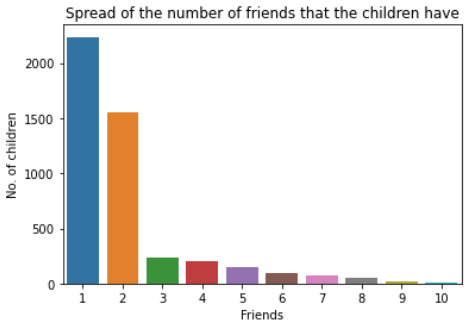
seaborn.countplot(x='Friends', data=sub2)
plt.ylabel('No. of children')
plt.title('Spread of the number of friends that the children have')
The variables were first converted to categorical types before the bar chart can be plotted.
Variable: Number of friends a child has
Code and results of variable description:
print('Descriptive statistics of the number of friends that children have:')
desc1 = sub2['Friends'].describe()
print(desc1)
Descriptive statistics of the number of friends that children have:
count 4625.000000
mean 2.020973
std 1.566640
min 1.000000
25% 1.000000
50% 2.000000
75% 2.000000
max 10.000000
Name: Friends, dtype: float64
Out of the 6504 adolescents surveyed, 4625 of them had at least 1 friend. The average number of friends an adolescent hangs out with is 2, but most of them usually hang out with 1 friend.
In the following graphs, frequency was classified as '0.0', '1.0', '2.0', and '3.0'. They represent 'never/rarely', 'sometimes', 'a lot of times', and 'mostly/all the time' respectively.
Variable: Confidence

Code: Description of confidence frequency
print("Descriptive statistics of children's confidence level:")
desc2 = sub2['Confidence'].describe()
print(desc2)
Results from code:
Descriptive statistics of children's confidence level:
count 4623.000000
mean 1.955008
std 0.988756
min 0.000000
25% 1.000000
50% 2.000000
75% 3.000000
max 3.000000
Name: Confidence, dtype: float64
The graph and statistical description suggest that most of the adolescents were confident most/all of the time but in general, the adolescents were confident a lot of the time.
Variable: Hopefulness

Code and results of descriptive stats:
print("Descriptive statistics of children's hopefulness level:")
desc3 = sub2["Hopeful"].describe()
print(desc3)
Descriptive statistics of children's hopefulness level:
count 4617.000000
mean 1.853368
std 0.973849
min 0.000000
25% 1.000000
50% 2.000000
75% 3.000000
max 3.000000
Name: Hopeful, dtype: float64
The graph and statistical description suggest that most of the adolescents were hopeful a lot of the time, and this is consistent with the adolescents on average.
Variable: Happiness
Code and results of descriptive stats:
print("Descriptive statistics of children's happiness level:")
desc4 = sub2["Happy"].describe()
print(desc4)
Descriptive statistics of children's happiness level:
count 4623.000000
mean 2.134761
std 0.799048
min 0.000000
25% 2.000000
50% 2.000000
75% 3.000000
max 3.000000
Name: Happy, dtype: float64
The graph and statistical description suggest that most of the adolescents were happy a lot of the time, and this is consistent with the adolescents on average.
Variable: Enjoyment
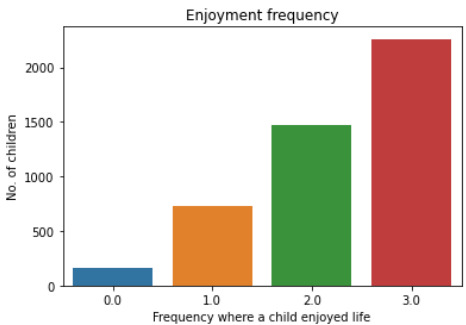
Code and results:
print("Descriptive statistics of children's enjoyment level:")
desc4 = sub2["Enjoy life"].describe()
print(desc4)
Descriptive statistics of children's enjoyment level:
count 4623.000000
mean 2.259572
std 0.850397
min 0.000000
25% 2.000000
50% 2.000000
75% 3.000000
max 3.000000
Name: Enjoy life, dtype: float64
The graph and statistical description suggest that most of the adolescents enjoyed their lives most/all of the time, but on average, the adolescents were enjoying their life a lot of the time.
Based on all the variables, the standard deviation is low (<1.0), suggesting that the adolescents' well-being does not stray too far from 'a lot of the time' for the different wellness indicators. This is a good sign as it suggests that friends are an important asset to an adolescent's wellbeing. However, 25% of adolescents lacked confidence and hopefulness despite having friends to hang out with, suggesting that other factors need to be introduced to boost their confidence and hopefulness.
Code for bivariate scatterplots:
#bivariate scatterplot
#blue plot
scat1 = seaborn.regplot(x="Friends", y="Confidence", data=sub2)
plt.xlabel('No. of friends')
plt.ylabel('Frequency')
plt.title('Scatterplot for association between number of friends and confidence')
#orange plot
scat2 = seaborn.regplot(x="Friends", y="Hopeful", data=sub2)
plt.xlabel('No. of friends')
plt.ylabel('Frequency')
plt.title('Scatterplot for association between number of friends and hope')
#green plot
scat3 = seaborn.regplot(x="Friends", y="Happy", data=sub2)
plt.xlabel('No. of friends')
plt.ylabel('Frequency')
plt.title('Scatterplot for association between number of friends and happiness')
#red plot
scat4 = seaborn.regplot(x="Friends", y="Enjoy life", data=sub2)
plt.xlabel('No. of friends')
plt.ylabel('Frequency')
plt.title('Scatterplot for association between number of friends and wellness')
Scatterplots for the variables:
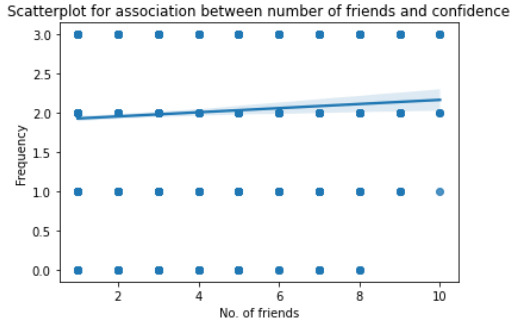
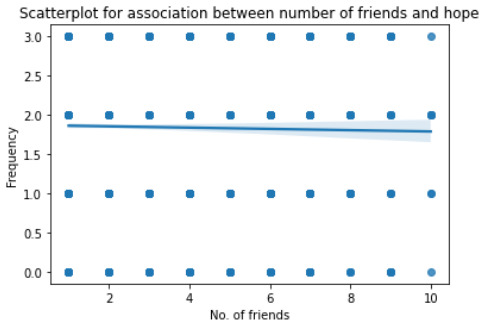

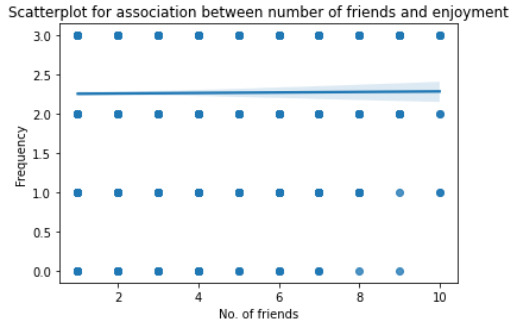
To better see the trends between the association between the number of friends an adolescent has and their well-being, the scatterplots are combined. The blue graph represents confidence; orange, hopefulness; green, happiness; red, enjoyment.

The scatterplot shows a weak correlation across all variables. Most of the variables are positively associated except for hopefulness. Combining the results from the univariate graph, the variable 'hopefulness' would be the most pressing issue to solve as adolescents are found to be less hopeful (slightly) despite having more friends. However, having more friends is good for the other wellness indicators. An external factor needs to be introduced to induce hope in adolescents.
0 notes
Text
Removing missing data
Initially, the frequency tables included responses which were less important (refused to answer or don't know).
For this assignment, I removed the less important data using Numpy's Nan code:
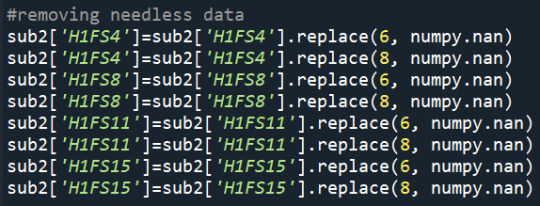
I had also renamed the variables from their initial coded names into more legible terms:

This code is used for "Happy", "Hopeful", and "Enjoy life". (Change 'Confidence' to the respective names, using their respective codes.)
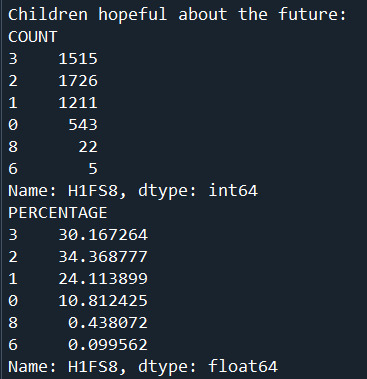
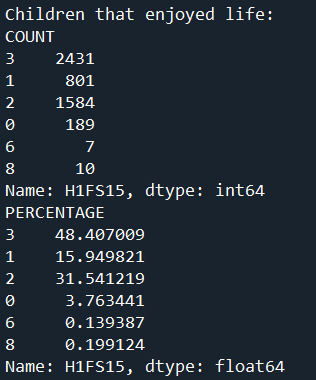
The frequency tables are as shown:


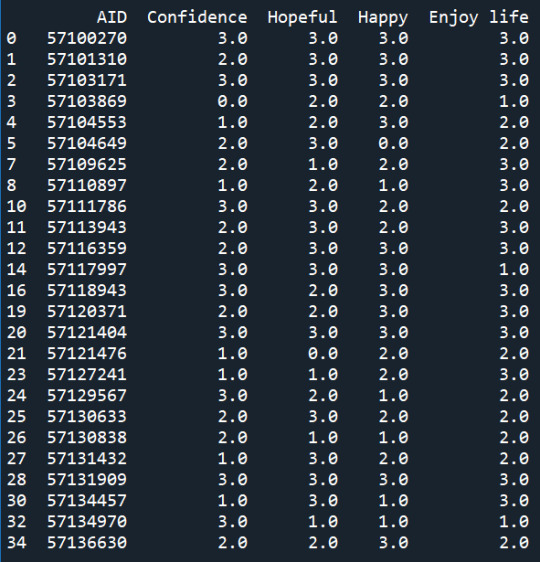
The following table shows the first 25 responses from adolescents that have at least 1 friend (for reference purposes):
From the tables, it is apparent that most children who hang out with at least 1 friend are confident (36.5%) and enjoyed their life (48.6%) almost all the time. While these adolescents' hopefulness (31.5%) and happiness (41.8%) appear less optimistic, they are still having the said feelings a lot of the time. On an even positive note, only a minute number of adolescents rarely/never felt confident (10.4%), hopeful (10.9%), happy (2.76%), and enjoyed life (3.78%).
0 notes
Text
Frequency tables (superficial analysis)
To answer the question: is hanging out with friends after school associated with positive well-being, we need to first identify the number of adolescents that hang out with 1 or more friends after school from the survey sample.
To do this, we can use enter a query in the CSV file to sort out those who hang out with at least 1 friend from those who don't, with 1 = yes, and 0 = no.
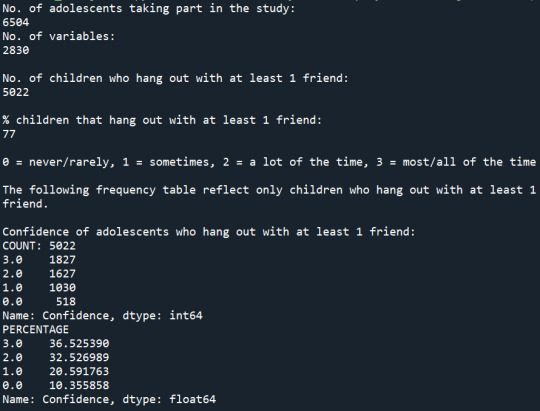
As we can see, the total number of adolescents taking part in the study is 6504.


After sorting out the adolescents, only 5022 or about 77% of the adolescents were found to hang out with friends after school.


In my research, positive well-being refers to adolescents having self-confidence, being hopeful for the future, being happy, and enjoying life.


According to the data taken, the majority (68.7%) of the adolescents who hang out with their friends feel confident about themselves a lot to all of the time. However, there are still a small number of adolescents (10.3%) who rarely/never feel confident among their own peers.
Based on the adolescents' answers to the statement: "you felt hopeful for the future", again, a large percentage of adolescents (64.5%) agreed strongly with this statement. Only about 10.8% of adolescents rarely/never felt hopeful for the future.

When faced with the statement: "you were happy", there was an even higher percentage of adolescents agreeing with the statement (78.2%), and only 2.75% of adolescents rarely/never felt happy.
Last, when the adolescents were shown the statement: "you enjoyed life", 79.4% agreed, while only 3.76% of adolescents did not enjoy life.
Based on this superficial analysis, the indicators for well-being among adolescents (self-confidence, hopefulness, happiness, and enjoyment) show that adolescents who hang out with their friends are associated with having better well-being. However, it is necessary to test an alternate hypothesis: adolescents who do not hang out with friends after school have poorer well-being.
Although minor, it is also interesting to note that a minute group of adolescents indicated that they do not know if they are happy, hopeful, etc. Due to their small numbers (consistently <1%), these responses will be generalized as negative responses.
0 notes
Text
Introduction
I have chosen the National Longitudinal Study of Adolescent Health codebook, which provides information on adolescents' health, family background and more. From the dataset provided, I formulated the following research question: is the time adolescents spend with their friends associated with their mental wellness? Based on experience, I hypothesize that spending more time with friends after school can be related to more positive well-being experienced by adolescents.
However, besides spending time with friends, there will be other factors affecting a child's well-being due to the dynamics of life. Hence, I have reviewed four pieces of literature that study different indicators of adolescent wellbeing:
Exenberger et al. (2019) found that indicators for children's well-being are multidimensional and to understand it, we need to have a composite of indicators. Well-being should be evaluated by the children themselves, wherein their participation is mandatory as they understand their needs the best. Culture can influence a child’s well-being. For example, collectivism associates “happiness with harmony and role obligations”, and individualism associates independence. Well-being in the study was assessed based on cognition, physical, psychological, social, and economic (pp. 756-7). The study found that “regardless of their cultural background, mentioned more or less identical themes of well-being: ‘academic’, ‘appreciation’, ‘interaction with biological family and caregivers’, ‘peers’, ‘coping’, ‘health’, and ‘materialism’.” Limitations of the study include a new factor of wellbeing – nature. A.k.a factors in the natural environment like natural disasters can also affect children's wellbeing.
Coverdale and Long (2014) found that children’s well-being can be enhanced in schools. A sense of belonging and community citizenship are good areas to build on when targeting children’s emotional and mental needs. Quoted various researchers’ indicators for healthy mental well-being (p. 28), such as confidence, optimism, and happiness, which make up the emotional well-being (EWB). Research also suggested that parenting plays a role in mental wellness.
Lee et al. (2020) were finding a relation between unstructured play and children’s physical, social, and emotional development (positive relation found [p. 194]). Play was found to develop life skills for children, and school is often the catalyst for play. While the paper focuses more on the conditions available for play (facilities, time etc.), the paper would be useful to provide insights into possible confounders that may affect children’s well-being besides hanging out with friends after school (that being my research topic). The ages of the children in the study ranged between 3 and 7, which is lower than what is provided in the AddHealth code book of around 11 to 20 years old.
Toshack and Colmar (2017) were finding the effects of cyberbullying on children. An association was found where the knowledge that children have regarding cyberbullying differs by gender. Gender is also related to whether children are bullied, or whether they are the perpetrator. Children’s well-being is often associated negatively with cyberbullying. However, focussing primarily on cyberbullying is redundant as children are taught strategies to combat cyberbullying. The effectiveness of the strategies remains questionable. Cyberbullying seems to be a relatively common form of bullying among children, and it can be a confounder for my research, but more secondary research needs to be done if this is to be added to the analysis.
The four pieces of literature provided insights into confounders that may skew my understanding should I find discrepancies while I analyse the datasets with regards to my chosen topic.
References:
Coverdale, G. E., & Long, A. F. (2015). Emotional wellbeing and mental health: An exploration into health promotion in young people and families. Perspectives in Public Health, 135(1), 27–36. https://doi.org/10.1177/1757913914558080
Exenberger, S., Banzer, R., Christy, J., Höfer, S., & Juen, B. (2018). Eastern and Western Children’s Voices on their Well-Being. Child Indicators Research, 12(3), 747–768. https://doi.org/10.1007/s12187-018-9541-8
Lee, R. L. T., Lane, S., Brown, G., Leung, C., Kwok, S. W. H., & Chan, S. W. C. (2020). Systematic review of the impact of unstructured play interventions to improve young children’s physical, social, and emotional wellbeing. Nursing & Health Sciences, 22(2), 184–196. https://doi.org/10.1111/nhs.12732
Toshack, T., & Colmar, S. (2012). A Cyberbullying Intervention With Primary-Aged Students. Australian Journal of Guidance and Counselling, 22(2), 268–278. https://doi.org/10.1017/jgc.2012.31
1 note
·
View note