
kitwallace
The Wallace Line
My design and development workbook
330 posts
Don't wanna be here? Send us removal request.
Last Seen Blogs

markmine
Ayena.J

healthyindiaa
Healthy Indiaa

adventureswithbill
Adventures With Bill

neptuno-blog
☠☘☠

Text
Non-Eulerian paths
I've been doing a bit of work on Non-Eulerian paths. I haven't made any algorithmic progress with the non-spiraling approach Piotr Waśniowski uses for such paths, but I'm keen to continue the development of the approach using spiral paths since I believe that this yields strong structures.
I'm using the Hierholzer algorithm to find paths in a Eulerian graph and I've been looking at the changes needed for non-Eulerian graphs, i.e. those where the order of some vertices is odd. For graphs with only 2 odd nodes, a solution is to use pairs of layers which alternate starting nodes. In the general case (Chinese Postman Problem) duplicate edges are added to convert the graph to Eulerian and then Hierholzer used to solve the resultant graph. I hadn't actually tried this before but I've now used this approach on some simple cases.
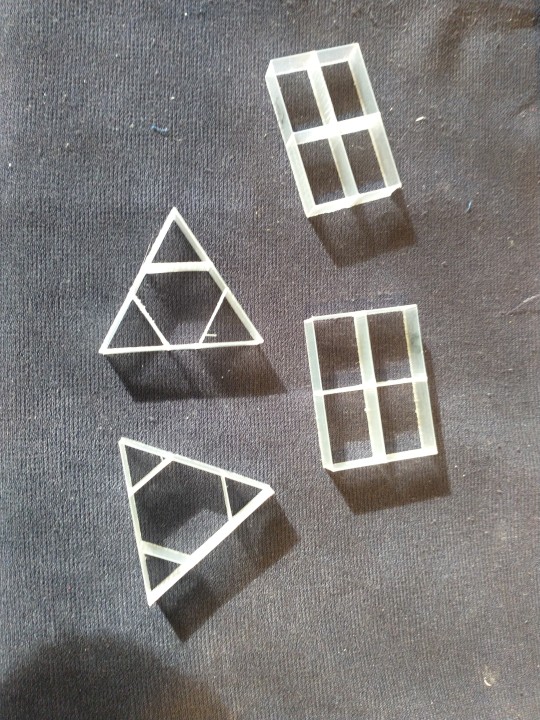
(the paths here were constructed via Turtle graphics just to test the printing - in transparent PLA)
The hard part is to evaluate the alternative ways in which the duplicate edges can be added. We can minimise the weighted sum of edges but for the rectangle this still leaves several choices and I need to think about how they can be evaluated. I think immediate retracing of an edge should be avoided so perhaps maximising the distance between an edge and its reverse would be useful.
The duplicate edges cause a slight thickening and a loss of surface quality (so better if they are interior) but I think that's a small cost to retain the spiral path. Path length for the rectangle is 25% higher I haven't tried them with clay yet.
Modifying Hierholzer
I had originally thought that to formulate such graphs for solution by Hierholzer, each pair of duplicate edges would require an intermediate node to be added to one of the edges to create two new edges. This would be the case if the graph was stored as an NxN matrix, but my algorithm uses a list of adjacent nodes, since this allows weights and other properties to be included. Removing a node from the matrix is much faster (just changing the entry to -1) than removing the node from a list but for my typical applications efficiency is not a big issue. The list implementation requires only a simple modification to remove only the first of identical nodes. This allows duplicate edges to be used with no additional intermediate nodes.
This is test interface for the Hierholzer algorithm which accepts a list of edges.
Here is an example with three hexagons:

with graph
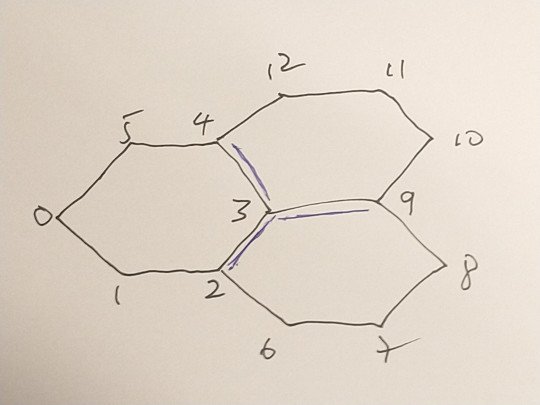
and edge list:
[ [0,1],[1,2],[2,3],[3,4],[4,5],[5,0],
[3,2],[2,6],[6,7],[7,8],[8,9],[9,3],
[3,9],[9,10],[10,11],[11,12],[12,4],[4,3]
]
Nodes 2,3,4 and 9 are odd. There is only one way to convert to Eulerian. We need to duplicate three edges : [3,4], [3,9],[3,2] so that nodes 4,9, and 2 become order 4 and node 3 becomes order 6. The path used to generate the printed version above was constructed as a Turtle path with only 60 degree turns:
[3, 9, 10, 11, 12, 4, 3, 2, 6, 7, 8. 9, 3, 4, 5, 0, 1, 2]
Hierholzer constructs the following path starting at the same node
[3, 2, 1, 0, 5, 4, 3, 2, 6, 7, 8, 9, 3, 9, 10, 11, 12, 4]
There is a sub-sequence [9,3,9] which indicates an immediate reversal of the path. This creates the possibility of a poor junction at node 3 and is to be avoided.
Furthermore, this path is the same regardless of the starting point. The choice of which edge amongst the available edges from a node at each step is deterministic in this algorithm but it could be non-deterministic. With this addition, after a few attempts we get :
[0, 1, 2, 3, 9, 10, 11, 12, 4, 3, 2, 6, 7, 8, 9, 3, 4, 5]
with no immediately repeated edges
This provides a useful strategy for a generate-test search: repeatedly generate a random path and evaluate the path for desirable properties , or generate N paths and choose the best.
However, this approach may not be very suitable for graphs where all nodes are odd, such as this (one of many ) from Piotr:
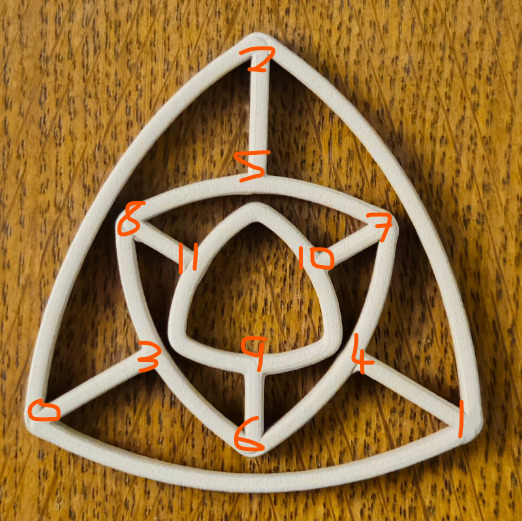
The edge list for this shape is
[0,1],[1,2],[2,0],
[0,3],[1,4],[2,5],
[3,6],[6,4],[4,7],[7,5],[5,8],[8,3],
[9,10],[10,11],[11,9],
[6,9],[7,10],[8,11],
duplicate the spokes
[0,3],[1,4],[2,5], [6,9],[7,10],[8,11]
Here every node is odd. The 6 spokes are duplicated. Sadly no path without a reversed edge can be found.
The simpler form with only two triangles and 3 duplicated spokes:
[ [0,1],[1,2],[2,0],
[0,3],[1,4],[2,5],
[0,3],[1,4],[2,5],
[3,4],[4,5],[5,3]
]
does however have a solution with no reversed edges although it takes quite a few trials to find it:
[0,2,5,4,1,2,5,3,0,1,4,3]
Triangles
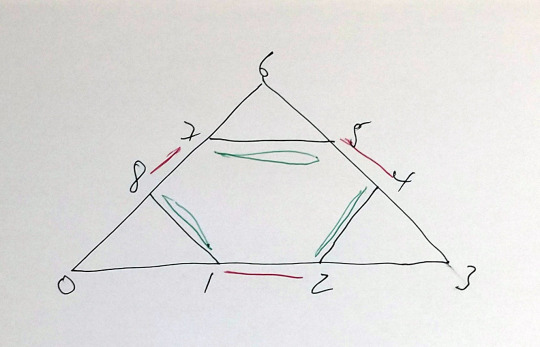
Edges can be duplicated in two ways
[[0,1],[1,2],[2,3],[3,4],[4,5],[5,6],[6,7],[7,8],[8,0]
,[2,4],[5,7],[8,1]
a) duplicating the interior edges min 4
[2,4],[5,7],[8,1]
b) duplicating the exterior edges min 6
[1,2],[4,5],[7,8]
Rectangle
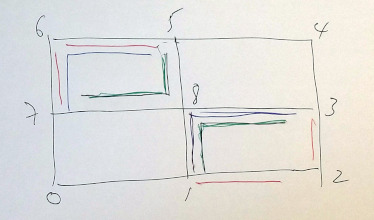
Edges can be duplicated in three different ways
[0,1],[1,2],[2,3],[3,4],[4,5],[5,6],[6,7],[7,0],
[1,8],[3,8],[5,8],[7,8],
a) [1,2],[2,3], [5,6],[6,7] min 6
b) [1,8],[8,3], [5,6],[6,7] min 4
c) [1,8],[8,3], [5,8],[8,7] min 4
To be Done
In these examples, the duplication of edges was done 'manually' . The multiple possible configurations need to generated algorithmically.
Postscript
A side-benefit of this work has been that I've finally fixed an edge case in my Hierholzer algorithm which has been bugging me for some years
0 notes
Text
More Turtle shapes
I've come across some classic curves using arcs which can be described in my variant of Turtle Graphics.
Arbelos
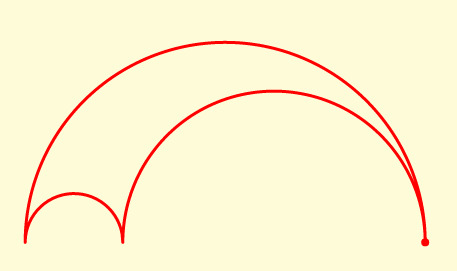
L 180 20,L 180,R 180 4.88,L 180,R 180 15.12
A single parameter determines the proportion of the radius of first concave arc to the radius of the convex arc.
Salinon
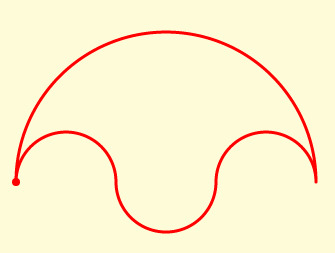
L 180,R 180 20,L 180 20,R 180 20,L 180,L 180 60
This family uses two parameters for the proportions of the radius of two of the small arcs. Here they are all equal radius.
Lens
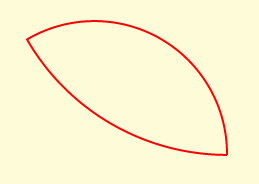
L 89.5,L 121 50,L 89.5,L 60 87.03557
Lens defined by the Angles of the two convex arcs.
Lune
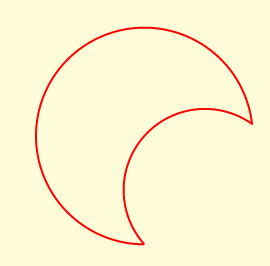
L 112,R 136 45,L 112,L 272 60
This family is determined by two parameters: the ratio of one of the circles to the other and the ratio of their separation.
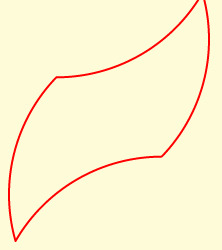
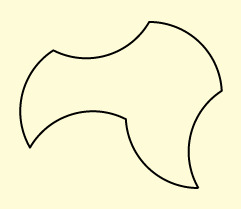
Arced Squares
The sides of a square can be replaced by convex or concave arcs to produce 6 different tiles. Here the arc length is 60 degrees.
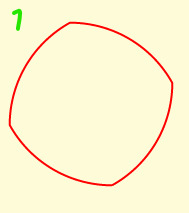
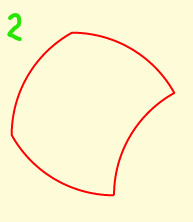
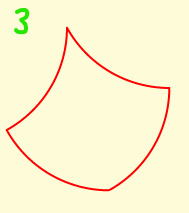
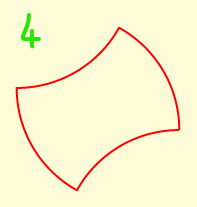
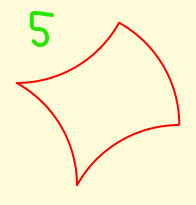
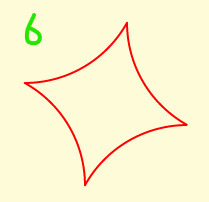
Tiles 3 and 4 each have equal numbers of concave and convex arcs. 3 tesselates, 4 tesselates with rotation. Tiles 1 and 6 tesselate together, having between them equal numbers of concave and convex arcs.
Tile 3 is a classic shape often used in quilting, going under various names: seashell, clamshell,fishscale - see Barbara Brackman's post. Barbara also shows examples of Tile 4 , called a dumbell or apple core.
The square can be varied to a rhombus with the same tesselation properties, eq tile 4 :
and the ratio of the two pairs of opposite sides can be varied to create asymetric tiles:

Ref
TurtleArt https://www.turtleart.org/ a visual programming language with the same extension of an arc as used here. It includes a GoTo command to move the turtle without drawing. [email protected]
Clarissa Grandi runs classes on designing with arcs https://linktr.ee/ClarissaGrandi https://twitter.com/c0mplexnumber
1 note
·
View note
Text
My father in Tairua
My father in Tairua in 1929. Paku is in the background.
My father, Francis Brabazon Wallace came out to New Zealand aged about 18. He worked on the Cory-Wright farm so the photo probably taken from the homestead. However the photo shows a different aspect of Paku, perhaps from along what is now Ocean Beach road.

and this we believe is his horse Karl:
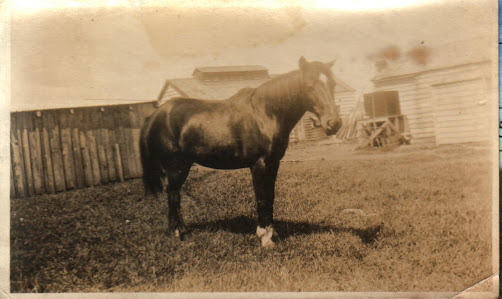
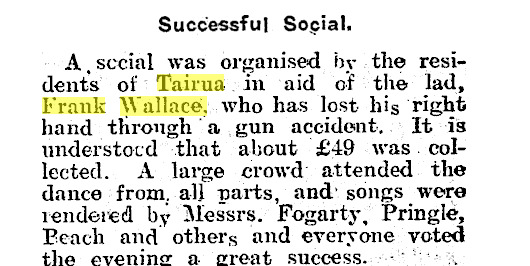
which I hold is responsible for my (and my brother's) existance. Karl trod in a pot hole on the beach, throwing my father to the ground and dragging him. Not hurt but his right hand was numbed. A couple of days later he was out in the bush on Karl with a shotgun looking for a hawk which had been savaging sheep. He'd put the gun on the scrubby ground and as he was watching it, he picked up the gun , with his numbed hand and unfortunately by the muzzle, the trigger caught on scrub and the gun went of, shattering his right hand. He was able to get back to the homestead and a harrowing trip over the range to Thames and hospital where his hand was amputated. Being under age, his guardian Dr John Campbell Duncan would not undertake a disabled man so he was packed off back to Britain and an all-together different life.
I wondered if there was anything about the incident in the newspapers at the time and there is a very good archive of New Zealand newspapers. However I could find nothing on the accident itself - perhaps such accidents were commonplace - but I did find this report of a dance to raise funds for him in the Thames Star, Volume LXIII, Issue 17665, 5 July 1929, Page 4
Cory-Wright
The Cory-Wrights came from Hornsea in Yorkshire and a son Silston was an engineer who founded Cory-Wright and Salmon.
Historical photo
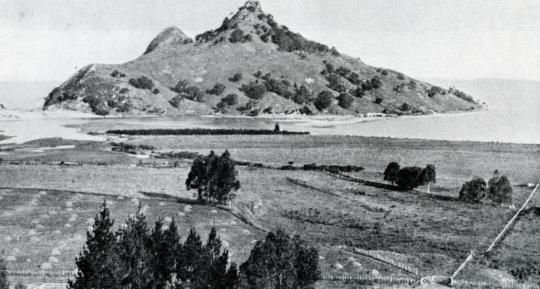
A friend found this photo of Paku from about the time my father was there. The aspect is similar to the one in my father's photo, but higher up.
New Zealand - A picturesque coast farm at Tairua on the East Coast of the North Island - 16 Feb. 1928 - Photo from The Weekly News
References
Newspaper archive https://paperspast.natlib.govt.nz/newspapers?
Tairua History Trail https://www.tairua.co.nz/tairua-history-trail
Silston Cory-Wright https://teara.govt.nz/en/biographies/4c37/cory-wright-silston
Ancestors https://ancestors.familysearch.org/en/LJLS-J52/silston-george-cory-wright-1888-1973
Tairua Aural History Project https://natlib.govt.nz/items?i[collection_any_id]=471141&i[-category]=Groups
Interview with Derek CW https://natlib.govt.nz/records/35854303?search%5Bi%5D%5Bsubject_text%5D=Wright+family&search%5Bpath%5D=items
Ohinemuri Regional History Journal https://ndhadeliver.natlib.govt.nz/webarchive/20140721120545/http://www.ohinemuri.org.nz/journal/n.09.htm See article Tairua before the roads came by Phyllis CW
Short biography of Phylis CW http://www.ohinemuri.org.nz/journals/35-journal-9-may-1968/544-our-contributors
Jewel by the Sea by Phyllis CW https://www.abebooks.com/first-edition/Jewel-Sea-Memories-Tairua-Coromandel-Cory-Wright/1196224631/bd
Dr John Duncan Campbell https://collections.tepapa.govt.nz/agent/60427
0 notes
Text
"Characters" a Scroll Saw Project
Now that the Delta Scroll saw is working, I was looking for a project to build up my skill. Large characters make for good practice objects and I've used LibreOffice to print large font versions. However, for scrolling , the character outline is much better to use than a solid figure and I'd also like to try some interesting Unicode characters.
So I wrote a small script which allows you to input a character, either as itself, or as the UTF8 code sequence, a font size and family and generate the character outline in SVG .
So entering the UTF-8 sequence 0xD7 0x90 (found on this useful site) creates a large version of the Hebrew character Aleph

A simple curve with no holes looks good for a practice piece. Printed and glue-sticked to Blue masking tape applied to the wood provides the template for cutting.

First attempt and it shows|
Characters like Aleph are more than just functional parts of a script. Printed large they become objects which can be read in other ways- Aleph as a cat or the sphinx maybe? This gave rise to a small project called "Characters" or "characters with character". The huge range of glyphs in the Unicode is a fertile source of more Characters - like the Cherokee letter S 0xE1 0x8F 0x8D which clearly depicts a kind of bicycle.

Trawling through 150,000 candidates is going to take a while. Send suggestions please!
Text to Path
It would be good to be able to convert these Text characters to a path for 3D printing, but that seems to be quite difficult to achieve. I haven't found a good way to do this yet.
0 notes
Text
Delta Scroll saw
I bought a scroll saw from the Hackspace where it was surplus equipment. There were two in an auction, both quite old and litlle used. I won one of them for £15 and chose the Delta model since it was the heavier and had a dust blower.
The model is 40-430, single speed. There is a manual for it on-line https://www.manualslib.com/manual/590720/Delta-40-530.html
The machine takes pinless blades of which I already had a few. Pinless blades are finer and come in greater variety than pined blades, which are faster to change. There is a custom tool for blade changing, with a long 4mm Allen key attached to a bar which slots into a hole on the blade holder, setting the key in the right position and locking the hinged holder. It was missing and its fiddly to change blades without, so I need to make a substitute.
Surprisingly the blower works - online advice says the bellows is usually perished.The connecting tube is stiff and should realy be replaced.
At first the machine was very rattley until I realized the the three bolts put though the holes in base were only needed if the machine was going to be permanently fixed to a bench. Much better without and its heavy enough to be stable although it would be better with rubber feet.
Once I'd attached a blade and got the tensioning right, I turned it on and it cut fine and true.
The saw was very dusty and hadn't been used in a while. I took it apart, happy to find all fittings were metric.

A few jobs to do:
free up the table so it tilts
lubricate the pivot bolts
remove the rusty table, sand and polish with wax
(x)replace gnarled cover screws
(x)replace worn blade holder socket head bolts
make the blade change tool with long hex 4mm tool (x) and 5mm threaded (x) bar with 3D-printed spacers
add rubber feet 12mm hole eg https://www.ebay.co.uk/itm/133246278952
x Bits ordered 28/01 £12.50
Blade change tool
I designed a spacer in OpenSCAD to align the long Allen key and a threaded guide bar with M5 nuts to hold it in place. Took a few iterations to get the sizing right but it works fine with three spacers, using lock nuts to fix the spacers in place. The OpenSCAD and STL files are on Thingiverse https://www.thingiverse.com/thing:6460819

Anti-vibration feet
Commercial mounts are surprisingly expensive so I made my own. I had a lot of large tap washers in stock so I made up a stack of one dished and two flat washers below the base, two more flat washers and a metal washer above the base, held together with an M8 coach bolt and nut. This works very well and the saw runs pretty quitely now.

The table
I sanded and oiled the table and it's much improved. Car polish is recommended so I'll do that.
Tilt lock handle
Now that the table has been freed up, the locking mechanism comes into play. It is an M6 bolt with a handle moulded onto it, but the moulding has failed so it can't be fully tightened. Fortunately, it also takes a 3mm Allen key and doesnt need to be adjusted quickly.
Looking better

1 note
·
View note
Text
Moisture sensor development - 2022/23
Multiple sensors have been running over winter 22 to summer 23 and some problems have arisen:
One temperature sensor stopped functioning but in a way that eluded the error detection. The symptom was that the two sensors showed exactly the same measurement. This turned out to be a configuration issue, where both sensor were mapped to the same temperature.
Battery life was too short on a couple of sensors. This may be because of poor quality batteries, poor connections in the battery holder or due to excess drain somewhere. After experimentation with better quality batteries (Samsung 25R rated at 2500 mAh) it seems the main problem is poor quality batteries.
Moisture sensors losing discrimination. On a new sensor the range from wet to dry is typically 900 but this reduced to 270. I found that cleaning off the old silicon sealant, cleaning the board and resealing brought the readings back to normal.
Moisture sensor connection. The waterproofing with silicon and the JST connector are a poor design. Securing this connector with a zip tie helps to secure this connector.
Rusty main board. One device failed due to rust getting into the pins and socket on the main board connector. This is evidence of moisture in the device container. The sensor cable entrance is sealed with a large amount of silicon sealant which often fails. However when a second device also failed, having drained new , quality batteries very quickly, it seems that the idea of using socket strips on an outdoor device, however well sealed, is a mistake. In any case the board and the chip are really the only significant components so they may as well be soldered together.
One sensor on a public Tiny Forest was stolen. This despite being well - hidden and having a notice inside the box explaining the scientific purpose of the device.
I had considered changing the design of the PCB to avoid the use of a ground plane since I found this made soldering to ground terminals difficult and poor connections created problems. On reflection, my problem is probably insufficient thermal inertia in my small iron and the use of a better, temperature-controlled iron would solve this issue whilst retaining the benefits of a ground plane.
Labels printed on a label printer fade very quickly in sunlight.
An error in the code for the test phase meant that sleep time could be negative with odd results.
It has been suggested that over-the-wire updating of the code should be implemented but I am concerned about the current demand,
Improvements
Have a working set of all three sensors which can be plugged into a device to check the cause of a failed sensor.
Replace the cheap 18650 batteries with Samsung 25R flat top batteries.
Solder the chip directly to the PCB instead of using a socket strip
Develop a better sealing system for the cable entry.
Use a chinagraph pen for labeling
Reconsider strategy for protecting devices in public places
3 notes
·
View notes
Text
BNG4.0 : Where was the ontologist?
One aspect of the Natural England Biodiversity Metric 4.0 Metric tool which has surprised me is the lack of a consistent vocabulary for parts of the model. There is a list of Key terms and definitions in Table 2-1 of the User Guide such as Habitat Type and Broad Habitat but naming in a complex data structure needs to go beyond that.
Naming is acknowledged to be one of the hard problems in software development and it is good practice to devise and document a vocabulary for the key concepts. Judging by the lack of consistency in column labels, no such vocabulary was agreed. Thus major and minor differences (such as case use) in naming occur:
Broad Habitat and Habitat Type
The column name for the broad groups of Habitat like 'Cropland' and 'Grassland' are variously:
Habitat table -no separate column, just a prefix in 'Labeling column'
A-1 Onsite Baseline Habitat - 'Broad Habitat'
A-2 Onsite Baseline Habitat Creation - 'Broad Habitat'
D-1 Offsite Habitat Baseline - 'Broad habitat'
G-2 All Habitats - 'Group' and 'Habitat Group'
Likewise for the Habitat Type within a Broad Habitat like 'Bracken' or 'Lowland calcareous grassland'
G-1 All Habitats - Column is unlabeled
A-1 Onsite Baseline Habitat - 'Habitat Type'
A-2 On-Site Habitat Creation - [Proposed] Habitat
A-3 On-Site Enhancement - [Baseline] Habitat, [Proposed] Habitat
Names of Habitat (Type) are in fact unique, but in most places it is redundantly combined with Broad Habitat into a compound label 'Broad Habitat' - 'Habitat Type' but even this combination has no consistent name:
Habitat table -'Labeled column'
G-8 Description lookup - Habitat Description
G-1 All Habitats - 'Labeling column'
G-2 All Habitats - Habitat Description, Habitat Group
G-3 Multipliers - Habitat Description
G-5 Enhancement Temporal - Habitat
Although the User Guide uses the term 'Habitat Type' for the detailed Habitat characterization, I've chosen to use the terms 'Broad Habitat' and 'Habitat' in my vocabulary.
Habitat and Parcel
The term Habitat is also used to name tables such as A2-Habitat_Baseline. However the rows of this table and similar tables are not Habitats but Parcels, defined in the User Guide as "A linked area of habitat with the same distinctiveness, condition and strategic significance". This means that parcels with the same Habitat need to be aggregated for Habitat analysis. However the term 'parcel' is not used anywhere in the calculator so this distinction is not explicit.
Biodiversity Units
The naming of the units in which the BNG value of a parcel is measured is generally called 'Units' but in some places, the term 'Value' is used ( in G2-Habitat Groups).
Planning phases
The method calls for the evaluation of the existing site and for the site (and off-site parcels ) after development. The terminology for these two phases of the project is mixed.
The User guide uses the terms Baseline and Pre-development for the first phase and Post-development for the second phase. In tables such as A2-Habitat_Baseline, the term 'Baseline' is used for Pre-Development while 'Proposed' is used for Post-Development. In the summary tables such as G2-Habitat Group, the term 'Existing' is used for Pre-development
Conclusion
This lack of consistency in naming makes comprehension of the BNG 4.0 Metric calculator and its alignment with the User Guide more difficult but it is also a symptom of a lack of underlying design (or redesign of a prototype) during software development.
4 notes
·
View notes
Text
BNG4.0 : The saga of a single cell
Oct '23 - symbol ~ replaced with the more explicit $self/
Implementation of the BNG4.0 spreadsheet calculator in XML and XQuery requires the translation of multiple formula expressed in Excel language. This is time-consuming process as shown in this example of one column of one table.
The formula of interest is in cell T12 of Sheet A-3 On-Site Habitat Enhancement. The heading is Distinctiveness Change.
I discovered I could copy the formula by double-clicking the cell [previously I'd tried to copy the text in the entry field but couldn't because it was locked]
=IF(E12="","",IF(AND(LEFT(O12,6)="Same d",I12>X12),"Error - Trading rules not satisfied ▲",IF(AND(LEFT(O12,6)="Same b",AND(LEFT(F12,5)<>LEFT(S12,5),I12>X12)),"Error - Trading rules not satisfied ▲",IF(AND(LEFT(O12,6)="Same h",F12<>S12),"Error - Trading rules not satisfied ▲",IF(AND(LEFT(O12,6)="Bespok",F12<>S12),"Error - Trading rules not satisfied ▲",IF(X12<I12,"Error Trading Down ▲",H12&" - "&W12))))))
Decoding the cell references and replacing them with names used in the XML version of this table, we get
=IF(~Ref="","",IF(AND(LEFT(~Baseline_Required_Action,6)="Same d",~Baseline_Distinctiveness _Score> ~Proposed_Distictiveness_Score),"Error - Trading rules not satisfied ▲",
IF(AND(LEFT(~Baseline_Required_Action,6)="Same b", AND(LEFT(Baseline_Habitat,5)<> LEFT(~Proposed_Habitat,5),~Baseline_Distinctiveness_Score > ~Proposed_Distictiveness_Score)),"Error - Trading rules not satisfied ▲",
IF(AND(LEFT(~Baseline_Required_Action,6)="Same h",~Baseline_Habitat <> Proposed_Habitat),"Error - Trading rules not satisfied ▲",
IF(AND(LEFT(~Baseline_Required_Action,6)="Bespok",~Baseline_Habitat <> Proposed_Habitat),"Error - Trading rules not satisfied ▲",
IF(~Proposed_Distinctiveness_Score < Baseline_Distinctiveness_Score ,"Error Trading Down ▲",concat(Baseline_Distinctiveness ," - " , ~Proposed_Distinctiveness)))))))
The use of LEFT() here fulfills two roles: to save testing the whole text of Required Action and to partially extract the Broad Habitat from the compound Broad Habitat - Habitat column used in the spreadsheet.
The required actions is taken from the Trading Notes of the baseline habitat which has the same set of values as Distinctiveness.
Bespoke compensation likely to be required
Same habitat required
Same broad habitat or a higher distinctiveness habitat required
Same distinctiveness or better habitat required
Compensation Not Required
Even with the addition of meaningful names, the code is still difficult to understand. One reason is that this formula either reports a failure to satisfy trading rules or the change in distinctiveness if trading rules are satisfied. These purposes are really independent and it is clearer to break the column into two- one to show the change in distinctiveness, the other to validate the trading rules.
The second reason is that the tests are for the failure of a rule rather that its success. For example, the test for the Required_Action "Same broad habitat or a higher distinctiveness habitat required"
is tested by the condition
AND(LEFT(Baseline_Habitat,5) <> LEFT($self/Proposed_Habitat,5),$self/Baseline_Distinctiveness_Score > $self/Proposed_Distinctiveness_Score))
that is
(Baseline_Broad_Habitat <> $self/Proposed_Broad_Habitat) and ($self/Baseline_Distinctiveness_Score >$self/Proposed_Distinctiveness_Score)
but its not immediately obvious that this is the negation of the rule which can be tested directly by the condition
(Baseline_Broad_Habitat= $self/Proposed_Broad_Habitat) OR($self/Baseline_Distinctiveness_Score < $self/Proposed_Distinctiveness_Score)
or better still since it is the Proposed Habitat which is being checked
(Proposed_Broad_Habitat= $self/Baseline_Broad_Habitat) OR ($self/Proposed_Distinctiveness_Score > $self/Baseline_Distinctiveness_Score)
which can now be easily seen to be a formal version of the rule itself.
If it is necessary to test for the failure of the rule, it is better to negate the rule :
Not (Proposed_Broad_Habitat= $self/Baseline_Broad_Habitat) OR ($self/Proposed_Distinctiveness_Score > $self/Baseline_Distinctiveness_Score)
The following XQuery expression is used as the compute rule in the model for validating the Trading rule:
if ($self/Baseline_Required_Action = "Bespoke compensation likely to be required")
then if ($self/Proposed_Habitat = $self/Baseline_Habitat) then "OK" else "Error - Trading rules not satisfied"
else if ($self/Baseline_Required_Action = "Same habitat required")
then if ($self/Proposed_Habitat = $self/Baseline_Habitat) then "OK" else "Error - Trading rules not satisfied"
else if ($self/Baseline_Required_Action = "Same distinctiveness or better habitat required")
then if ($self/Proposed_Distinctiveness_Score >=$self/Baseline_Distinctiveness_Score) then "OK" else "Error - Trading rules not satisfied"
else if ($self/Baseline_Required_Action = "Same broad habitat or a higher distinctiveness habitat required")
then if ($self/Proposed_Broad_Habitat =$self/Baseline_Broad_Habitat or $self/Proposed_Distinctiveness_Score > $self/Baseline_Distinctiveness_Score) then "OK" else "Error - Trading rules not satisfied"
else if ($self/Baseline_Required_Action = "Compensation Not Required") then "OK"
else concat("Error - Unknown Required action: ", $self/Baseline_Required_Action)
For traceability, it is good to be able to reference this calculation back to section 5.2 of the User Guide. However, because this document is provided only as a PDF and not an HTML document, it is not possible to provide a direct deep link into this part of the document.
Sadly, traceability doesn't seem to be possible for all computations in the spreadsheet. I am unable so far to trace the very next field which validates changes to Habitat_Condition.
Of course we have to trust (or laboriously check) that the same formula adjusted for position is used on all cells in the same column and in the Off-Site version of the sheet.
XQuery language
Although the XQuery language will be unfamiliar to many, this code is likely to be readable by most computer literate folk. This is partly due to the more natural English expressions used - 'let' , 'and' 'or' with '=' having its usual meaning, but perhaps comprehensibility is in the eye of the beholder.
Oct '23
On refection, rather than allowing a free choice of options and then validating that choice, it would better to restrict the available options in the first place. This also allows acceptable options to be seen. Validation is still needed however if data is imported from other sources.
5 notes
·
View notes
Text
Circle designs
From a Mastodon toot "This is how a real data scientist drinks coffee"

The image is by Javier Jaén. It looks very real but it must be computer-generated. I wondered if I could make it real and used my work on Eulerian circuits to create a spiral-printed version (sans handles). Intersecting circles create a Eulerian circuit since every intersection is even, but the path is not so obvious. The code in JavaScript computes the intersections and the arcs between intersections, constructs a graph and uses the Hierholzer algorithm to find a path.
This is the Gcode generated from Fottery
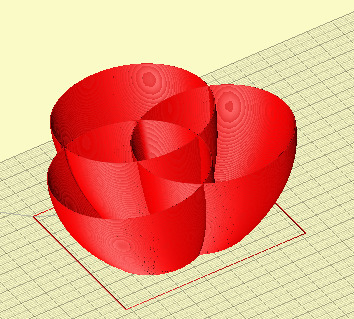
and here printed in white PLA
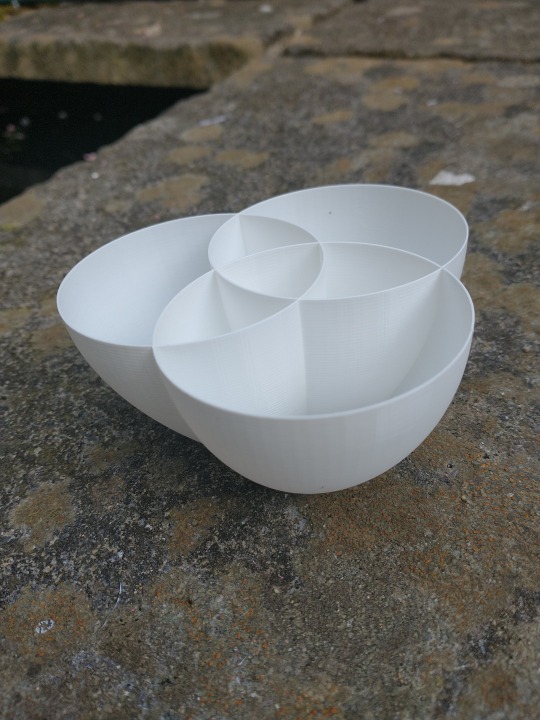
The cup profile is adapted to make it easier to print.
Next step is to make it in ceramic.
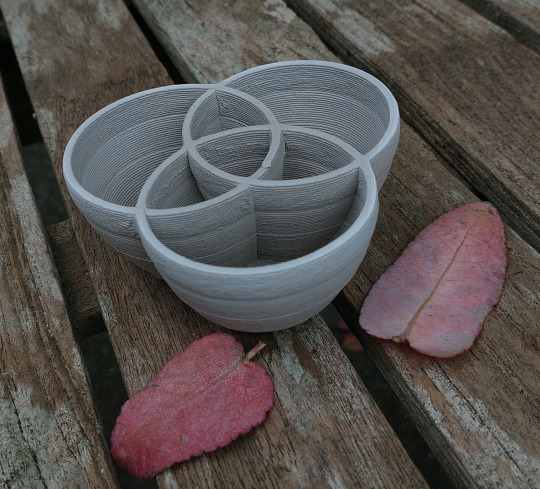
Printed in a stoneware clay on my Eazao Zero. Not as prefect as the computer-constructed image, just as useless as a cup but it is a real object (and will look better once fired and glazed).
2 notes
·
View notes
Text
The 'Spectre' monotile
The recently discovered Hat and Turtle monotiles needed to use a reflected version of the tile in aperiodic tiling and this seemed a bit untidy. Although I had used OpenScad to generate the continuum of tiles from Comet to Chevron via Hat, I hadn't appreciated that 'Turtle' lay in the continuum and created a separate continuum for that tile with a different perimeter. Doh!
In my parametrisation, the continuum is generated by varying the kite semi-angle A from 0 to 90, with the two side lengths respectively a=cos(A) and b=sin(A) .
This OpenSCAD function generates the tile perimeter for a given angle A:
function monotile(r,A) =
// r is the radius of the base hexagon
// returns perimeter as a sequence of [side,internal angle]
let (a = r * cos(A) ,b = r * sin(A) )
[[a,180],[a,120],[a,270],[b,120],[b,90],[a,120],[a,270],[b,120],
[b,90],[a,240],[a,90],[b,240],[b,90],[a,120]];
where these are the special case (together with the Smith et al parameterisation)
A=0 : Chevron Tile(0,1)
A=30 : Hat Tile(1, sqrt(3))
A=45 : Equilateral Tile (1,1)
A=60 : Turtle Tile(sqrt(3),1)
A=90: Comet Tile(1,0)
It turns out (that phrase covers a huge amount of work described in the most recent paper) that the Equilateral tile (A=45) is quasi-aperiodic in that it is aperiodic only if reflections are forbidden.
To modify the tile to prevent reflections, one approach is to replace the straight sides with arcs which alternate left and right. Since the tile is equilateral (noting that the long side is composed of two co-lateral short sides) , a common arc angle yields arcs of common curvature
It's easy to see how the resultant tile got its nickname 'Spectre'

although we might be calling it 'Elephant' if the arcs had been oriented in the opposite direction:

This version of the tile was generated from the perimeter by a JavaScript tool developed for ceramic design which uses a form of Turtle language. It's the 'Spectre' function in the list of functions. The Arc angle here is 90 degrees.
OpenSCAD
The online tool generates the perimeter as a sequence of points, intended for copying into the Fottery tool to create the Gcode to print ceramic objects. The sequence is in the same format as that used to define a polygon in OpenSCAD so a minimal script looks like:
thickness=4;
perimeter = {paste the sequence here };
linear_extrude(height=thickness)
offset(delta=-1)
polygon(perimeter);
[I should really implement this version of the Turtle language in OpenSCAD so resolution is determined in the OpenSCAD script]
The negative offset here allows for slightly excess filament width in a 3D printed part. (you still have to clean off any 'elephants foot'). Offset would be positive for laser-cutting to allow for the kerf.

Diversion
The JavaScript tool also generates arced versions of the other tiles in the continuum from Comet to Chevron. These two periodic tiles are also equilateral so all sides have the same curvature. These are rather pleasing shapes to use for tesselation:
The number of sides is 8 for the Comet, 6 for the Chevron, corresponding to the 8 a sides and 6 b sides in the common perimeter.
Further reading
'A chiral aperiodic monotile' David Smith, Joseph Samuel Myers, Craig S. Kaplan, Chaim Goodman-Strauss https://arxiv.org/abs/2305.17743
Aperiodical : Now that's what I call an aperiodic monotile
Craig Kaplan -Mastodon Thread
Craig Kaplan : Blog
0 notes
Text
An executable model for Biodiversity Net Gain 4.0
Natural England published the latest version of the Biodiversity Metric - BNG 4.0 in April 2023. It remains under continuing review. BNG 4.0, possibly amended, is likely to become mandatory when the remaining parts of the Environment Act 2021 come into force towards the end of the year. It is a very comprehensive suite of documents with supporting tools designed to aid in the calculation of biodiversity net gain.
A full baseline habitat analysis for a proposed development together with the proposed habitat changes requires the gathering, organisation and processing of a large amount of data. A macro-enabled Excel spreadsheet has been provided in the package, which is expected to be used widely, if not exclusively, for nearly all BNG calculations. Spreadsheets are, however, inherently difficult to comprehend, check and test.
This project is an attempt to provide an open source online tool to perform the same analysis which is comprehensible, checkable against the BNG guidance and testable.
Spreadsheets
Wonderfully useful though spreadsheets are, they do have some major downsides.
Unreadable Formula
Computation is defined using expressions which reference cells or ranges of cells by sheet name and cell address. There are mechanisms for giving cells meaningful names, but these are rarely used and not used in the BNG spreadsheet. This renders the spreadsheet very difficult to read and check without extensive navigation around multiple sheets and sub-tables embedded within sheets. Even then the meaning of the cells has guessed from column and row labels which themselves are mere descriptions rather than having any semantic value.
Macros and hidden columns further limit comprehension.
Lack of a coherent model
Because data and computation are interleaved within a spreadsheet, there is no separation of data from its processing and hence no guarantee that the same kind of data (all the rows in a table) will be computed in the same way.
Lack of a test strategy
Software engineering has developed strategies for enabling repeated testing of software so that the whole system can be re-tested after a minor change has been made which may have unforeseen consequences. Test-driven development goes further and requires test data and the results expected from that data to be created before development so that the behavior can be developed and tested incrementally. Although there are specialist tools such as Rapise which can assist with spreadsheet testing they are expensive.
Readability and testing are important because industry experience shows that an overwhelming number of operational spreadsheets have faults which, in some cases, has led to disastrous consequences for their users. Clearly, a tool which supports legislation should be provably correct.
As the computer scientist Tony Hoare said:
“There are two ways of constructing a software design: One way is to make it so simple that there are obviously no deficiencies, and the other way is to make it so complicated that there are no obvious deficiencies. The first method is far more difficult.”
In this project we strive for simplicity.
A conceptual data model
A Entity-Attribute-Relationship (EAR) conceptual model captures the structure of the data in an information system. EAR models are typically used with Relational Databases which are composed of multiple inter-dependent tables.
Tables (such as the Habitat table in BNG 4.0 which list the 132) are conceptualized as Entities which define the common properties of every row in the table, i.e., every instance of the entity. The main part of this definition is the list of fields in the record which can be thought conceptually as attributes of the entity. Each attribute describes the type of values which can be held in the field, the permitted and default values and whether it is mandatory or optional. Relationships describe how one entity is related to another, typically by common attributes.
An executable conceptual model
An executable model is an extension of a data model which in addition defines the rules for computing attributes which are not raw data. In the software engineering approach, Model-Driven Development, such models can be used to generate the compiled software. For this project, the rules are interpreted using software written in XQuery running on the open source eXist-db XML database. As the user enters data for an instance of an entity (a row of a table), the software will evaluate the rules in the model in an appropriate order and compute the values of all the computed attributes, rather as a spreadsheet does. Here however the rules are expressed in readable formula which use the names of other attributes in the same entity and of those in related tables.
Formula conventions
The formulae are expressed in the XQuery language, although most need only the XPath subset. Two shortcuts are used:
$self/fieldname is a reference to a field in the record being processed.
table(‘tablename’) is a reference to the rows of a named table which may be a base reference table such as Habitat or a project-specific table such as Habitat_Baseline.
XPath expressions allow the rows to be filtered with a condition in [ ] and fields accessed by /fieldname
For example, the rule to compute the list of Habitats in a Broad Habitat is:
table('Habitat')[Broad_Habitat=$self/Broad_Habitat]/Habitat
which means:
Take all the rows of the Habitat table where the Broad_Habitat is the same as this rows Broad_Habitat and return the list of Habitat values in those rows.
To retrieve the Distinctiveness Score of the selected Habitat from the Habitat table:
table('Habitat')[Habitat=$self/Habitat]/Distinctiveness_Score
The language provides a range of common functions. This is the formula used in the overall Project Summary to sum all the On-site Baseline Habitat units:
sum(table('Habitat_Baseline')[On-off-site='On-site']/Total_habitat_units)
Here is the full model for the Habitat_Baseline.
Mapping the Excel Spreadsheet to the Conceptual Model
The reference tables were extracted from the tables in the BNG 4.0 calculator tool and exported as CSV, then loaded into the eXist database using column headings as attribute names. Some names were changed to better reflect their role. The key Habitat table was restructured to have two key columns: Broad Habitat and Habitat.
Three tables were multidimensional, with row headings one dimension and one or two levels of column headings for the other dimensions.
Habitat_Condition: Spreadsheet Table G-8 Condition lookup, Technical Annex 2 Data Table 2 Habitat condition score matrix.
Habitat_Creation_Year: Spreadsheet Table G4 Temporal Multipliers, Technical Annex Data 2 Table 3: Habitat creation matrix.
Habitat Enhancement Year: Spreadsheet Table G-5 Enhancement Temporal, Technical Annex 2 Data Table 3: Habitat enhancement matrix
The data in these tables are sparse, so multiple cells are marked as 'Not Possible'. For computational purposes it is preferable to convert these to simple tables with multiple keys and with 'Not Possible' combinations removed to be dealt separately with when the data is missing.
The tables which contain project-specific data are based on the same tables in the Spreadsheet. For simplicity I combined each pair of On-site and Off-site tables into a single table. This ensures that the only difference is the application of a spatial multiplier for the Off-site entries.
Comparison with the Natural England Spreadsheet
So far, the model is limited to the Area Habitat tables, both on-site and off-site as well as support for tree surveys. Testing has been so far limited to defining a number of real-world cases in both the Natural England Spreadsheet and in the XQuery on-line system and comparing the results.
This is the set of projects so far implemented. All are viewable but a pin number is required to edit all but the Test Project.
Given the complexity of some of the formula, we have identified very few issues:
The computation in the Spreadsheet for Enhancement Habitat Units is at odds with the formula given in Technical Annex 2 BOX TS 7-1. The Spreadsheet formula only uses the Post-Intervention Area, whereas Equation 3 refers to the Pre-Intervention Area as well.
The Off-site Enhancement calculation makes no use of the Spatial Risk multiplier although this is present in the sheet.
Rounding in the Spreadsheet is sometimes incorrect which creates small differences in totals to those in the online version where values are computed throughout to double precision and rounded on display.
Technical Annex 2 Table 2 Habitat Condition Score Matrix and hence Spreadsheet table G8 Condition look-up allows the Bramble Scrub Habitat to have both 'Condition Assessment N/A' and 'Fairly Poor'.
Further work
The project is at the prototype stage and parts of the BNG model are yet to be implemented, in particular the linear habitats of hedges and waterways and some overall validity checks. Automated testing is feasible but has not yet been implemented. It would be interesting to know if Natural England have test data which they could share.
We hope this project will be a useful contribution to the establishment of BNG4.0. A repository for the project is being created on GitHub.
Oct '23
Version 2 of the platform under development.
~ prefix replaced by $self
3 notes
·
View notes
Text
An aperiodic tiling discovery
Much excitement last week with the publication by David Smith, Joseph Myers, Craig Kaplan and Chaim Goodman-Strauss of their discovery of a single tile which tiles aperiodically. Not only that but it does not need any supplementary rules, as Penrose's dart/kite pair do, to ensure aperiodicity. Christian Lawson-Perfect wrote about the story in aPeriodical. Later: There is now an excellent online talk by Craig and Chaim on the discovery and its proof hosted by the National Museum of Mathematics in New York.
The shape was discovered by David Smith, a hobbyist geometer. There is a wealth of research in David's blog, which starts with the declaration "I am not a mathematician but I do like shapes, interesting symmetry, polyhedra, tessellations and geometric patterns. " Skimming though it, one can see the deep exporation of shapes which makes his discovery seem almost inevitable. I plan to read more of his blog for inspiration. Well done ye, David!
The mathematical work of proving that the tile is aperiodic is a masterful exercise, clearly explained. A truly inspiring collaboration between a tinkerer, acedemic mathematicians and computer scientists.
OpenSCAD
Naturally I had a look at this with my OpenSCAD tiling tools.
tl:dr: A customizer on Thingiverse.allows both kinds of tiles in normal or mirror forms and all intermediate tiles to be printed or laser-cut.
I began by defining the perimeter as a sequence of sides each defined by side length and interior angle taken from the diagram, where we see up of 16 right triangular segments ( 8 kites) of adjacent hexagons. In this formulation, r is the long side of the triangle, a and b the other sides.
function hat_peri(r) =
// r is the radius of the base hexagon
// returns perimeter as a sequence of [side length,internal angle]
let (a = r * sin(60), b = r*cos(60) )
[[b,180],[b,120],[b,270],[a,120],[a,90],[b,120],[b,270],[a,120],
[a,90],[b,240],[b,90],[a,240],[a,90],[b,120]];
The first two sides form a straight line but for the purposes of tiling are distinct edges.
The perimeter is converted to a sequence of points using turtle-like geometry:
function peri_to_points(peri,pos=[0,0],dir=0,i=0) =
i == len(peri)
? [pos]
: let(side = peri[i])
let (distance = side[0])
let (newpos = pos + distance* [cos(dir), sin(dir)])
let (angle = side[1])
let (newdir = dir + (180 - angle))
concat([pos],peri_to_points(peri,newpos,newdir,i+1))
;

Tiling with this shape requires the use of the mirror image of the base tile:
function reverse(l) =
[for (i=[1:len(l)]) l[len(l)-i]];
function mirror_peri(q) =
let(p=reverse(q))
[for (i=[0:len(p)-1])
[p[ (i - 1 + len(p) ) %len(p)].x,p[i].y]
];

[This is a bit of a pity. Penrose's tiles are symmetric so the question doesnt arise but the search continues for a monotiling which does not require the use of reflections.]
My library of OpenSCAD functions supports the creation of tilings by defining a sequence of edge-to-edge placements. ATM this list is created manually. Each line specifies the alignment of one of the base tiles and edge to a tile and edge in the assembly.
hat_assembly_6 = [
[[0,0]]
,[[0,0],[0,1]]
,[[0,5],[0,2]]
,[[0,3],[0,4]]
,[[0,13],[0,6]]
,[[1,1],[0,9]]
,[[0,7],[0,12]]
];
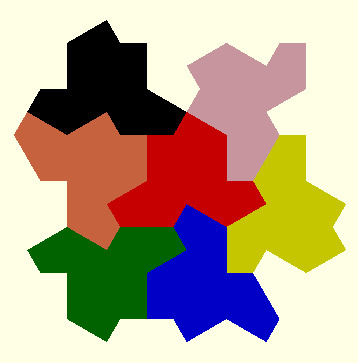
module hat_tile_6(d) {
p = hat_peri (10,d);
t=peri_to_points(p);
m=peri_to_points(mirror(p));
unit=group_tiles([t,m],hat_assembly_6);
fill_tiles(unit,["red","green","blue","yellow","pink","black","coral"]);
}
Parametric tiles
More amazingly still, this tile turns out to be one of a family of aperiodic tiles, which in the limit are simple periodic tiles. They are beautifully animated here. The parametric perimeter description enables all members of this family to be constructed:
function hat_peri_family(r,d) =
// r is the radius of the base hexagon
// d is the angle which varies from 0 to 90
// returns perimeter as a sequence of [side,internal angle]
let (a = r * sin(d), b = r * cos(d) )
[[b,180],[b,120],[b,270],[a,120],[a,90],[b,120],[b,270],[a,120],
[a,90],[b,240],[b,90],[a,240],[a,90],[b,120]]);
At the limits , the tiles tesselate:
d=0 (nicknamed the comet)

d=45

d=90 (nicknamed the chevron)

All the tiles inbetween are aperiodic:

The Turtle
David also discovered a second tile he called the turtle. Defined as a perimeter, this also has 14 sides and is a family of tiles:
function turtle_peri(r,d) =
// r is the radius of the base hexagon
// returns perimeter as a sequence of [side,internal angle]
let (a = r * sin(d), b = r * cos(d) )
[[a,240],[a,90],[b,240],[b,90],[a,120],[a,180],[a,120],[a,270],[b,120],[b,90],[a,120],[a,270],[b,120],[b,90]];
d=60

The periodic endpoints d=0 and d=90 are the same as for the hat.
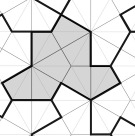
This is a small section of a tiling in David's blog:
No mirroed tiles in this example.
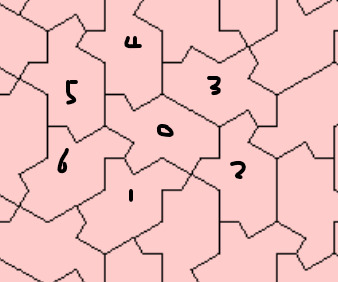
turtle_assembly_6 = [
[[0,0]]
,[[0,12],[0,13]]
,[[0,13],[0,2]]
,[[0,5],[0,6]]
,[[0,4],[0,7]]
,[[0,5],[0,10]]
,[[0,10],[0,11]]
];

To do
I'd like to add a couple of the suggested decorations.
A big task is to automate the tile placement to construct an assembly. Craig's software does this so I dont expect it to be easy! The approach I'd like to explore (perhaps it's the obvious appraoch?) is to start with the perimeter description of the base tile and extend this as each tile is added. The next tile can be placed by matching a subsequence of the tile perimeter to a subsequence of the expanding perimeter. Bit complicated to ensure that such a match will result in a fit especially with concave shapes.
Further
Veritasium has a nice youtube on the background to aperiodic tiling
Jaap Scherphuis created the PolyForm Puzzle software which was used by David in his explorations.
7 notes
·
View notes
Text
Twin boys netsuke
This object was part of my late brother Richard's collection of miscellanea:


It measures about 58mm x 55mm x 45mm, The material is very shiny, hard and cold to the touch so I guess it's not ivory. I'm reluctant to apply the hot needle test however.
I found only one similar piece on the internet - this one in the Metropolitan Museum in New York:

This is what the Met says about the figure:
The four bodies and two heads of this sculpture belong to four entwined boys—one pair seated and the other kneeling on all fours. The group represents the principle of ancient Chinese cosmology known as liangyi sheng sixiang, in which two primary forces (yin and yang) generate four images. The design, which can be read either vertically or horizontally, further exemplifies the artist’s familiarity with rotational symmetry.
I love the ambiguity of this design. Puzzling that I can find no other examples of it. It has a hole through the middle which I gather is for the passage of the sash cord of a Kimono - known as Himotoshi.
1 note
·
View note
Text
Bristol is one of Britain's greenest cities ?
[Draft only]
Press headlines from a few weeks ago (24th Nov)
Study reveals Britain’s greenest cities – and they are all in the south[1]
Scientists name Exeter and Bristol among the greenest cities in Britain[2]
Following these articles, the mayor of Bristol proudly tweeted
🎉 #Bristol's got the third greenest urban centre in Great Britain
Good news headlines for Bristol after last year's headline claiming that “Bristol ranks as the 5th greyest city in England” turned out to be rubbish. [7] But has the pendulum now swung too far the other way?
The press release was based on the work of researchers from Sheffield University as reported in Urban centre green metrics in Great Britain: A geospatial and socioecological study by Jake M. Robinson et al [3]. According to their study Bristol has the 3rd greenest City centre in Britain. By way of contrast, Cardiff, our neighbour in Wales is 3rd from the bottom. Exeter is greenest of all. Coincidentally, Sheffield was bottom of the table, although not due to the notorious destruction of Sheffield's street trees which did not affect Sheffield city centre since there were hardly any trees there anyway.
Boundaries
If we learnt anything from the misreporting last year, it is that the choice of boundaries is critical. In this paper, cities are identified by their retail centres as defined by the Consumer Data Research Centre (CDRC) and available publicly [5]. The boundaries used were computed from 2015 retail site data and published in 2017. These have now been replaced by boundaries from 2022 using a different methodology which looks less suitable for this analysis[6].
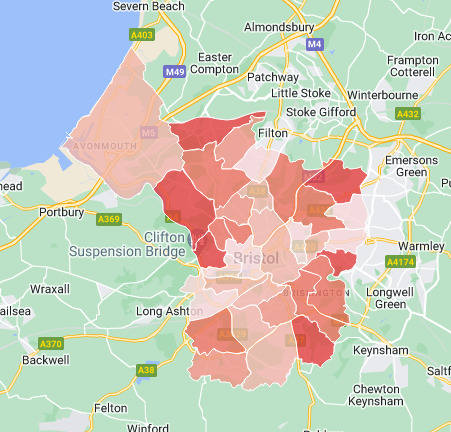
The boundary of Bristol's Retail Centre is a somewhat odd shape, taking in Broadmead, Park Street and the Triangle.
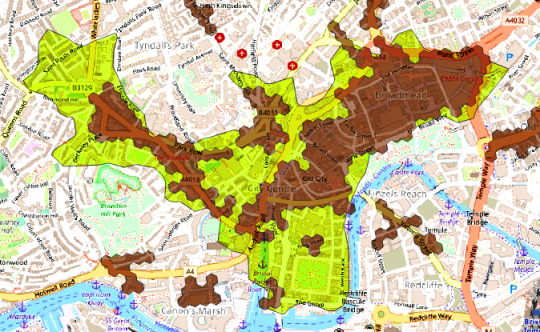
Yellow area : 2017 retail area; Brown hexs : 2022 retail area.
Luckily for Bristol the boundary used includes Queens Square although there are few retail units there and ignores, probably since the data is 7 years old, emerging retail areas around the Millennium Square.
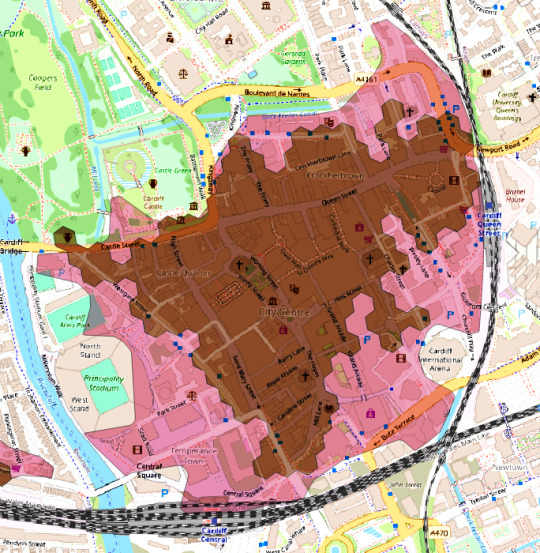
The boundary of Cardiff's Retail Centre shows a much more compact commercial centre:
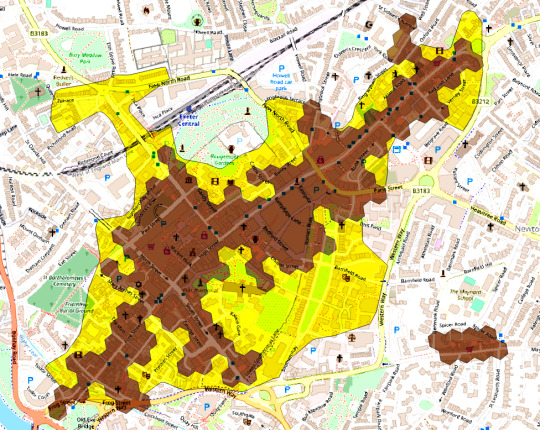
and this is the boundary for Exeter
For the Sheffield researchers, the only boundaries available when the research started were the 2017 boundaries. However it can be seen that the way in which the boundaries are drawn and the general shape of the central area, affected as it is by history, transport links and geography, have a major influence on what areas are inside the boundary and hence how green the centre is judged to be. This is most evident in the two extremes of tree canopy, Islington and Sheffield, the one, a ribbon development along streets, the other a compact city centre. If the 2022 boundaries had been available, the results would have been very different. Bristol's centre would be split in two and significant green spaces in Bristol and Exeter would be excluded whilst there would be little change in Cardiff. Whilst difficult to quantify, the variability in boundary would have a significant effect on the final ranking.
To be fair, the problem of boundary definition was not unknown to the team and one of the authors, Paul Brindley has worked extensively on the problem of defining imprecise regions such as 'the city centre' (see below)
Measures of greenness
The other major factor is the choice of the measure of greenness. The study uses three measures: tree canopy measured using i-Tree Canopy, NDVI measured from multi-band imagery from Copernicus and green area based on the intersection of OS Greenspace areas with the retail area.
Tree canopy
The research uses i-Tree canopy which we have used extensively in our analysis of Bristol Tree canopy and is also used by Forest Research for their nationwide survey [9] . The method is easy to use but because it relies on an observer classifying sampled points within a boundary, it is subject to three sources of error:
sampling error : standard error for a sample of a binomial distribution of values [0,1] with mean p and n points is sqrt(p * (1-p) /n) eg for p=0.15 and n =200, se = 0.025 so 95 % Confidence Interval is 0.125 to 0.175 (12.5% to 17.5%) .The study states a SE of 2% but this is ambiguous and the CI form is preferable. Note that i-Tree and Forest Research report the error bounds as +/- SE but this is only a 68% interval, meaning 1 in 3 values will be outside this interval.
observational error : difference between the values obtained using the same sample by different observers, or the same observer at different time. The main difficulty is judging the height of the canopy. This error is reducible by training and by reconciliation of multiple surveys but in our experience, it is of the same order as the sampling error.
imagery bias and error: imagery taken at different times of the year will yield different values ; imagery of different resolutions will affect the ability of observers to make accurate judgements.
NDVI
The study calculated the NDVI (Normalised Difference Vegetation Index) by comparing Copernicus Sentinel-2 imagery in the red and near infrared bands . This provides a proxy for chlorophyll output. The imagery is available via the Digimap service which requires a subscription from an academic institution or in raw form via the Copernicus Open Access Hub I haven't attempted to replicate the analysis which would have been useful to assess the error bounds. The study found a strong correlation between NDVI and Tree cover.
Green space
The study uses the OS Greenspace dataset. This data is publicly available [7]. The product guide states
Its primary purpose is to enable members of the public to find and access greenspaces near them for exercise and recreation.
The categories of greenspace'included in the dataset are:
Allotments Or Community Growing Spaces
Bowling Green
Cemetery
Religious Grounds
Golf Course
Other Sports Facility
Play Space
Playing Field
Public Park Or Garden
Tennis Court
In some ways it is an unsatisfactory data set to use to assess greenspace from an ecological perspective. In an urban area, sport facilities are mostly buildings so sensibly this category is excluded from the analysis. For religious grounds, the church buildings are included in the area. It does not include woodland areas per se. The restriction to public areas ignores private areas which are just as useful ecologically as the public ones.
The greenspace measure is based on the intersection of the OS Greenspaces with the Retail area.
The central area of Bristol includes or touches 8 greenspaces: 1 cemetery, 5 public parks and gardens and 3 religious grounds. On examination, of the 5 parks, 2 have less than 5% of their boundaries within the retail area, though only this fraction is included in this measure..
Comparison of the OS area with Google Earth imagery and local knowledge shows that the OS dataset has missed 6 additional greenspaces: 4 Parks or Gardens and 2 Religious grounds which would increase the area by 35%. OS acknowledge that this dataset is a work in progress and input from the public is sought in increasing the accuracy of the data.
I-Tree canopy for greenspace
Another way of assessing greenspace would have been to use the i-Tree canopy method using a land use category of green space. I did this for Bristol, Cardiff and Exeter. Such a measure is subject to the same variability as the the canopy but is accessible to the citizen scientist. For these three cities, the results are rather different from the OS greenspace measure.
{Table}
Combined measure
The study combines the three measures used Principal Component Analysis and this is the value used to rank cities. I wasn't able to reproduce their PCA analysis but found that a rank based on the average of the Z-values of each measure produces a very similar ranking. However I lack data on the standard errors for two of the measures so cannot compute an overall standard error.
Ranking under uncertainty
I have identified a number of sources of uncertainty in this study, ranging from choice of boundary for the retail area definition, uncertainty in the canopy estimates due to sampling and other variability and uncertainty of inclusion/exclusion in OS greenspace definitions. Only one of these is mentioned in the paper (i-Canopy sampling error) and for the purpose of ranking towns, these uncertainties are ignored. Does this matter?
Ranking is a particularly crude treatment of continuous data as it effectively forces the subjects into an evenly spaced sequence and loses any proportionality between them.
[replace with an alternative analysis]
if A and B are both normal variates with means m1,m1 + d and standard errors s1 and s2 , then C = B-A is also a normal variate with mean m1 + d - m1 = d and se = sqrt(se1+se2). Actually the data is not normal but close enough for this analysis. I analysed the confidence in the ranking of the i-Tree canopy data, the only set for which estimates of variance, albeit only that arising from sampling error, are available.
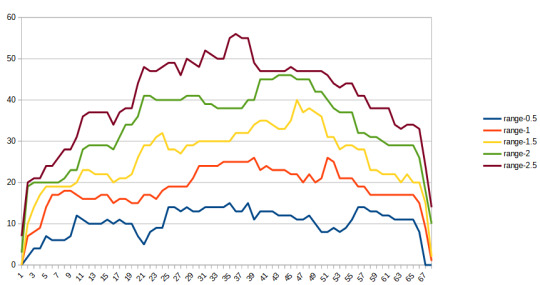
The total number of cities in the study is 68. It shows for each city and for different multiples of the se of the difference, the number of other cities which are not statistically different at that level of confidence.
For a 95 % (1 in 20) confidence interval (i.e 2*SE), this number is alarmingly high. For Bristol ranked 8th, there are 18 statistically indistinguishable cities ranging from Exeter ranked 2 to Aberdeen ranked 19
Newspaper promotion of the research
It is inevitable that news items based on the study will focus on winners and losers. The issue of the reliability of such ranking is not even considered by the study's authors so its unlikely that newspapers will see a problem.
It is also inevitable that such research will be cherry-picked for good news, or even distorted as in this article on the Univerisity's own web site "Yet, this once-mighty industrial powerhouse now has the greenest city centre in Great Britain, with a whopping 61% of its catchment area given over to parks, woodlands and gardens, including one-third of the Peak District National Park, with its exposed moors and scrubby heathland." (12) But Sheffield centre is actually bottom of the table and the good news is from an entirely dfferent study using a very wide definition of the area of the City.
As an aside, the photographs used to illustrate the news articles do not represent the areas analysed. The ITVx article shows Heavitree Pleasure Ground in Exeter while for Bristol, a picture of the Downs is used. Both parks are over a mile away from the designated retail centres. The Guardian article uses a picture of Christ's Pieces which is also outside the retail area used. Perhaps this shows that the common understanding of the city boundary is rather different to that used in this study.
Response from the authors
I have been in touch with one of the authors, Paul Brindley who was helpful with some of my queries about the work. The NDVI data, based on Copernicus, is available https://scihub.copernicus.eu/ although the team used preprocessed data downloaded from Digimap.
I havent yet found out why and how Landsat 8 2020 imagery was used with i-Tree Canopy . My understanding is that the spatial resolution is 15m at best .
Rather worryingly, Paul commented "We did not explore the effects of uncertainty within the data on the final output as this was beyond the scope of the intended work but we do acknowledge the importance more generally." There is a worrying assumption that because data such as the OS Greenspace data is published without any error estimates, they are error-free.
No comment as yet of the validity of ranking data with errors.
References
1 Study reveals Britain’s greenest cities – and they are all in the south Guardian Nov 24 ,2022 https://www.theguardian.com/travel/2022/nov/24/study-reveals-britains-greenest-cities-and-they-are-all-in-the-south
2 Scientists name Exeter and Bristol among the greenest cities in Britain ITV November 24, 2022 https://www.itv.com/news/westcountry/2022-11-24/the-south-west-city-crowned-greenest-in-britain-by-scientists
3 Urban centre green metrics in Great Britain: A geospatial and socioecological study Jake M. Robinson et al, November 23, 2022 https://journals.plos.org/plosone/article?id=10.1371/journal.pone.0276962
4 CDRC Retail boundary 2017 version https://data.cdrc.ac.uk/dataset/retail-centre-boundaries-previous-versions
5 CDRC Retail boundary 2022 version https://data.cdrc.ac.uk/dataset/retail-centre-boundaries-and-open-indicators
6 OS greenspace boundaries https://osdatahub.os.uk/downloads/open/OpenGreenspace
7 Bristol Tree Forum May 2021 https://bristoltreeforum.org/2021/05/13/tree-canopy-of-bristol/
8 BCC Important Open Spaces - in https://maps.bristol.gov.uk/arcgis/rest/services/ext/datagov/FeatureServer
9 Forest Research Urban Tree Canopy Survey https://www.forestresearch.gov.uk/research/i-tree-eco/uk-urban-canopy-cover/
10 Ranking Under Uncertainty Zuk et al 2007 https://arxiv.org/ftp/arxiv/papers/1206/1206.5280.pdf
11. Investigating behavioural and computational approaches to defining imprecise regions by authors including Paul Brindley https://www.tandfonline.com/doi/full/10.1080/13875868.2018.1531871
12. https://www.sheffield.ac.uk/news/greenest-city-centres-great-britain-revealed
Notes
QGIS : to select a boundary in a layer
Select the layer in the list of layers on the LHS
Edit/Select (or click the select icon in the toolbar) to select a boundary in that layer using the pointer
Edit/Copy features
Edit/Paste features/ new vector layer
Save as kml
0 notes
Text
Pottery progress : glazing
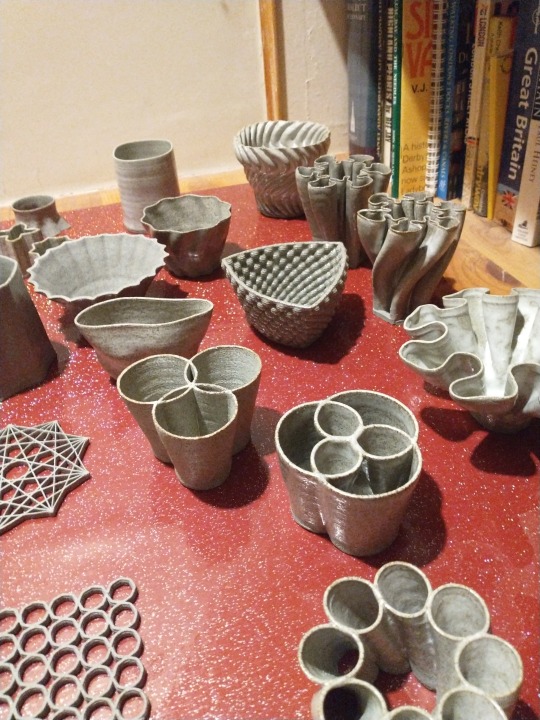
Work on pottery with the Eazao Zero has taken a back seat recently, what with a summer of sailing in the West coast of Scotland and a lot of work on BristolTrees.
I finally got round to glazing a batch of pots which were bisque-fired back in May. I knew nothing about glazing but Mike Williams of Hot Clay pointed me in the direction of two clear Vitraglaze stoneware glazes to try, sold me a 80 mesh sieve and gave me some pointers about specific gravity.
I'd never seen glazing done for real (except from a distance on The Great Pottery Throwdown). I was working with 1kg bags of glaze mixed in a paint bucket so hand mixing was enough. The sieve was quite small so I first had to make a simple trangular support for it to fit over a bucket.
I used mostly this shiny transparent glaze. First is the problem of getting the consistency right. Mike advised me to try different specific gravities to see which worked best with the surface texture of the printed pots. I tried several ways of measuring the SG and settled on using a 30mm syringe, weighing it empty and then full of the glaze and dividing the difference by 30. I tried a range of SGs from 1.6 to 1.3.
I had assumed I would need to use wax resist to ensure the bottoms were free of glaze. It was simpler to just hold the pot by the base and dip in, leaving the bottom 1 cm undipped. Problem is getting the inside coated as well. I tried pouring glaze into the pot and quickly tipping it out but it was hard to get a even coverage. Then I read that you could wipe the glaze off the base! So now I could dip the whole piece into the glaze. I saw people using tongs to hold the piece but I didn't have these so just held it in my fingers. I worried about marking the glaze but when the pieces were fired, any marks seemed to disappear as the glaze flowed.
The bisque pots were very dry after a long hot summer. The walls are also quite thin. This meant that the pots absorbed a lot of water from the glaze leaving a thick layer of glaze behind. I tried damping the pots beforehand but it's hard to control the dampness. Best seemed to be to dunk the pieces, let to dry overnight and then glaze.
After the glaze had dried, I found that for a few pots, the layer was very powdery and uneven. I worried about dripping onto the shelves in the kiln so brushed off the excess.
My friendly heighbourhood potter, Tamsin John, fired the pieces in her kiln and I only dripped a bit of glaze onto a shelf. I'd seen threats that this would ruin the shelf but a touch with the angle grinder fixed it. Great result and many thanks, Tamsin.
1 note
·
View note
Text
Measuring and Modeling Bristol’s Tree Canopy
Launched in January 2019, Bristol’s One City Plan is a vision of the development of Bristol over the years until 2050. This vision covers many aspects of city life. Of particular interest to the Bristol Tree Forum are two goals:
by 2036 Tree canopy cover has increased by 25% since 2018
by 2046 Tree canopy cover has doubled since 2018
The obvious question to ask is :
What was the canopy in 2018, the baseline for these proportional increases?
But to answer that question, we need to ask another:
How can tree canopy be measured across the city?
We would expect certain properties of a method of measurement, such as accuracy, precision, repeatability, economy (since it will have to be applied repeatedly over the years to assess progress) and scalabilty (so the method can be applied to any boundary to analyse selected areas of the city ).
Neither question was addressed in One City Plan publications. A group led by BCC’s Richard Ennion which including Forest of Avon Trust (FOAT), Woodland Trust and Bristol Tree Forum (BTF) met in in 2018-2019 to address these and other tree strategy issues. An ecological survey using the i-Tree Eco method was undertaken by FOAT and volunteers. Here 201 randomly located 11m radius plots are surveyed. This resulted in useful data on the proportion of tree species (Ash was a worrying 16% of trees in Bristol) and estimated the tree canopy at 12%. BTF had also carried out a survey using i-Tree Canopy which is a desk-based method using Google Map imagery able to be carried out by citizen scientists. Our figure was around 18% which was more in line with previous estimates. This figure was later quoted in the Cabot Institute Review of Progress.
Our arguments in favour of the i-Tree Canopy method were several: reputational (it is used by Forest Research in their nationwide survey); precision (error range is smaller than i-Tree Eco and sample size easily increased to improve precision); economy (i-Tree Eco survey cost around £20k whereas i-Tree canopy is essential free ) and scalability (the method can be easily applied to any bounded area).
In the event, the lower figure of 12% was adopted but no decision was made about a suitable method. The 12% figure leads to a goal of 16% by 2036 and 24% by 2046. However, since the i-Tree Eco method was limited to 201 plots across the city, it is unable to give estimates at ward level, so reports about variability by ward have, anomolously, used our i-tree Canopy figures of 9% to 22%. Ward level estimates are visualized on our ward information page.
The i-Tree Canopy method can be undertaken using a tool provided by i-Tree. BTF have developed our own version of this tool to improve the precision, ease of use by citizen scientists and to integrate into our BristolTrees website. We have used this tool to estimate the canopy for 2020 and while there is a slight numerical increase, it is not statistically significant.
More recently we have had access to the estimates produced by the commercial Bluesky tree map which is based on lidar and aerial imagery. The figure for Bristol, (once corrected to exclude large areas of the Severn Estuary in the Bristol Unitary Authority boundary) is slightly less than the i-Tree Canopy estimate, a difference probably accounted for by BlueSky’s ability to exclude canopy below 3m. Recent BCC reports seem to accept that the baseline is 18% and Bluesky mapping recommended as the method of estimation. It is however unclear how the 18% baseline affects the One City Plan goals. If still based on the initial 12% but measured using Bluesky (or i-Tree Canopy), the 2036 goal of 16% has apparently already been achieved!
The use of the commercial Bluesky service raises questions of the cost of this data, its granularity and the extent to which this data will be publicly available as open data. We look forward to answers on these issues.
Canopy prediction
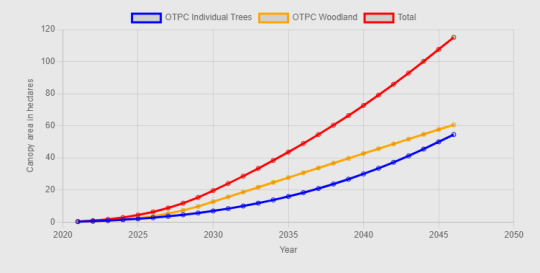
We have created an online canopy prediction model which computes the canopy over a future period, based on defined planting schemes, which may be so many trees per annum over a period, or so much woodland area.
The BCC report on the planting season 2021-22 shows that 1,352 individual trees and 3 hectares (ha) of woodland were planted. The model predicts that this would yield a total of about 8 ha canopy by 2046. (The BCC report predicts 22.7 ha but this is when all trees have reached their full maturity, well beyond 2046). If repeated every year till then, this planting programme would produce about 120 ha. This is the model used.
To get a fuller picture, we can account for the trees which are lost due to disease, damage or because they outgow the site. On average, about 400 BCC trees are lost each year,and this figure is expected to rise as Ash Dieback takes its toll. If this is added into the model, the result is much less promising. This powerfully demonstates the great benefit of saving the existing tree stock.

However it is unfair to account for tree losses in the BCC tree stock without modeling the canopy growth. This model needs to take account of the age and species profile and to take into account tree management practices. Many large street trees are managed through regular pollarding so that their canopy is essentially constant. This is complex task which is still to be done.
Is the goal achievable?
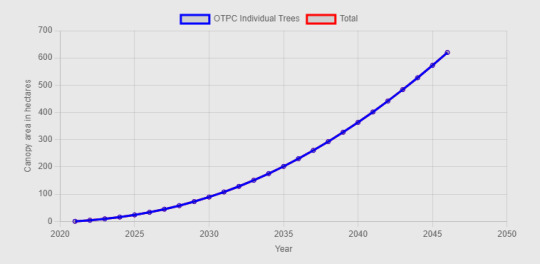
Achieving the goal of even 24% cover from a base of 18% by 2046 is still a challenging task, even though this would increase tree cover by only a third rather than doubling. It would require adding 660 hectares of tree canopy in 28 years.
A paper by Waters and Sinnett (2021) looked at this issue. Their results are not directly compatible because, thanks to the baseline confusion, they explored the need to increase canopy from 12% to 37.5% using the i-Tree Forecast software. Multiple scenarios are explored but no distinction was made between woodland planting, where the eventual canopy area is limited to the planting area, and planting individual street or park trees able to grow to full canopy width.
In order to create 660 ha, our model indicates that you would have to plant 26 ha of woodland per annum or 14,000 individual trees or some mixture of the two. This model assumes an annual mortality rate of 1%. With a mortality of 3% more typical of urban trees, the planting rate rises to 24,000 trees pa. Urban trees have high early mortality which reduces over time and this is not yet modeled.
In the predictions above, canopy size prediction uses Root Protection Area as defined in BS5837. RPA is a generous proxy for canopy area. Other predictve models are supported, including one derived from data on the Bristol tree stock. The model takes no account of trees lost through the period due to felling existing trees because of age, disease or development, nor for the effect of climate change on tree health. As a result, these predictions, daunting though they are, are likely to be under-estimates of the planting required to achieve the goal.
However, the major constraint is the lack of suitable street space and land to achieve this level of planting and competition for land use from other One City Plan goals, such as increased housing, food security and greater ecological diversity. Trees alone provide some ecological benefits although this is species-dependant. In general, British native trees provide better ecological support than introduced trees. 37% of the existing council-owned tree stock are natives but only 18% of the trees ear-marked for planting are natives. Woodland areas have a much higher proportion of natives. BCC is undertaking research into the availablity of both street and parkland planting to explore the opportunities for street and park planting.
So our assessment is that even the goal of 24% is unachievable. This does not of course mean that we should not do our utmost to increase tree canopy. The benefits of trees in an urban environment are well-documented.
The private realm
This analysis has focused on the role of the council in expanding tree canopy on council land. However the majority of land and hence tree canopy in Bristol is in private and commercial hands. The need for private and commercial landowners to use their land to help move the city forward is clear. BTF is particularly concerned over the loss of mature trees due to housing and other development. Mature trees are an irreplaceable (in the short and medium term) loss of canopy and sequestered Carbon. Likewise for private homes, the trend seems to be in the wrong direction, with paving of front gardens, astroturfing of back gardens and existing trees often deemed more of a nuisance that a benefit.
The need to bring the public on-side with this goal is urgent.
1 note
·
View note
Text
Sonification of Electricity usage
I have a smart meter with a display in the hall. Trouble is, I hardly ever look at it and the data shows cumulative values rather than the energy being used right now. I had the idea of sonifying the data being recorded by my ESP8826-based electricity monitor. Currently it reports every minute to my sensor dashboard.
I initially thought of running this on an ESP32 or Pi Pico W since both have onboard Wifi which could be used to retrieve the current data from the dashboard. I looked at a few ways to do this, such as using Midi and even ordered a sound module.
However it occured to me that rather than build a device to play the sounds, it could be done as a web page using JavaScript to play the files. At the very least, this would be very useful for testing sonification schemes .
The key HTML feature is the <audio> tag to define the audio resources and the Javascript API to play the audio track. Playing around with this feature, I realised that audio tracks can be looped and can run in parallel and the volume of each track can be changed as the tracks are played.
An update rate of once a minute is too slow to show devices being turned on and off so the ESP8266 monitor was changed to report to another channel every 6 seconds to the dashboard. Only the latest record is recorded on this channel since a full history would be too large. This reading is fetched from the dashboard at the same rate. I'm exploring the idea of multiple sound tracks whose volume is adjusted in response to the level of usage. Currently I'm using six bird songs. Tracks are allocated to bands and as the level of energy usage, measured in watts, increases, tracks are brought into the soundscape with increasing volume.
This approach looks promising because it can be run on a phone and carried around the house, and can be listened to when away from the house. This is the current version. Data fetching and sounds can be turned on and off and the thresholds changed.
The problem now is to design the soundscape and thresholds to best represent the changing energy level.
Other sonification ideas
I'd like to look at getting the national Grid data - obtainable via an API described in https://bscdocs.elexon.co.uk/guidance-notes/bmrs-api-and-data-push-user-guide
This and data from the tree moisture sensor are multi-channel and will need a different approach to generating the soundscape
Extras
Grid in January 2013
Bought this CJMCU-1334 breakout board for playing MP3 files £9
Tutorial
alternatively ESP32 supports BLE which could be used to send MIDI derived sounds to a phone
Free sounds https://freesound.org/
2 notes
·
View notes