#sensu configuration
Text
Update Sensu Config
Problem
You need to update sensu configuration but would like to avoid redeploying servers. Ideally it needs to be something that can be done simply across multiple servers ideally with one line. The sensu service will need to be restarted as well to apply the new configuration.
Solution
The below commands will update the configuration and restart the service.
This file contains bidirectional…

View On WordPress
#backup configuration#configuration#jq#json#sensu#sensu configuration#systemctl#systemctl restart#systemctl status#tee
0 notes
Note
Birds are class Aves.
Sure, under Linnaean taxonomy. But, well,
A) Linnaeus was a eugenecist so his scientific opinions are suspect and his morality is awful
B) he didn't know about evolution
C) he didn't know about prehistoric life
so his classification system? Sucks ass. It doesn't work anymore. It no longer reflects the diversity of life.
Instead, scientists - almost across the board, now - use Clades, or evolutionary relationships. No rankings, no hierarchies, just clades. It allows us to properly place prehistoric life, it removes our reliance on traits (which are almost always arbitrary) in classifying organisms, and allows us to communicate the history of life just by talking about their relationships.
So, for your own edification, here's the full classification of birds as we currently know it, from biggest to smallest:
Biota/Earth-Based Life
Archaeans
Proteoarchaeota
Asgardians (Eukaryomorphans)
Eukaryota (note: Proteobacteria were added to an asgardian Eukaryote to form mitochondria)
Amorphea
Obazoa
Opisthokonts
Holozoa
Filozoa
Choanozoa
Metazoa (Animals)
ParaHoxozoa (Hox genes show up)
Planulozoa
Bilateria (all bilateran animals)
Nephrozoa
Deuterostomia (Deuterostomes)
Chordata (Chordates)
Olfactores
Vertebrata (Vertebrates)
Gnathostomata (Jawed Vertebrates)
Eugnathostomata
Osteichthyes (Bony Vertebrates)
Sarcopterygii (Lobe-Finned Fish)
Rhipidistia
Tetrapodomorpha
Eotetrapodiformes
Elpistostegalia
Stegocephalia
Tetrapoda (Tetrapods)
Reptiliomorpha
Amniota (animals that lay amniotic eggs, or evolved from ones that did)
Sauropsida/Reptilia (reptiles sensu lato)
Eureptilia
Diapsida
Neodiapsida
Sauria (reptiles sensu stricto)
Archelosauria
Archosauromorpha
Crocopoda
Archosauriformes
Eucrocopoda
Crurotarsi
Archosauria
Avemetatarsalia (Bird-line Archosaurs, birds sensu lato)
Ornithodira (Appearance of feathers, warm bloodedness)
Dinosauromorpha
Dinosauriformes
Dracohors
Dinosauria (fully upright posture; All Dinosaurs)
Saurischia (bird like bones & lungs)
Eusaurischia
Theropoda (permanently bipedal group)
Neotheropoda
Averostra
Tetanurae
Orionides
Avetheropoda
Coelurosauria
Tyrannoraptora
Maniraptoromorpha
Neocoelurosauria
Maniraptoriformes (feathered wings on arms)
Maniraptora
Pennaraptora
Paraves (fully sized winges, probable flighted ancestor)
Avialae
Avebrevicauda
Pygostylia (bird tails)
Ornithothoraces
Euornithes (wing configuration like modern birds)
Ornithuromorpha
Ornithurae
Neornithes (modern birds, with fully modern bird beaks)
idk if this was a gotcha, trying to be helpful, or genuine confusion, but here you go.
all of this, ftr, is on wikipedia, and you could have looked it up yourself.
671 notes
·
View notes
Text
https://www.partshnc.com/243-12-2-sensus-gas-division-2-std-34-orf30-6-14-greenspr

The Sensus-Gas Division 243-12-2-2 Inch Std 3/4 Inch Orf30' 6-14 Inch Greenspr is a precision-engineered component designed for gas distribution systems. With its 3/4 inch standard size, it seamlessly integrates into existing setups. Featuring an Orf30' design, it ensures efficient gas flow and distribution across various applications. Its 6-14 inch Greenspr configuration optimizes performance and accuracy, making it suitable for a range of pressure requirements. Crafted with durability in mind, this part guarantees longevity and reliability in demanding environments. Trust in its quality craftsmanship to maintain consistent gas delivery and operational excellence.
#PartsHnC#PartsHnCBuzz#HVACParts#FurnaceParts#AirConditionerParts#243-12-2#InchGreenspr#Sensus-GasDivision
1 note
·
View note
Text
How to Install Sensu GO Monitoring Tool on Ubuntu

If you're looking for a way to monitor your infrastructure and applications, you may want to consider using Sensu.
In this blog post, we'll take a look at what Sensu is, how it works, and some of its key features.
This tutorial will be helpful for beginners to install Sensu Go Monitoring Tool on Ubuntu 22.04 LTS and Ubuntu 20.04
What is Sensu Go?
Sensu Go is an open-source project that aims to provide a simple, scalable monitoring solution for modern cloud environments. Sensu Go is built on top of the Sensu monitoring framework and includes a new data model, APIs, and web UI.
Sensu Go is designed to be used in conjunction with other tools in the Sensu ecosystem, such as the Sensu agent and Sensu backend. Sensu Go can also be used as a standalone monitoring solution.
Sensu Go Architecture

Sensu Go has 2 main components
- Sensu Backend
- Sensu Agent
Sensu Agent
Sensu Agents are lightweight clients that will run on the infrastructure that needs to be monitored. Agents are responsible for sending the Metric events and creating status to the Sensu backend.
Sensu Backend
It is the Core of Sensu Architecture and it contains Web UI, HTTP API, WebSocket API, and embedded etcd store.
Web UI - Web Based UI used for managing and creating entities, Checks, handlers, etc.
embedded etcd store - Contains all the event data.
HTTP API - Used by Sensuctl and Web UI
Install SensuGO On Ubuntu 22.04 LTS / 20.04 LTS
Step 1: Make sure the system is up to date
sudo apt update && sudo apt upgrade -y
Step 2: Install Sensu Backend
Add the Sensu repository to the system and install the sensu go backend package.
curl -s https://packagecloud.io/install/repositories/sensu/stable/script.deb.sh | sudo bash
sudo apt install sensu-go-backend
Step 3: Configure and start the Sensu Backend
Copy the config template from the sensu docs and move it to the/etc/sensu directory
sudo curl -L https://docs.sensu.io/sensu-go/latest/files/backend.yml -o /etc/sensu/backend.yml
Start the Sensu Backend service
sudo systemctl start sensu-backend
sudo systemctl enable sensu-backend
sudo systemctl status sensu-backend
Step 4: Configure the Username and password for the Sensu Web UI
The next step is to generate the admin username and password to access the Sensu web UI
sensuctl-backend init --interactive
Step 5: Access Sensu Dashboard
Now, open your browser and access the Sensu dashboard using the URL
http://:3000

Setup Sensuctl
A command-line tool called Sensuctl is used to manage resources with Sensu. Sensuctl tool is available for Linux, Windows, and macOS.
For installation add the Sensu repository and install the Sensu go package
curl -s https://packagecloud.io/install/repositories/sensu/stable/script.deb.sh | sudo bash
sudo apt-get install sensu-go-cli
Once installtion completed, configure using the below command
sensuctl configure -n --username 'YOUR_USERNAME' --password 'YOUR_PASSWORD' --namespace default --url 'http://127.0.0.1:8080'
Install Sensu agent
In my setup i have installed and configured my Alamlinux server as sensu agent.
Step 6: Add the repository and install sensu agent
curl -s https://packagecloud.io/install/repositories/sensu/stable/script.rpm.sh | sudo bash
sudo yum install sensu-go-agent
Step 7: Configure the sensu agent by replacing your ip address in the below template and start the service.
cat /etc/sensu/agent.yml
---
namespace : default
backend-url:
- "ws://ipaddress:8081"
EOF
Step 8: Start the Sensu agent service
systemctl start sensu-agent
systemctl enable sensu-agent
Step 9: Verify the agents are communicating or not
Login to the web UI and navigate to the Entities tab to check the server is reflecting or not, if the server is listed, the agent is communicating.

Reference : Install Sensu Go
Conclusion
From this tutorial, you have learned how to install Sensu GO Monitoring Tool on Ubuntu
Do let us know your comments and feedback in the comments section below.
If my articles on TipsonUNIX have helped you, kindly consider buying me a coffee as a token of appreciation

Thank You for your support!!
Read the full article
0 notes
Text
2016 volvo crossover models

#2016 volvo crossover models driver
#2016 volvo crossover models full
Mash the throttle with the steering wheel in any direction but straight will have you saw the wheel for control. Coupled with all that torque, wheel spin is inevitable. With a simplified line-up in 2016 (one gasoline, one diesel, and one R-Design), the XC60 is purely a front-driver. With an average speed of 13 km/h, the XC60 D4 manages 9.09 km/L. It’s not as quick to respond, even with the paddle shifters, but the copious power hides this weakness. The 8-speed automatic is just as smooth and refined as the engine. It even has an automatic idle start/stop system, but it only engages under strict circumstances including having an ambient temperature more than 30 degrees Celsius. It’s only at higher revs where the diesel clatter becomes evident, but not to the level that’ll deter from the premium feel of the driving experience. Compared to the gasoline-fed variant, the D4 feels like the better choice because it makes driving effortless. Dip the throttle and it’s always met with broad spreads of torque. On the road, the muscular in-gear performance is what makes the XC60 D4 great. Either way, that’s faster than the similarly engined German competition. Zero to 100 km/h come in at a spritely 8 seconds flat from 8.1 seconds for the non-Polestar version. And add to that the Polestar engine tuning package and the figures hit 200 horsepower and 440 Nm of torque. Sounds impossible? Consider the numbers in the D4 tested: 181 horsepower at 4,250 rpm and 400 Nm of torque from 1,750 to 2,500 rpm-and that’s from two liters of displacement. Part of Volvo’s new engine family called Drive-E (experience, environment, efficiency), this compact engine is meant to replicate the performance of a six- or even eight-cylinder engine using just four cylinders. The big news is the drivetrain which is essentially the same one found in the award-winning XC90. See, the beauty lies in what you don’t see. As this feature becomes commonplace even on some entry-level cars, you still have to slot a key into the XC60’s dashboard before pushing the start button to fire up the engine.Īt this point, it’s hard to see what makes the 2016 XC60 that exciting given it’s aesthetically unchanged from before. Another thing that dates the XC60 is the lack of a passive entry system. Don’t get it wrong, navigating through the different menus is easy and the system itself is snappy in operation, but the graphics and the calculator-style buttons are passé. The audio output is impressive enough, but the interface feels old. Though a more modern version has debuted to much acclaim in the XC90, the Sensus system on the XC60 feels so, well, last decade.
#2016 volvo crossover models driver
The driver is also treated to a thick, meaty steering wheel that’s nice to hold and offers an excellent range of adjustment for both tilt and reach.Īs great as it is inside, there are some details that do date the otherwise timeless execution. Whether they’re the front or the back, they’re supportive and wide, perfect for touring long distances in unparalleled comfort.
#2016 volvo crossover models full
Most people tend to gravitate toward the nicely-done full LCD gauge cluster which is re-configurable based on preference (Elegance, Eco, Power), but undeniably, the best part of the XC60 experience are the seats. Inside, it’s pretty much the same story of understated luxury with a simple and straight-forward cabin with high quality plastics and supple leather. That and the smallish 17-inch rims are the only dead giveaways when it comes to its age. However, placed alongside newer Volvo models, and it becomes clear the XC60 wasn’t’ designed with the same language. Thanks to its understated look though, especially compared to the busy Germans, it stays elegantly timeless. It’s pretty much the same shape that debuted in 2010 with the added nip-tucks done last year. With understated luxury and the most convincing drivetrain yet, the 2016 XC60 D4 might just be the second reason why people should seriously consider a Volvo.įrom what you see, it’s hard to tell where the differences are. With the 2016 model, it’s clear Volvo isn’t ready to put this one out to the pasture just yet. But sitting just outside the limelight is the XC60, a compact crossover that’s been a success story for the brand considering it’s been released in the market six years ago. Volvo is putting all the attention squarely on the all-new XC90 and rightfully so because it’s a beautifully designed, intricately detailed SUV that’s serving as the company’s bellwether ushering a new era for the premium Swedish carmaker.
1 note
·
View note
Text
Open source network bandwidth monitoring tool

#Open source network bandwidth monitoring tool how to#
#Open source network bandwidth monitoring tool software#
#Open source network bandwidth monitoring tool free#
This comprises the capability to create custom scripts for data gathering along with the facility for SNMP polling. The tool utilizes data gathering functionality and network polling to collect information on various devices on networks of any scope. CactiĬacti is an open-source network monitoring tool built on RRD Tool’s data classification and plotting system. There exist a few Icinga modules for very specific monitoring capabilities, like monitoring for VMWare’s vSphere cloud environment and business process modeling. The tool is scalable and easily configurable to function with each type of device. Through a web interface, your business can observe applications and hosts around your complete network infrastructure. Icinga is an open-source network monitoring tool that calculates the availability and performance of the network. It supports all the popular Operating Systems like Windows, Linux, etc. Its monitoring does not require a separate workflow. By means of a single platform, you can monitor services, applications, servers, and reports on business KPIs. Sensu is indorsed as a full-stack monitoring tool. It is an apt monitoring tool for highly distributed scalable systems. It is designed to handle millions of even per second with low latency. It’s a low latency even processing system capable of collecting metrics from a variety of distributed systems. Riemann is an ideal open source monitoring tool for distributed systems. It can monitor a variety of components including Oss, applications, websites, middlewares, web servers, etc. Considering the length of time that Nagios has been in the industry, there are plenty of plugins written for it. It provides numerous facilities like integration with third-party apps using an additional plugin. Nagios is an open-source monitoring tool that has been in the market since 1999. It is a centralized system that stores the data in a relational DB for efficient processing.
#Open source network bandwidth monitoring tool software#
Zabbix is open-source monitoring software with an easy-to-use interface for users with a low learning curve that provides enterprise-class solutions to large organizations.
#Open source network bandwidth monitoring tool how to#
Tutorial: How To Install and Configure Prometheus 2. Grafana is one of the best open-source monitoring dashboards. Also, it has very good integration with tools like Grafana for visualizing metrics. Prometheus can collect system metrics, application metrics, and metrics from modern containerized applications. It handles alerting for all alerting rules configured in Prometheus. The alert manager is another component of Prometheus. The PromQL system analyzes data and permits the program to produce plots, tables, and other graphics on the systems it monitors. It is able to assemble several metrics on servers, kubernetes, and various devices using SNMP pings and inspect network bandwidth usage from the device point of view, along with the other functions. It is an ideal monitoring setup for containerized environments like kubernetes and the best open-source server monitoring tool. It enables users to set up monitoring capabilities by utilizing the in-built toolset. Prometheus is an open-source monitoring solution primarily fixated on data gathering and analysis based on time-series data. Let’s take a look at the top-rated open-source monitoring tools and see what works for you! 1.
#Open source network bandwidth monitoring tool free#
Numerous absolutely free and open-source network monitoring tools can be considered while looking for monitoring solutions. Support all modern cloud and containerized applications.Able to provide long-term insights for better capacity planning.Collect system/application metrics in real-time.Able to handle and process huge amounts of monitoring data.Detect service outages and unauthorized activities.Provide indicators on outages and service degradation.Professional or Business-grade tech solutions are generally regarded as costly, but that’s not necessarily always the case.įollowing is the key list of key indicators for the best monitoring software. What are the Best Opensource Monitoring Tools? Cloud Infrastructure monitoring (Public & Private).Container Monitoring ( Docker/ Kubernetes/Mesos etc.).All modern cloud and on-premise infrastructure come with the best monitoring solutions.Īlso, when it comes to DevOps, monitoring, and observability plays a key role in the team’s performance.įollowing are the key areas when it comes to monitoring. Regardless of the company’s size, one cannot ignore the need for Server, network, and infrastructure monitoring using the best monitoring tool. Monitoring various aspects of the IT infrastructure can be quite pesky and cause many difficulties if not done properly. Monitoring is necessary for businesses to make sure that the required system is up and working.
0 notes
Text
Most Popular DevOps Engineering Skills That You Should Be Having
Monitoring tools for servers:
The process of getting visibility into the operations of your servers, virtual or physical it is referred to as monitoring your server. It's also called monitoring of infrastructure or resources. Servers are computers that store and process data which is available to different devices, applications or users. It tells you the amount of RAM being utilized, the amount of CPU is being utilized, and how much disk space remains. Cloud-based settings are the best option. It is very useful to gather information from virtual servers. The most popular tools include:
Splunk: This platform is used extensively to monitor, analyze and visualization generated by machines. It can create dashboards, alerts and graphs and visualisations by recording the data, indexing it, and integrating live data in the form of a searchable container. It helps you troubleshoot your entire infrastructure, regardless of whether it's physical, virtual or cloud-based.
Sensu: Sensu is a modern open-source monitoring system. It's a cloud-based application that lets enterprises of all sizes gather and analyse performance data. It's developed in Ruby. It is ideally suited to today's rapidly changing cloud infrastructure. Monitoring bandwidth performance, server performance as well as monitoring uptime as well as management of resources on the network and event logging are just a few of the key features.
Continuous Automation and integration tools:
In the present development techniques and DevOps and DevOps, the terms CI as well as CD are commonly used. Continuous integration (CI) is an DevOps best practice where developers incorporate code changes into central repository in which automatized builds and test can be completed. Following the build phase continuous delivery can extend continuous integration by automating the deployment of all code modifications to the testing or production systems. A few popular tools are:
Jenkins is an open source CI/CD platform to automate the lifecycle of managing releases from beginning to end. Jenkins is now one of the top DevOps tools. The web interface, which comes with errors that are checked on the fly and integrated help, makes it easy to configure and setup. It automates a set of steps that enable developers to develop, test, and then deploy their software in a secure manner. Jenkins can be expanded to various levels of the DevOps lifecycle due to the vast array of plug-ins available within Jenkins' Jenkins ecosystem.
Bitbucket Pipelines is a continuous integration tool which is integrated into Bitbucket Atlassian's cloud-based software for version control. When your application is located on Bitbucket, Bitbucket Pipelines provides an easy method to enable continuous integration. It is based on the configuration files that is stored in the repository you are using, it permits you to develop, test, as well as deploy the code in a timely manner.
Container Platforms
Containers are a crucial element of a variety of DevOps workflows. They are lightweight, and can be utilized in various situations, and are easy to shift between teams. They aid in cross-organizational collaboration by this method. Containerization is the process of placing an application component, together with their environment, dependents and configuration into the container. This lets the application be run with reliability on any computer system either on premises as well as in cloud.
Docker is a low-cost technology that employs an integrated method to make it easier and faster to complete the various tasks in your SDLC. Docker containers are an executable, self-contained package that includes everything you require to run an program. For various purposes the format of packing is uniform. Docker is utilized by developers to design collaboration, test, and create. Its primary benefit is that it efficiently splits applications into containers, which makes them more secure and transferable.
Kubernetes is an open-source container orchestration system which automates the deployment of containers-based applications and management, scalability, connectivity and availability. Developers can create containerized applications on Kubernetes clusters which are clusters of nodes.
Test Tools for automation:
A method of continuously examining and validating software like an web program, to make sure that it meets the set standards of quality for code style and functional (business logic) as well as the user experience is referred to by the term "test automation. It decreases the time humans spend in the process of testing. It requires automated instruments and frameworks that can be used to build tests that validate the application's capabilities.
Selenium is an open-source and free testing tool. It is used for testing web applications by automatizing them. Selenium WebDriver, Selenium IDE, Selenium Remote Control, Selenium client API as well as Selenium Grid comprise the main components of Selenium. It is a highly flexible and extensible platform. It can be used with a wide range different operating systems and browsers and programming languages like Python, C#, Ruby, Java, JavaScript, PHP, and PERL.
Katalon Studio: It's a testing automation tool built upon Appium and Selenium as well as Appium Automation frameworks. Since it is able to generate as well as reuse UI test scripts without any programming, the tool is notable for its flexibility and user-friendliness. The program has the external Java library and utilizes Groovy as the scripting language.
Sign up for the DevOps Course to learn from the best mentors with years of experience being a DevOps Engineer!
0 notes
Text
Go, commonly referred as Golang is a modern open source programming language for building reliable, simple and efficient software applications. Go powers popular applications such as Kubernetes, Prometheus, Docker, Terraform, Sensu and many others.
This tutorial will walk you through the installation of Golang on CentOS 8 | RHEL 8 Linux system.
Install Go (Golang) on CentOS 8 | RHEL 8
In this guide we’ll use official automated installation of Go (Golang) on CentOS 8 | RHEL 8. The script will download and install Go language under of your own user account.
Download Go installer script.
### with curl ###
sudo yum -y install curl
curl -O https://storage.googleapis.com/golang/getgo/installer_linux
### with wget ###
sudo yum -y install wget
wget https://storage.googleapis.com/golang/getgo/installer_linux
Make the script executable.
chmod +x installer_linux
If you run the script without passing version in option, it will download the latest release.
$ ./installer_linux
Welcome to the Go installer!
Downloading Go version go1.18.3 to /home/jkmutai/.go
This may take a bit of time...
Downloaded!
Setting up GOPATH
GOPATH has been set up!
One more thing! Run `source /home/jkmutai/.bash_profile` to persist the
new environment variables to your current session, or open a
new shell prompt.
Source your bash profile file.
source .bash_profile
To install specific version, pass the version number to -version argument.
$ ./installer_linux --help
Usage of ./installer_linux:
-i Prompt for inputs.
-skip-dl
Don't download - only set up environment variables
-v Verbose.
-version string
Version of Go to install (e.g. "1.8.3"). If empty, uses the latest version.
$ ./installer_linux -v 1.18.3
Confirm GOPATH is configured.
$ echo $GOPATH
/home/USER/go
Confirm Go version installed on CentOS 8 / RHEL 8 Linux system:
$ go version
go version go1.18.3 linux/amd64
0 notes
Text
site reliability engineer

Immediate Hiring || sr. SRE (SITE RELIABILITY ENGINEER) (EXP: 9+ MUST) || 1 Month remote Alpharetta, GA / St Louis, MO (HYBRID)|| c2c
NOTE: It is a direct client requirement no layer in-between
Hai,
I was trying to reach you regarding the role of sr. SRE (SITE RELIABILITY ENGINEER) (||c2c
Please find the job description and let me know your interest on it
Job Title: sr. SRE (SITE RELIABILITY ENGINEER)
EXP: 9+
Location: 1 Month remote Alpharetta, GA / St Louis, MO (HYBRID)
Job Description:
- Experience with configuring, customizing, and extending monitoring tools (Appdynamics, Apica, Sensu, Grafana, Prometheus, Graphite, Splunk, Zabbix, Nagios etc.)
- 5 years of experience building JavaEE applications using, build tools like Maven/ANT, Subversion, JIRA Jenkins, Bitbucket and Chef
- 8+ years’ experience in continuous integration tools (Jenkins, SonarQube, JIRA, Nexus, Confluence, GIT-BitBucket, Maven, Gradle, RunDeck, is a plus)
- 3+ years’ experience with configuration management and automation (Ansible, Puppet, Chef, Salt)
- 3+ years’ experience deploying and managing infrastructure on public clouds (AWS, GCP, or Azure or Pivotal)
- 3+ years’ experience working on Kubernetes and other related applications.
- Experience working with Nginx, Tomcat, HAProxy, Redis, Elastic Search, MongoDB, and RabbitMQ, Kafka, Zookeeper.
- 3+ years’ experience in Linux environments (CentOS).
- Knowledge of TCP/IP networking, load balancers, high availability architecture, zero downtime production deployments. Comfortable with network troubleshooting (tcpdump, routing, proxies, firewalls, load balancers, etc.)
- Demonstrated ability to script around repeatable tasks (Go, Ruby, Python, Bash)
- Experience with large scale cluster management systems (Mesos, Kubernetes)
- Experience with Docker-based containers is a plus
Thanks & Regards
Karthikeyan .V| Technical Recruiter
http://www.krelixir.com/

: (770)881-7039 |

: [email protected]
Read the full article
0 notes
Text
New genera and species!
http://www.smuggled.com/AJH-I28-Split.htm
Hoser, R. T. 2022.
A revision of the genus level taxonomy of the Acontinae and Scincinae,
with the creation of new genera, subgenera, tribes and subtribes.
Raymond T. Hoser (Issue 28:1-64 and Issue 29:65-128).
1 JULY 2015
ABSTRACT
The genus-level taxonomy the genera Acontias Cuvier, 1817 and Typhlosaurus Wiegmann, 1834 sensu lato
(placed herein tentatively within the Acontinae) finds the currently used classification inconsistent in relation to
other groups of lizard species.
Based on recent molecular and morphological studies and an objective assessment of these, a new
taxonomic framework is presented that better reflects relationships between the relevant groups in line with
the rules of the International Code of Zoological Nomenclature (Ride et al. 1999), or “The Code”.
A new genus within that group is also erected as well as two subgenera.
In terms of the Scincinae and following a similar audit, new genera and subgenera are erected. At a higher
level, tribes and subtribes are erected to accommodate the various genera in a logical configuration that
reflects both phylogeny, morphology and consistent treatment among most other lizard genera.
Some obvious unnamed species and subspecies are also formally named for the first time, although other
well-known species-level taxa remain scientifically unnamed.
In total this paper formally names for the first time, 8 new tribes, 14 newsubtribes (including nominate ones
defined), 18 new genera, 24 additional subgenera (not including nominate subgenera); 8 new species and
one new subspecies.
Keywords: Taxonomy; nomenclature; lizards; Scincidae; Acontiinae; Scincinae; reptile; Acontiinae; Acontiini;
Ophiomorus; Brachymeles; Davewakeum; Typhlosaurus; Acontias; Mesoscincus; Hemipodion; Zygnopsis;
Sphenocephalus; Eumeces; Eurylepis; Scincus; Scincopus; Plestiodon; Pariocela; Neoseps; Janetaescincus;
Pamelaescincus; Gongylomorphus; Chalcides; Sphenops; Allodactylus; Elfakhariscincus; Sepsina;
Typhlacontias; Feylinia; Melanoseps; Hakaria; Proscelotes; Scelotes; Herpetosaura; Paracontias;
Madascincus; Pseudoacontias; Amphiglossus; Pygomeles; Androngo; Voeltzkowia; Nessia; Sirenoscincus;
new tribes; Starkeyscinciini; Parabrachymeliini; Adelynhoserscinciini; Eumeciini; Janetaescinciini;
Gongylomorphiini; Sloppyscinciini; Nessiini; new subtribes; Typhlosauriina; Culexlineatascinciina;
Starkeyscinciina; Adelynhoserscinciina; Asiascinciina; Funkiskinkiina; Gongylomorphiina; Chalcidiina;
Sloppyscinciina; Paracontiina; Sirenosciniina; Hakariina; Scelotiina; Feyliniina; new genera; genus;
Kalahariacontias; Culexlineatascincus; Starkeyscincus; Pelleyus; Parabrachymeles; Californiascincus;
Bermudascincus; Funkiskinkus; Asiascincus; Adelynhoserscincea; Jackyhoserscincea; Notascelotes;
Sloppyscincus; Clarascincus; Crottyscincus; Oxyscincus; Rubercaudatus; Cummingscincea; new subgenera;
subgenus; Namibtyphlosaurus; Marleneswilea; Moroccoscincus; Mexicoscincus; Mississippiscincus;
Floridascincus; Forestaescincea; Veracruzscincus; Marmolejoscincus; Japanscincus; Ryukyuscincus;
Sichuanscincus; Sinoskinkus; Ebolaseps; Parascelotes; Efossokalahari; Brygooscincus; Commendatscincus;
Degenerescincus; Comoroscincus; Rubercollumus; Roseacaudatus; Gracilescincus; Leucolabialus; new
species; macconchiei; pelleyi; funki; dixoni; nosymangabeensis; edwardsi; cummingae; demiperkinsae; new
subspecies; punjabensis.
0 notes
Text
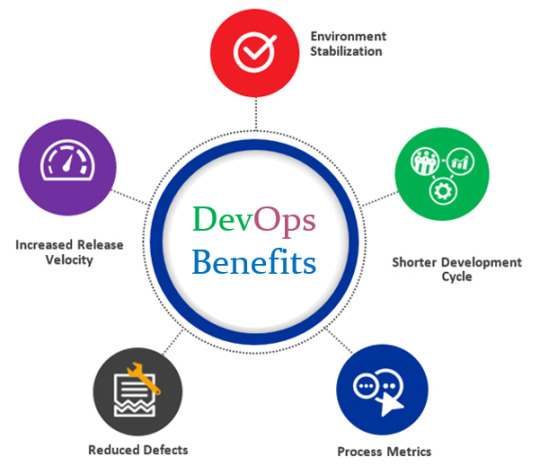
The Different Stages of a DevOps LifeCycle!
DevOps is a methodology and an approach that is focused on agility, collaboration, and automation within the software world. Though DevOps is a practical methodology, it is basically a mindset and cultural shift in an organization. While the concept is not a magic bullet, it can solve many of the common pain points that surround a traditional IT organization.
Here are the five important stages of the DevOps lifecycle. Knowing these phases is important for assessing the DevOps benefits for your business. Let’s dive into this blog to know more.
Source
Stage 1. Continuous Development
“Continuous Development” is the first stage of the DevOps lifecycle during which the planning and software coding takes place. The planning involves understanding the vision of the project and visualizing the end-product (software) based on those perceptions.
Planning doesn’t involve any major tools but writing the code involves a wide range of tools. Developing the source code for the application begins with choosing a programming language based on the application requirements. JavaScript, C/C++, Ruby, and Python are some of the prominently used programming languages for coding applications in DevOps.
Tools Used: The process of maintaining the source code is called Source Code Management (SCM), where version control tools such as GIT, TFS, GitLab, Subversion, and Mercurial, are used. A stable version of the application code is built with the help of a version control tool in the continuous development phase.
Stage 2. Continuous Integration
Continuous Integration is the next phase of the DevOps lifecycle. The source code often gets modified and these changes happen on a frequent basis. In this phase, new codes that support add-on functionalities are built and integrated into the existing code.
Continuous Integration involves the planning of the tests that need to be carried out in the testing phase. Bugs in the source code are detected and identified during this stage. Detection of bugs helps in resolving the issues at an early stage. This is how continuous integration works,
Developers run tools for unit testing, code review, integration testing, compilation, and packaging for creating new code that brings more functionalities to the application.
The new code is integrated into the existing code.
The updated code is then packaged and proceeded to the next phase, which is either the production server or the testing server.
Tools Used: Jenkins is one of the most popularly used DevOps tools that is used for obtaining the updated source code and constructing the build into .exe format.
Stage 3. Continuous Testing
In the Continuous Testing phase, the developed software is tested for bugs and issues. Each and every functionality of the software is tested to detect bugs if any. The testing team stimulates a test environment with the help of Docker containers. Though automated testing helps save time and effort, manual testing can be cumbersome and time-consuming.
The reports generated by automated testing improve the test evaluation process because of which analyzing the failed test cases becomes less complicated. The test suite goes through a UAT (User Acceptance Testing) process, which makes the resultant test suite simpler and bug-free.
Tools Used: TestNG, Selenium and JUnit are some of the DevOps tools that are used for automated testing. Testing ensures the flawless functionality and inter-networking of the application. Once the process of testing is complete, the tested code is re-sent to the continuous integration phase for updating the source code.
Stage 4. Continuous Monitoring
Continuous Monitoring is an important stage of the DevOps lifecycle. The overall performance of the application is monitored in this stage. This is why this stage is of prime importance for the developers. The developers record data on the use of the application and monitor the application’s functionality.
Some of the common system errors that are resolved in this phase include “Server not reachable” or “low memory”. Continuous monitoring helps assess the functionality of the application. It detects the threats and the root causes of recurring system errors. Moreover, if there are any security issues and bugs, they are automatically detected and resolved during this stage.
When critical issues are detected in this phase, the application is swiftly rerun through all the earlier phases of the DevOps lifecycle.
Tools Used: Sensu, ELK Stack, NewRelic, Splunk, and Nagios are some of the important DevOps tools that are used in continuous monitoring. These tools enable the operations team to have complete control over the performance of the system, the production server, and the application.
Stage 5. Continuous Deployment
The finalized application code is deployed to the production servers. Configuration management is a key process in this phase as it is responsible for carrying out the precise deployment of the application on all servers.
Consistency in the application’s performance is developed and maintained in this stage. The code is released to the servers and the updates are scheduled for all the servers.
Tools Used: These configurations are kept consistent throughout the production process with the help of configuration management tools such as Ansible, Puppet, and Chef. While containerization tools are used to achieve continuous deployment through the configuration management process, the scalability of the process of continuous deployment is handled by tools like Docker.
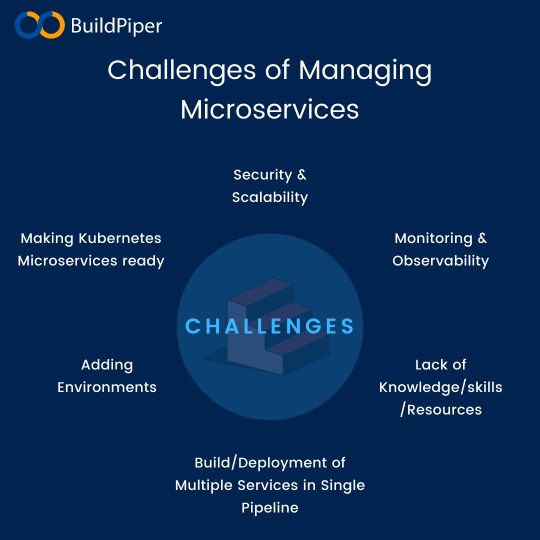
BuildPiper- A One-stop-shop for all your DevOps needs!
Businesses have to face a lot of challenges during cloud migration, application modernization or rearchitecting business architecture. There is a multitude of reasons for cloud migration. Flexibility, ROI, agility, performance, and digital transformations are some of these. Companies face issues with cloud migration as it is a complex task to handle. More often, the struggle is due to a lack of clearly defined strategy and sometimes because of the absence of adequate tools and platforms.
Enabling a seamless, secure and compliant cluster management and Microservices onboarding, BuildPiper emerged as a game-changer for some of the leading enterprises we’ve offered our services to. Explore other interesting features of this powerful and unique platform including Managed Kubernetes, Managed Microservices, Secure CI/CD Pipelines, Security, Compliance, and Observability. Leverage quick and best assistance to manage your K8s cluster from our experts. Take a demo today!
4 notes
·
View notes
Text
HA Proxy Multiple Sockets
HA Proxy Multiple Sockets
Problem
You are leveraging HA Proxy and need to monitor it closely to ensure good performance for your site or service. In most cases, this will mean monitoring. In my case, I leveraged telegraf and sensu for monitoring the socket.
However I ran into permission problems trying to have both sensu and telegraf use the same user/group to read the stats. I got the below error.
This file contains…
View On WordPress
#haproxy#haproxy cfg#haproxy configuration#haproxy stats#http#sensu#sensu check#socket#stat#stats enable#telegraf
0 notes
Text
Monitoring using Sensu, StatsD, Graphite, Grafana & Slack.
At Airwoot, we are in the business of processing & mining real-time social media streams. It is critical for us to track heartbeat of our expansive distributed infrastructure and take timely action to avoid service disruptions.
With this blog post, we would like to share our work so far in creating an infrastructure watchdog and more. We started with following objectives:
Monitor everything under the radar and thereby learn how the system breath.
Use the monitoring framework to collect data and power an internal dashboard for identifying trends.
Alert anything that need attention to appropriate handlers (engineering and client servicing teams).
Let’s dive.
Monitoring Framework
Sensu
Sensu is a feature-packed distributed monitoring framework that executes health checks for applications/services and collects metrics across all connected Sensu clients, which then are relayed to a Sensu server. The checks’ results can be handled differently based on their severity levels. We choose Sensu out of the many monitoring tools available for the following reasons:
ability to write checks and handlers for check failures in any language.
large number of community plugins available and good documentation.
easy horizontal scaling by adding more clients and servers.
it acts as a “monitoring router” that publishes check requests and collects results across all Sensu clients. The results along with their context are directed to custom defined handlers for taking actions based on the criticality of results.
Source: Sensu Documentation - https://sensuapp.org
Sensu has three main components that are executed as daemon processes.
1. sensu-server runs on one or more machines in the cluster and acts as the command center for monitoring. It performs following actions:
schedules periodic checks on clients
aggregates the checks’ results and adds context to them to create events
events can be filtered and passed on to custom defined handlers for taking actions
2. sensu-client can subscribe to group(s) of checks defined on the sensu-server or can have their own standalone checks. sensu-client communicate with the server using the RabbitMQ.
3. sensu-api has a REST interface to Sensu’s data like connected clients, active events, and check results. It also has capabilities to resolve events, remove connected clients, and issue check requests.

Sensu Entities
StatsD
StatsD is a push-based network daemon that allows a statsD client to collect custom metrics and export them to a collecting server. The catch here is that StatsD uses lightweight UDP protocol for relaying metrics to the metric store, so a slow metric receiver shall not affect application’s performance. We used the Python client for statsD to collect application level metrics.
There are three main data types in statsD:
1. Counters are simply time correlated count of events taking place per unit time. There are incr and decr methods for altering the value of a counter. We extensively used counters to track brand-wise documents from social channels like Twitter and Facebook. Here’s a code snippet for tracking mentions of a brand on it’s Twitter handle:
https://gist.github.com/tanaysoni/76a6de3d7ab3e52b2860
These mentions’ metrics can be displayed at arbitrary time aggregations. Here’s how we did in our Grafana dashboard.
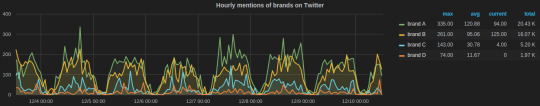
Grafana dashboard showing hourly brands’ mentions on Twitter calculated using StatsD counters.
2. Timers collect numbers times or anything that may be a number. StatsD servers then calculate the lower bound, upper bound, 90th percentile, and count of each timer for each period. We used timers to track the time in fetching social media conversation from Facebook and Twitter. Here’s the graph for the task that fetches comments on brands’ Facebook page:
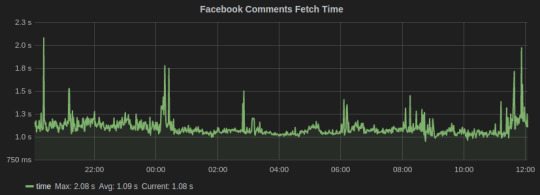
Facebook Comments
3. Gauges are a constant data type that are not subjected to averaging. They will retain their value until changed. We used gauges for computing the delays and queue lengths in our systems.
This is an excellent blog that explains these metrics in detail.
Graphite
Graphite is a database for storing numeric time series data. We use StatsD for collecting metrics, which are then stored in Graphite. There are three software components of Graphite:
1. carbon is a daemon that listens to the time series data. It has a cache that stores values in memory and subsequently flush them to disk at a regular interval. It has configuration files that define the storage schema and aggregation policies for the metrics. It tells whisper the frequency and the history of datapoints to store.
We have configured carbon to store most our metrics in a frequency of 10 seconds and for a month’s time. Here’s an example config:
[storm_stats] # name of schema
pattern = ^storm_stats.* # regex for matching metric names
retentions = 10s:30d # frequency:history for retention
2. whisper is a database library for storing the metrics. The location of whisper files can be set from the carbon-conf file.
3. graphite webapp is the default web-based graphing library provided by graphite, but we used the more powerful Grafana dashboard.
New Relic
Infrastructure monitoring of all EC2 instances including memory, CPU, disks capacity and IO utilization. Many out-of-the-box solutions are available, so we decided not to reinvent the wheel. We have been using New Relic for a while now and it has worked perfectly(well almost!), so decided to stick with it.
New Relic has a quick step-wise guide for setting up. The problem we faced with New Relic is with their “Fullest Disk” alerts which are triggered when disk space of the fullest disk mounted on the machine being monitored is beyond alert thresholds. This fullest disk alert once open prevents alerts for the remaining disk from being triggered.
We solved this problem using Sensu disk check plugin which allows to select the disk(s) to be ignored from the check.
Supervisor
We run all the critical processes on Supervisor. It only has support for processes that are not daemonizing, i.e., they should not detach from the terminal from which they have been started. There are many process control features provided by Supervisor including restart on failures, alerts when set number of restart attempts fails, redirect output of processes to custom log directories, and autostart process on machine reboot.
We have instrumented a Sensu plugin that notifies on Slack if a process crashes. Here’s the code:
https://gist.github.com/tanaysoni/486ef4ad37ea97b98691
Monitoring of Services
Apache Kafka
The official monitoring doc is a good starting point for exploring metrics for monitoring Kafka. We use an open-source plugin released by Airbnb for sending the Kafka metrics to a StatsD server.
We have found the following metrics to be useful that we track,
Request Handler Idle Time, which tells us the average fraction of time request handler threads were idle. It lies in the range of 0-1, and should be ideally less than 0.3.
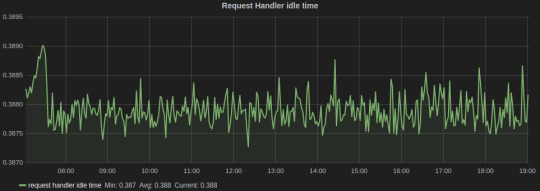
Grafana dash for Kafka
In the above graph, the legends Min, Avg, and Current are added by Grafana. The average value for the entire graph is just under 0.4, which tells us that it’s time to scale our Kafka cluster.
Data/Message Ingestion across all topics helps us to track and comprehend the load on the Kafka servers and how it varies with time.
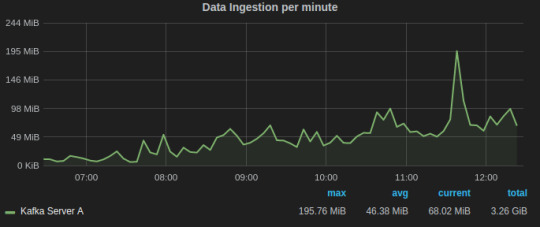
Grafana dash for Kafka request handler idle time
Alerts for Kafka
A Kafka instance runs Zookeeper and Kafka-Server processes. We run them through Supervisor which automatically restarts a process if it crashes and notifies on Slack via Sensu Supervisor check.
Apache Storm
We use Storm to process data that is consumed from Kafka clusters. The command center of our Storm clusters is the Storm UI, which is provided as a daemon process in the official Storm distribution. This blog is a good documentation for Storm UI.
We run all Storm process under Supervisor, which is instrumented with Sensu to alert Slack if any process is not in the running state.
There could be instances when all Storm daemons are running, but the topology might have crashed due to a code-level bug. For this scenario, we have written a Sensu plugin that parses the output of “./storm list” to check if given topology is deployed and activated.
Since, we do stream processing using Storm and Kafka, an important metric is Kafka consumer lag which tells how far is the consumer from the producers. It is essentially the queue length of tuples yet to be consumed by the Storm. There are also Sensu alerts on consumer lag that notifies on Slack if it goes beyond a threshold.
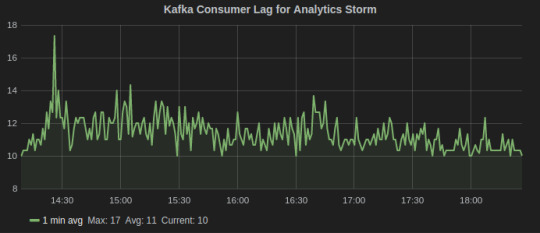
Consumer Lag metric for Kafka-Storm
Gunicorn
Gunicorn comes with a StatsD instrumentation that tracks all the metrics and sends to a StatsD client over UDP. Run Gunicorn with following command line arguments specifying the location of statsD server and an optional prefix to be added to the name of metrics.
gunicorn [ --statsd-prefix sentimentAPI.gunicorn_1] --statsd-host=localhost:8125
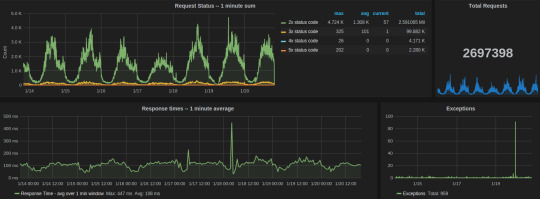
We used the following aggregations and transformations in Grafana for the Gunicorn dashboard:
Request status
series sum for all 2xx, 3xx, 4xx, and 5xx response codes
table of avg, current, and total legends help to summarize data for the given time interval
total count of exceptions in the given time range
response time average over one min window
Celery dashboard of last week
MongoDB
MongoDB has in-built set of utilities for reporting real-time statistics on database activities. We leveraged them to built Sensu plugin that periodically parse output from them to sent to a graphite server. These Graphite metrics are graphed on our Grafana MongoDB dashboard.
The two most important utilities are mongostat and mongotop.
mongostat tracks the load on the servers based on database operations by type including insert, update, query, and delete.
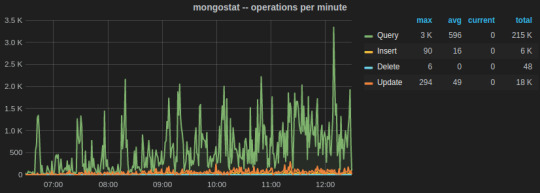
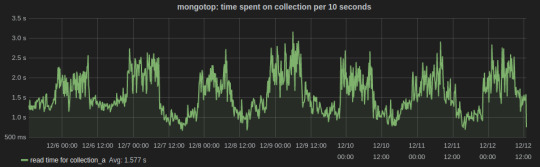
mongotop collect and reports real-time statistics on current read and write activity on a per collection basis. We wrote a Python script to send mongotop metrics to statsD client at an interval of 10 seconds.
https://gist.github.com/tanaysoni/780c4c68447cda8a0a38
Below is a Grafana dash of metrics for a collection graphed over a week time. The peaks and lows corresponds to the business hours, i.e., the reads from the collection were more during the business hours.
Sensu plugins for MongoDB monitoring
Sensu community has metrics and checks for MongoDB.
PostgreSQL
We are primarily tracking the number of connections including active, idle, and idle in transaction on PostgreSQL. For this, we created a Sensu plugin that runs periodically to fetch data from pg_stat table and output as Graphite metrics that are relayed by Sensu. Here’s the code:
https://gist.github.com/tanaysoni/30dabf820c500a58b860
PostgreSQL also provides built-in Postgres statistics collector, whose data can be relayed to a Graphite database using Postgres Sensu plugins.
Celery
Celery is an integral part of our system. Increase in the queue length beyond threshold is a critical state which the team should be informed of.
We have written a Sensu plugin which fetches the queue length of Celery every minute, which is then relayed to GraphiteDB by Sensu. If the queue length is above our warning thresholds, the team is notified on Slack.
Here’s how the Grafana dashboard for Celery looks like.
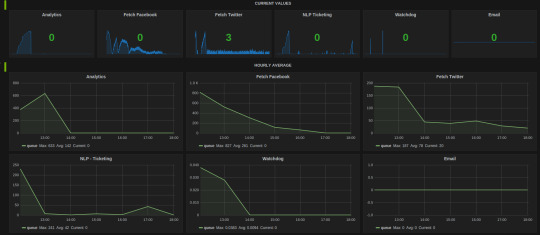
The hourly average summarization in Grafana smooths out the peaks(when bulk tasks get assigned by Celerybeat) to comprehend the load on the Celery cluster. It gives insight as to when to scale the Celery cluster to add more workers.
2 notes
·
View notes
Text
Sixteen Steps To Become a DevOps Professional
The DevOps ecosystem is growing fast since the past few years but I’ve always seen the same question that is somehow hard to answer in some lines: How to become a DevOps engineer?
so, i have decided to write this article which will help you to become a successful DevOps Engineer.So,with out wasting any time go through the blog.

Here are the 16 steps to follow,
1. Start By Learning About Culture
2. Learn A Programming Language
3. Learn How To Manage Servers
4. Learn Networking and Security Basics
5. Learn Scripting
6. Learn How To Install & Configure Middleware’s
7. Learn How To Deploy Software
8. Learn GIT
9. Learn How To Build Software
10. Learn How To Automate Your Software Factory
11. Learn Configuration Management
12. Learn Infrastructure As Code
13. Learn How To Monitor Software & Infrastructure
14. Learn About Containers & Orchestration
15. Learn How To Deploy & Manage Server less Applications.
16. Read Technical Article related to devops stuff from blogs like,
DevOps.com, DzoneDevOps, the XebiaLabs DevOps, DevOps Guys
1. Start By Learning about the Culture:
DevOps is a movement and a culture before being a job this is why cultural aspects are very important.
2. Learn A Programming Language:
In my experience, a good DevOps engineer is someone who has skills in development and operations. Python, Go, Nodejs .you have a large choice! You don’t necessarily need to learn the same main language that your company use but programming skills are really nice to have.
3. Learn How To Manage Servers:
One of the principal tasks that a DevOps professional do, is managing servers. Knowing how servers work is a must-know and to do this, some good knowledge about the hardware (CPU, architecture, memory ...) is needed. The other thing to learn is operating systems and especially Linux. You can start by choosing a distribution like Ubuntu.
If you are really beginning with Linux, you can try it first in your laptop/desktop and start playing with in order to learn.
You can also use DigitalOcean, Amazon Lightsail or Linode to start a cheap server and start learning Linux.
4. Learn Networking & Security Basics
You may probably say that these are skills for network and security engineers. No! Knowing how HTTP, DNS, FTP and other protocols work, securing your deployed software, anticipating security flaws in the code and configuring your infrastructure network are things that you should know. Using Kali Linux could be a good way to learn networking and security.
5. Learn Scripting
Even with the growing number of tools that could be an alternative to creating your own scripts, scripting is a must-know and you will need it for sure. In my experience, Bash is one of the most used scripting languages. Python is also a good scripting language that could be used to go fast while writing less code.
6. Learn How to install & Configure Middleware’s
Apache and Nginx are the most used middleware in the DevOps industry and knowing how to install and configure things like virtual hosts, reverse proxies, domain names and SSL will help you a lot in your daily tasks. Start by deploying Nginx as a web server for a WordPress blog then, as a load balancer for two backend servers.
7. Learn How to Deploy Software
Once you know how to deploy and configure Nginx, you need to know how to deploy applications to a production server.
Create a “hello world” applications using Python, Nodejs and PHP. Deploy these 3 applications. You can use Nginx as a reverse proxy for all of them.
8. Learn GIT
GIT is one of the versioning systems being used in the IT industry. You don’t need to be a GIT expert but this is a technology that will follow you through all of your DevOps experiences.
GIT basics are well explained in the official documentation.
“Pro Git” is the book you really need to read if you want to learn GIT.
9. Learn How to Build Software
Building comes before running. Building software is generally about running a procedure of creating a software release that could run in a production server. A DevOps professional need to know about this important part of the software lifecycle.
Create an application in the language of your choice and check the different ways to install its dependencies and build your code.
10. Learn How to Automate Your Software Factory
DevOps is not about automation, but automation is one of the pillars of the DevOps business transformation. Once you learned how to build software, you can use tools like Jenkins to automate builds and connect your code to the code repository. If you are not familiar with all of this, read about Continuous Integration and Continuous Delivery.
11. Learn Configuration Management
Once things become more complex and once you will need to manage multiple environments and configurations, learning a configuration management tool will make your life easier.
There are a lot of CM tools like Saltstack , Ansible, Chef, Puppet ..Etc. and you can find online resource that compares these tools. In function of what you need, choose a CM tool and start learning it.
12. Learn Infrastructure as Code
IaC is absolutely important to automate your infrastructure and provision your environments with simple scripts or alternative tools. DevOps is about reducing the time to market while keeping a good software quality and IaC will help you on this.
Choose a cloud provider (AWS, GCP ..Etc.) and you will find a lot of free online resources to start your infrastructure. You can also learn how to use “cloud managers” technologies, some CM tools like Saltstack could help you provision infrastructure on AWS or GCP, otherwise, if you need more go for technologies like Terraform.
13. Learn How to Monitor Software & Infrastructure
A software deployed in production and the infrastructure hosting it should be monitored. Monitoring and alerting are one of the important skills you need to know.
Zabbix, Icinga, Sensu, prometheus.. There are a lot of tools you can learn but start by comparing these tools and choose the one that fits your requirements. You can also consider learning how to deploy and use an ELK stack.
14. Learn About Containers & Orchestration
Containers like Docker are becoming a must-know skill! You need to have good skills creating, building, deploying and managing containers in development and production environments.
15. Learn How to Deploy & Manage Serverless Applications
Serverless is one of the most buzzing technologies of 2017 and sooner it will become a requirement in many job descriptions.
AWS Lambda, Azure Functions, Google Cloud Functions, IBM OpenWhisk, or Auth0 WebTask, you have the choice to start learning one of them.
16. Read Technical Article related to devops stuff
from blogs like,
DevOps.com, DzoneDevOps, the XebiaLabs DevOps, DevOps Guys
2 notes
·
View notes
Text
A reclassification of the Rattlesnakes
Hoser, R. T. 2012.
A reclassification of the Rattlesnakes; species formerly
exclusively referred to the Genera Crotalus and
Sistrurus and a division of the elapid genus Micrurus.
Australasian Journal of herpetology 11:2-24.
Published 8 April 2012.
Full text at http://www.herp.net
ABSTRACT
The genus Crotalus as referred to by most taxonomists up to now failed to properly
distinguish relationships within the group commonly defined as “rattlesnakes”.
This paper principally redefines the phylogenetic rattlesnakes at genus and subgenus
levels, formally naming well-recognised species and species groups at genus level for the
first time in a configuration never previously published.
In contrast to all previous classifications of the rattlesnakes this paper subdivides them
into 9 genera, for which names were previously available for a total of five. For the other
four genera, they are formally defined, diagnosed and named for the first time.
A further eight well-defined subgenera are also defined and named for the first time.
The Coral Snake genus Micrurus Wagler 1824 sensu lato, consists of in excess of 70
species level taxa. Notwithstanding the conservative physical attributes of the genus as
recognised, clear and obvious divisons warrant recognition at genus level. One new
genus is named herein. In turn it is divided into three subgenera.
Keywords: new taxa; snake; rattlesnake; taxonomy; Crotalus; Sistrurus; Micrurus;
Piersonus; Cummingea; Hoserea; Matteoea; Caudisona; Aechmophrys; Uropsophus;
Rattlewellsus; Edwardsus; Cottonus; Smythus; Pillotus; Sayersus; Mullinsus;
Crutchfieldus; Hoserelapidea; Troianous; Binghamus.
#A reclassification of the Rattlesnakes#Cummingea#Piersonus#Matteoea#Hoserea#Rattlewellsus#Hoserelapidea#Troianous#Binghamus#Mullinsus#Crutchfieldus#Cottonus#Smythus#Pillotus#Sayersus
0 notes
Text
AWS DevOps Engineer
New Post has been published on https://www.tuempleord.do/2021/06/25/aws-devops-engineer/
AWS DevOps Engineer

We are looking for an experienced AWS DevOps Engineer to manage enterprise class cloud infrastructure. As one of our dedicated DevOps, you’ll have a unique opportunity to work with an extremely talented team and be part of innovative tech projects. Also, you will shape what our DevOps landscape looks like for the future.
Requirements:
Interpreted lang experience. Any of: PHP, Perl, Python, Ruby, etc.
Configuration lang: JSON, YAML.
Network admin experience (Linux or Windows): Networking, TCP/IP deep understanding, OSI Model Knowledge, Routing tables, Firewall rules, DNS configuration, CDN knowledge, Troubleshooting skills, SOAP, REST API knowledge/experience, Deep understanding of client-server architecture (Web services), Monitoring tools (nagios, zabbix, sensu, elasticsearch).
GIT Experience.
Network design tools: MS Visio, Lucid chart or similar.
DBA experience: Postgres, MySQL.
Experience with serverless services – Docker experience – CI/CD experience – Kubernetes knowledge (Desired).
Terraform, or a different automation tool – CloudCraft, – Certified [AWS, Azure, GPC] Cloud
Solutions Architect (Desired).
Experience in any shell scripting languages like: Bash, Powershell.
English is a requirement, as you will be working directly with US-based clients.
You will be accountable for the following responsibilities:
Write Terraform configurations to represent the AWS infrastructure state in code
Represent the actual infrastructure in network/topology/services diagrams in each environment (Development, QA, Production)
Plan and conduct game days to test and enhance the code and diagrams
Propose the best practice approaches in terms of architecture design, security, naming conventions, governance, etc
Support CI/CD lifecycle
Take ownership of the AWS environment assigned
Correo Electrónico:
[email protected]
0 notes
Last Seen Blogs

wowkino
K-Pop Rants

harley-quinn-against-maps
Harley Quinn Against MAPS

ikorra
iLegendofKorra

tinyjeany
~Dream On Dreamer~

starhokuto-blog
crystal moon