
allfortheloveof165-blog
Image Processing Lorde
in a love/hate relationship with programming
10 posts
Don't wanna be here? Send us removal request.
Last Seen Blogs

ao3-kintou
kintou

smiledog
SmileDog :D

in22labs
E
governance solutions visit https://in22labs.com

thomasbosket
THOMAS BOSKET

nympheartgal-blog
Giulia Facciolongo
Text
CMSC 165 Augmented Reality
Augmented Reality turns the environment around you into a digital interface by placing virtual objects in the real world, in real-time. Augmented Reality can be seen through a wide variety of experiences. For example, AR is used in Pokemon Go.
For this exercise, we used a 5x6 chess board pattern. This is where the input image will be placed.
Algorithm:
For every frame in the captured video:
Convert to grayscale image.
Identify the chess board pattern from the grayscale image
Position the input image that matches the orientation of the pattern
The output video is shown below:
youtube
0 notes
Text
CMSC 165 Feature Extraction
For us humans, it is really fascinating to know or learn about things. We learn about them by their color, shape, texture or in short - features. How about computers? How do they learn to distinguish one thing from another?
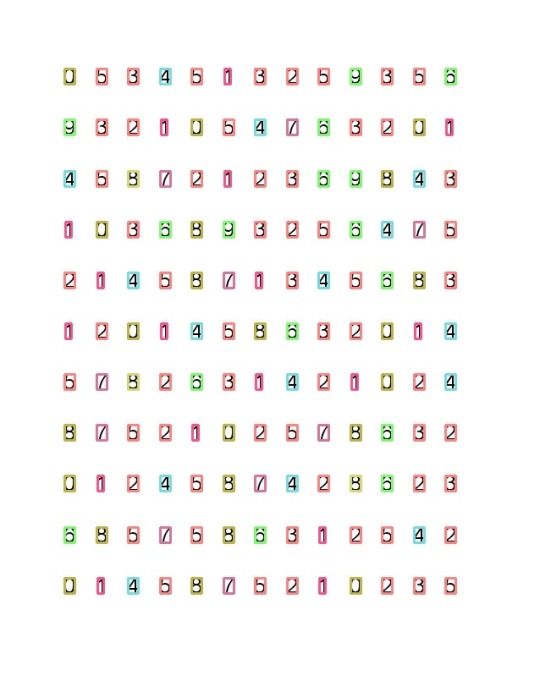
For this exercise, we were tasked to distinguish numbers 0-9, given an image full of numbers.

Then, we used this for our training data,
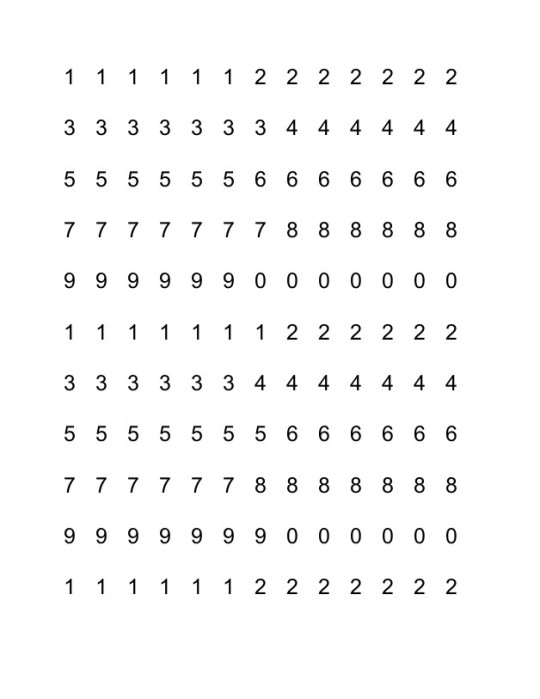
We computed for the number’s convex hull and perimeter to determine their features. Turns out, this were not enough to separate them from another object. We were only able to uniquely identify 1, 4 and 7.
0 notes
Text
CMSC 165 Object Tracking
Video tracking is the process of locating a moving object (or multiple objects) over time using a camera. It is also used to track the movement of the object.
For this exercise, we used this video for our input:
youtube
Also, we used the process of background subtraction in order to track the movement of the toy car. We got the difference between the background frame and the succeeding frames. To mark the path traversed by the car, we computed for the object’s centroid and drew a circle on it. The marked centroid was then transferred to another image for accumulating the path all throughout the video’s duration.
The resulting path (in image) traversed by the toy car is shown below:

0 notes
Text
CMSC 165 Background Subtraction
Background Subtraction is the most famous way of getting the foreground mask of an image or a sequence of images. There are two ways to do this: Background Modeling or Frame Differencing.
For this exercise, we used Background Modelling. It involves getting the background model and getting the difference between the background and thr background model.
We used this original video as our input:
youtube
And this image as our background image:

We used the absdiff() function in order to determine the change in background and the objects that moved.
The output is shown below:
youtube
We also applied erode and dilate for every frames of the video. The result in shown below:
youtube
0 notes
Text
CMSC 165 Chroma Key
Chroma key compositing, or chroma keying, is a image processing mechanism that layers two videos or images together in a single frame. This technique can be seen greatly in motion pictures and video productions.
For this exercise, we had a concept of underwater scene as the background for our input video. We also used this background as our “green” screen:

For the background video, we used a part of this clip from Youtube:
youtube
Based on the background, the average values for RGB channels were computed. Then, the computed RGB averages were compared to the threshold (in our case, 63) in order to determine the input video’s current pixel is a background pixel or not. If it is a background pixel, then the input video’s current pixel is replaced with the background video’s corresponding value at the same pixel.
The resulting chroma key video is shown below:
youtube
0 notes
Text
CMSC 165 Pseudo-coloring Image Processing
A pseudo-color image is derived from a grayscale image by mapping each intensity value to a color according to a table or function. Pseudo color is typically used when a single channel of data is available, in contrast to false color which is commonly used to display three channels of data (Pseudocolor Filter for VirtualDub, 2012).
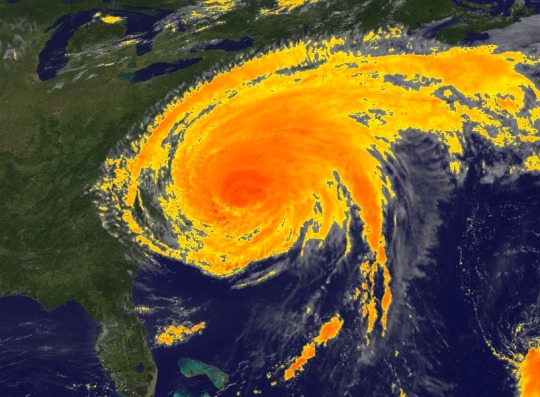
An application of pseudo-coloring can be seen in weather forecasts, specifically for typhoon intensity detection. For this exercise, we were given a map with a tropical depression and were instructed to detect the typhoon’s intensity.
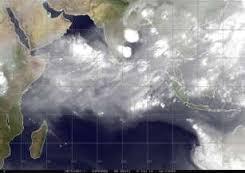
Given map image
Below is the color gradient we used:

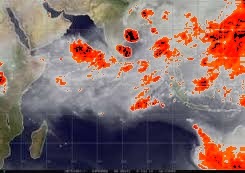
First, we converted the input image to grayscale. For every gray pixel value > 200 (the threshold we selected), we change its color by dividing the gray pixel by 255 then multiplying it with the height of the color gradient to get its corresponding color value.
After the processing, we were able to produce the image below:
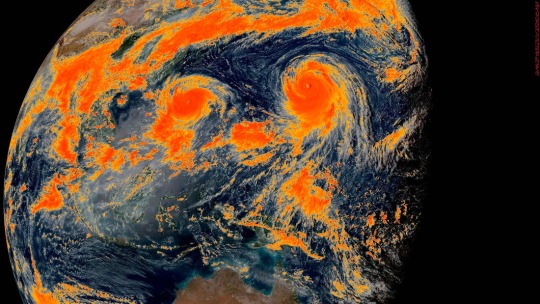
I also tried it with other inputs and I was able to produce the following, as well:
0 notes
Text
CMSC 165 Canny Edge Detection
Edge detection is a technique in image processing that aims to produce a line outline of the image by detecting its important features such as corners and curves.
Canny Edge Detection is just one of the many edge detection operators. It is the most widely used edge detection in computer vision. It involves filtering noise in the image, finding the image’s intensity gradient, applying non-maximum suppression and then finally, applying hysteresis.
We were tasked to convert the image below to a binary image and then apply Canny Edge Detection
As we can see, the given test image is of low quality and therefore needs adaptive thresholding in order to detect all words (edges) correctly.
We used the Mean-C Thresholding (see http://homepages.inf.ed.ac.uk/rbf/HIPR2/adpthrsh.htm for further details), where C is a constant that we set to 7, in order to convert it to a binary image. In addition to this, we also used a 9x9 kernel. Below is the resulting binary and canny image.
Binary Image

Canny Image
We also tried to smoothen the binary image to see if the image quality will improve but it is not advisable to do so since the words in the image will be more difficult to identify. Below is the smoothened binary image, using Gaussian Filter:
0 notes
Text
CMSC 165 Filtering and Image Enhancement
Photoshop? Microsoft Office Picture Manager? How do these applications enhance our images?
Filtering is one of the many techniques in processing an image. It can smoothen, sharpen and even detect edges of images. For this certain exercise, we were instructed to implement image smoothing and sharpening using filtering.
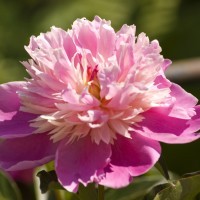
Given the image above, we used Mean and Spatial Filtering to enhance the image. The sample image was converted to grayscale before applying the filtering techniques.
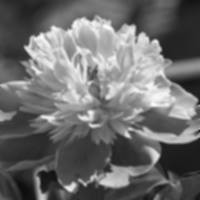
MEAN FILTERING
Mean Filtering improves the image quality by making it “smoother”, or manipulating the image’s intensity and colors. Applying this filter results to the image appearing blurry.
I was assigned to do the mean filtering of flower.jpg using an unweighted kernel, or whose elements are all equal to 1. Below is the resulting image:
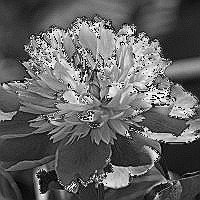
SPATIAL FILTERING
On the other hand, spatial filtering is used for sharpening the image. This filtering technique uses a kernel whose sum of the values is equal to zero, thus resulting to an image with a better contrast.
I was assigned to do the spatial filtering of flower.jpg whose kernel has positive 5 as its center. I learned that if we used a positive-centered kernel, it is called the Sharpening Filter and will result to the image below:
You can also visit my buddy’s blog (http://mchiaelbrgaa.tumblr.com/) in order to see the image enhancements he was able to create using a different set of kernel.
0 notes
Text
#SupportiveFriend #Timawas4Lyf
CMSC 165 Exer 1
I learned a thing or two about image processing last Monday. I was introduced to Open-CV and its useful features in manipulating images. For our exercise, we were tasked to find one overexposed and one underexposed image, and to enhance them using the things we learned.
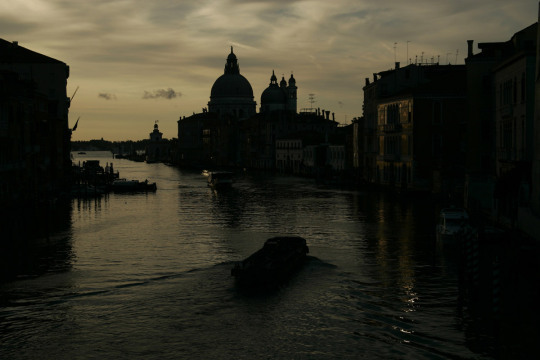
Underexposed
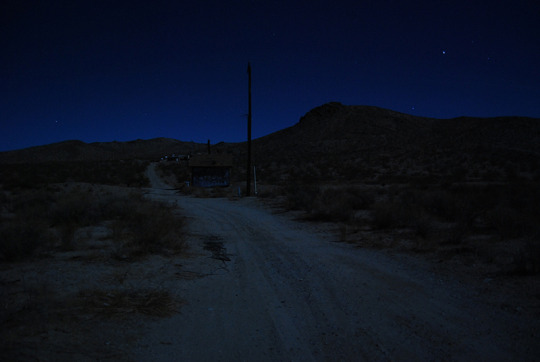
I picked this 800x536 picture from Google images, because it looked scary, dark, and depressing, and I wanted to add a little bit exuberance in the image. So after how many adjustments and trials, I ended up using this equation
‘5*channel+50′
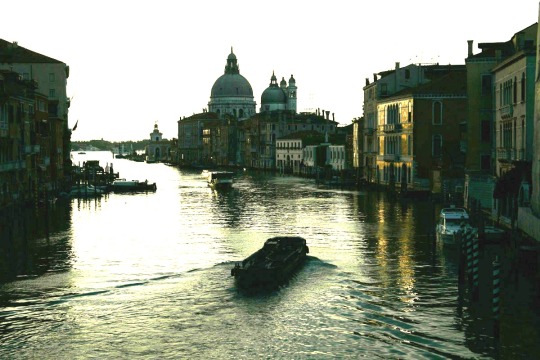
It is for the function that will be applied to each color in RGB, and this was the result.
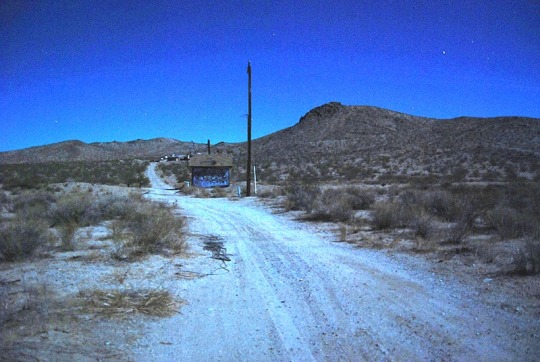
Although it appeared grainier, the details are now much more visible compared to the original photo. Details like the blue signage (near the post), the grasses, and the surface texture of the road and of the mountain, are a lot more perceivable.
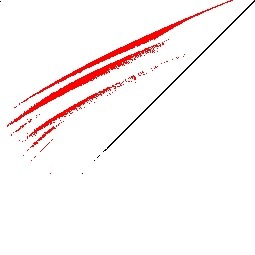
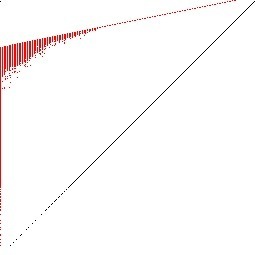
Intensity graph for the under exposed photo (black) and for the enhanced version (red).
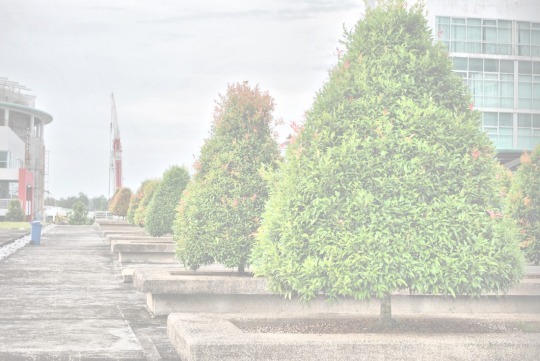
Overexposed

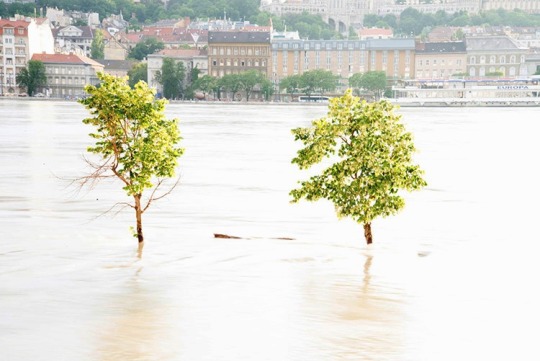
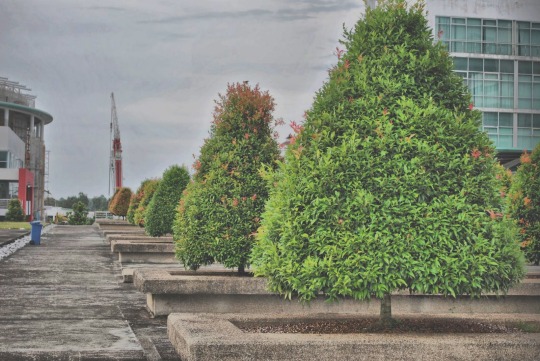
Now, I am going to use this 750x501 image of two trees for the overexposed part of the exercise. As we can see, the image is light and has this ‘smoky’ feels. Unlike the underexposed part, I used a quadratic function for this one. The equation goes like this
‘0.00319*(channel*channel)*1.58)-(0.000595*channel)-95′
Like the first one, a lot of adjustments and trials were also done. For the first try, it just got darker and dull, but then after so many efforts, TADAAA!
The trees and the buildings/houses got more vivid, and the water got more vibrant and refined. Also, the ‘smoky’ feels was removed.

Intensity graph for the over exposed photo (black) and for the enhanced version (red)
3 notes
·
View notes
Text
CMSC 165 Image Transformation
Is your image too dark?
Or is it too light/bright?
WORRY NO MORE!
In order to improve the image quality, I applied some mathematical formulas that will manipulate the picture pixel per pixel.
AFTER TRANSFORMATION
As for its original underexposed image, I used the linear, or slope of a line, formula that will lighten the image in such a way that the intensity of the majority of the pixels is near 255, or the white color. Initially, the colors of the buildings were not visible but after image transformation, we can now clearly see the building’s details. Below is the histogram of the transformed image.
Graph 1. Histogram of Underexposed Image Transformation
On the other hand, I used the quadratic equation on the overexposed image in order to darken and at the same time, enhance the distinct colors. After transformation, we are now able to see the different shades of green leaves.
Below is the histogram of the transformed image.

Graph 2. Histogram of Overexposed Image Transformation
Image Transformation is a vital tool in digital image processing and is very useful in different fields such as medicine, disaster and crime management, art and many more.
1 note
·
View note