
sciforce
SciForce
SciForce – a company where the integration of various branches of science builds up a powerful force to create robust software solutions. Working at the intersection of Computer Science with other technical, natural and humanitarian sciences let us go beyond traditional IT services and become both technical and scientific forces to our customers.
122 posts
Don't wanna be here? Send us removal request.
Last Seen Blogs

kartubet88
Untitled

hikaruartt
Hikaru_Art

gamzeenmakara
Randomness

kirasanime-thoughts
Anime is my life now

hometown-gothic
Hometown Gothic
Text
AI and ML in the European Pharmaceutical Industry: Recent Applications, Challenges, and Response to the Pandemic

Innovations in the pharmaceutical industry proved to be a tall order, as drug development's success rate has been traditionally tremendously low. However, the COVID-19 pandemic whipped up R&D centers, markets, and leaders to develop the response to the crisis faster than ever. AI and ML bring to the table a toolbox to overcome new challenges in the whole industry. Significant that the Healthcare Artificial Intelligence market is expected to reach $51.3 billion by 2027 at CAGR (compound annual growth rate) of 41.4% starting from 2020. Check out this fresh guide on the latest updates that AI and machine learning brought to the pharmaceutical market in the EU, including recent applications and the most significant challenges.
AI and Pharma at the “Slope of Enlightenment”
Recent AI and ML applications in healthcare and pharma proved that these technologies are reaching the 'Slope of Enlightenment' in the Gartner Hype Cycle. It seems like the industry has no choice at the moment. Per Subroto Mukherjee, Head of Innovation and Emerging Technology at GlaxoSmithKline, the development of the new vaccines against coronavirus would take from eight to ten years before. In contrast, the ones available now took 300 days from the start of development to the first testings. The rationale of using ML in the industry is to lower attrition and costs while increasing the success rate for new drug development.
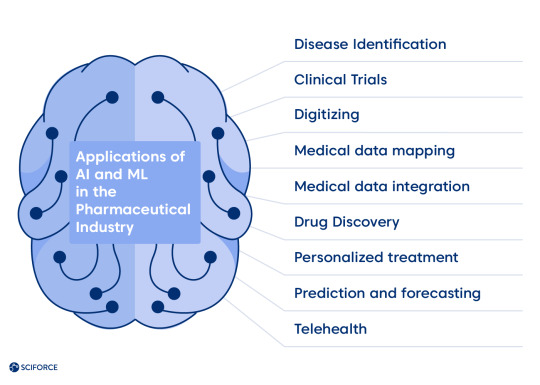
Hence, the power of using ML algorithms to parse significant amounts of data to learn from it and make determination or prediction about the future of the new data sets come to the scene. The algorithms show higher performance with the increase of quantity and quality of data, leading to the question of data regulation, which we cover further. Data collected like images, texts, biometrics, assay, and other information from wearables stand as the field for developing the new models or formulas that are still unknown but could bring crucial changes. Practically there has been next proven applications of AI and ML in the market:
Disease Identification — reaching all the possible areas where data is available.
Clinical Trials — matching the ideal candidate for a trial based on their data.
Digitizing — facilitating conversion from paper/image medical info into fully structured digital data via optical character recognition (OCR) and natural language processing (NLP).
Medical data mapping — enabling medical research and development by standardizing data formats.
Medical data integration — helping medical data owners sell/give access to their data to research pharma companies via Extract/Transform/Load (ETL) technology.
Drug Discovery — components screening, RNA and DNA fast measurement, personalized medication development.
Personalized treatment — enhancing the diagnostic accuracy of healthcare providers.
Prediction and forecasting — monitoring the seasonal illnesses globally and facilitating early diagnostics and precision treatment via data analysis.
Telehealth — helping caretakers in delivering treatment remotely via mobile/web development
Recent Use Cases in the European Pharma and Healthcare
To illustrate the mentioned applications, see how the European companies resolve the scientific problems delivering faster pharmaceutical, bispecific target diseases treatments, and rare disease patients treatment matching using machine learning. The UK and France-based companies are on our list this time.
Tessella is a data science consultancy offering AI and data science services by building machine learning models. They claim to have helped GlaxoSmithKline (GSK) improve the salt and polymorph screening process of the drugs' development. It helps to find the best physical form of the new drug substance. The company developed an ML model that automates medicine preparation processes like liquid addition and mixing, heating and cooling, shaking, sample transfer, and solid dispensing.
Healx has developed HealNet, software helping in matching rare disease patients with appropriate drug treatments. Their ML algorithms are built on a database consisting of publicly available data and specific sources, including clinical trials, symptoms data, chemical structure, drug targets, patents, and scientific literature.
Exscientia claims their software can discover small molecules and compounds treating bispecific target diseases. This solution is using an ML model that predicts the specific development of the bispecific diseases.
Owkin claims their solution, Socrates database helps in creating predictive models for drug development optimization.
GlaxoSmithKline, a UK-based multinational company, applied the ML in predictive forecasting for some popular seasonal brands. It helps to foresee the possible peaks and troughs of coming cold and flu or allergy in a specific region, assisting local authorities to deliver an effective health communications campaign.
Challenges of Big Data for Big Pharma
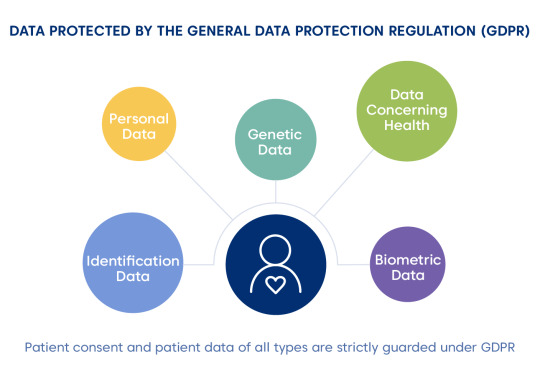
Statistical technology depends on the data quality to generate meaningful and impactful results. Hence, pharmaceutical and healthcare companies should balance the EU's General Data Protection Regulation (GDPR), starting from 2018. It is also still applicable to the UK, which is leaving the EU. The data, which is under GDPR patient's consent, includes the following categories:
Identification data: any information identifies an individual (name, address, ID number, email, social media accounts, etc.).
Personal data: data relating to a person's physical, genetic, physiological, mental, cultural, economic, or social identity.
Biometric data: any data including an individual's physical, behavioral or physiological information.
Genetic data: data of the acquired genetic or the inherited characteristics, any data from a biologic sample.
These regulations hold the extraterritorial reach, which means that any global business dealing with EU customers should consider this aspect. Noncompliance to the GDPR leads to 4% of annual global revenue or €20 million fine. It does not sound inspirational, is it?
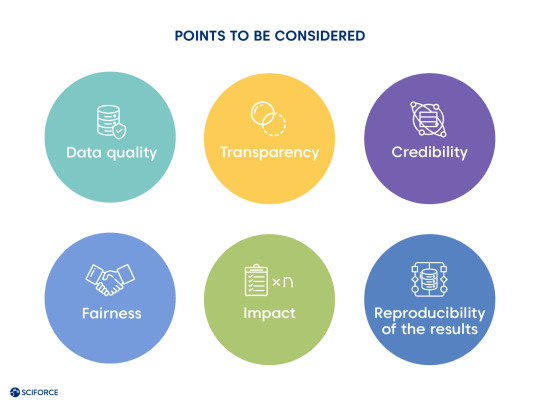
Per David Champagne, a member of the McKinsey Digital Practice, et al. in their article devoted to realizing machine learning potential, there is a way to escape a bottleneck. Pharmaceutical companies can move through the regulatory landscape effectively. In the meantime, all the actors should consider these points:
Data quality is a crucial success factor, and we all need judicious consideration of data usage.
Transparency: leaving behind the 'black box' approach and explaining the 'magic' elements to the key stakeholders.
Credibility: results should be consistent with domain expertise and established science.
Fairness: avoiding the biases of the clinical and social environments.
Impact: ability to quantify the results as more productive than previous practices.
Reproducibility of the results: algorithms should still perform while dealing with real-time data.
AI and ML vs. COVID-19
Recent studies worldwide are experimenting with AI and ML techniques for decision-making in treatment, recovery prediction, and patients' prioritizing. The pandemic also triggered telehealth development, as a recent case in Spain shows the effect of using patients' data for predicting whether a person needs immediate intensive care unit admission. Read more on AI and ML grappling pandemic in our recent post.
Per Subroto Mukherjee, AI and machine learning can hold their role in the fight with the pandemic by finding out coronavirus's biological secret. The crisis affected not only drug development but also a global supply chain. AI's power of planning, forecasting, automation, and collaboration can also unleash supply companies' management.
Such applications as natural language processing and computer vision apply to current initiatives. The US White House, with the help of the AI community, started the process of medical literature mining to understand a coronavirus's nature. Medical imaging companies are already using CT image processing to detect coronavirus-induced pneumonia.
Wrapping Up
Machine learning and AI are demonstrating transformative power on the European pharmaceutical and healthcare market. Meanwhile, it is a domain that still needs to find out optimal modus operandi concerning privacy and clarity to all the actors. To meet all the criteria and ensure progress in a current global fight with the pandemic, we should apply the known tools considering the guidelines. Daring to bring positive results in exponential growth using AI and machine learning is real. We have checked it out.
#artificial intelligence#machine learning#healthcare#health tech#data science#pharmaindustry#pharmacy#covid 19
0 notes
Text
Reinforcement Learning and Asynchronous Actor-Critic Agent (A3C) Algorithm, Explained
While supervised and unsupervised machine learning is a much more widespread practice among enterprises today, reinforcement learning (RL), as a goal-oriented ML technique, finds its application in mundane real-world activities. Gameplay, robotics, dialogue systems, autonomous vehicles, personalization, industrial automation, predictive maintenance, and medicine are among RL's target areas. In this blog post, we provide a concrete explanation of RL, its applications, and Asynchronous Actor-Critic Agent (A3C), one of the state-of-the art algorithms developed by Google's DeepMind.
Key Terms and Concepts
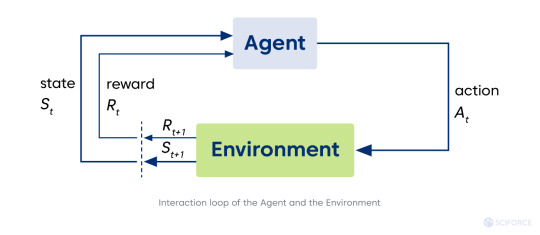
Reinforcement learning refers to the type of machine learning technique enabling an agent to learn to interact with an environment (area outside the agent's borders) by trial and error using reward (feedback from its actions and experiences). The agent seeks ways to maximize the reward via interacting with the environment instead of analyzing the data provided.
The agent is a learning controller taking actions in the environment and receives feedback in the form of reward.
The environment, space where the agent gets everything needed from a given state. The environment can be static or dynamic, and its changes can be stochastic and deterministic correspondingly. It is usually formulated as Markov decision process (MDP), a mathematical framework for decision-making development.
However, real-world situations often do not convey information to commit a decision (some context is left behind the currently observed scene). Hence, the Partially Observable Markov Decision Processes (POMDPs) framework comes on the scene. In POMDP the agent needs to take into account probability distribution over states. In cases where it’s impossible to know that distribution, RL researchers use a sequence of multiple observations and actions to represent a current state (i.e., stack of image frames from a game) to better understand a situation. It makes possible to use RL methods as if we are dealing with MDP.
The reward is a scalar value that agents receive from the environment, and it depends on the environment’s current state (St ), the action the agent has performed grounding on the current state (At ), and the following state of the environment (St+1):

Policy (π) stands for an agent’s strategy of behavior at a given time. It is a mapping from the state to the actions to be taken to reach the next state. Speaking formally, it is a probability distribution over actions in a given state, meaning the likelihood of every action in a particular state. In short, policy holds an answer to the “How to act?” question for an agent.

State-value function and action-value function are the ways to assess the policy, as RL aims to learn the best policy. Value function V holds an answer to the question “How good current state is?”, namely an expected return starting from the state (S) and following policy (π).

Sebastian Dittert defines the action-value of a state as “the expected return if the agent chooses action A according to a policy π.” Correspondingly, it is the answer to “How good current action is?”

Thus, the goal of an agent is to find the policy () maximizing the expected return (E[R]). Through the multiple iterations, the agent’s strategy becomes more successful.
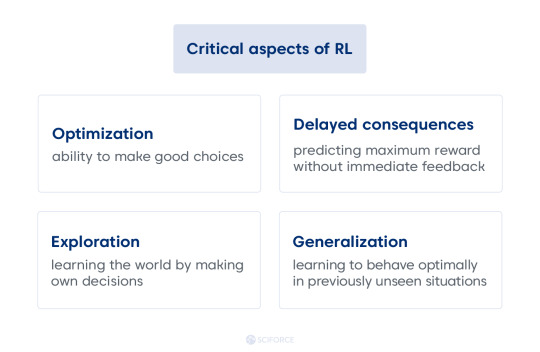
One of the most crucial trade-offs for RL is balancing between exploration and exploitation. In short, exploration in RL aims at collecting experience from new, previously unseen regions. It potentially holds cons like a risk, nothing new to learn, and no guarantee to get any useful further information. On the contrary, exploitation updates model parameters according to gathered experience. In its turn, it does not provide any new data and could not be efficient in case of scarce rewards. An ideal approach is making an agent explore the environment until being able to commit an optimal decision.
Reinforcement Learning vs. Supervised and Unsupervised Learning
Comparing RL with AI planning, the latter does cover all aspects, but not the exploration. It leads to computing the right sequence of decisions based on the model indicating the impact on the environment.
Supervised machine learning involves only optimization and generalization via learning from the previous experience, guided with the correct labels. The agent is learning from its experience based on the given dataset. This ML technique is more task-oriented and applicable for recognition, predictive analytics, and dialogue systems. It is an excellent option to solve the problems having the reference points or ground truth.
Similarly, unsupervised machine learning also involves only optimization and generalization but having no labels referring to the environment. It is data-oriented and applicable for anomaly and pattern discovery, clustering, autoencoders, association, and hyper-personalization pattern of AI.
Asynchronous Advantage Actor-Critic (A3C) Algorithm
The A3C algorithm is one of RL's state-of-the-art algorithms, which beats DQN in few domains (for example, Atari domain, look at the fifth page of a classic paper by Google Deep Mind). Also, A3C can be beneficial in experiments that involve some global network optimization with different environments in parallel for generalization purposes. Here is the magic behind it:
Asynchronous stands for the principal difference of this algorithm from DQN, where a single neural network interacts with a single environment. On the contrary, in this case, we've got a global network with multiple agents having their own set of parameters. It creates every agent's situation interacting with its environment and harvesting the different and unique learning experience for overall training. That also deals partially with RL sample correlation, a big problem for neural networks, which are optimized under the assumption that input samples are independent of each other (not possible in games).
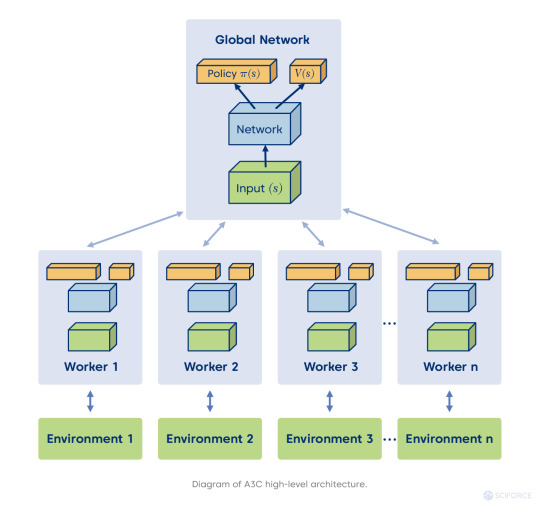
Actor-Critic stands for two neural networks — Actor and Critic. The goal of the first one is in optimizing the policy (“How to act?”), and the latter aims at optimizing the value (“How good action is?”). Thus, it creates a complementary situation for an agent to gain the best experience of fast learning.
Advantage: imagine that advantage is the value that brings us an answer to the question: “How much better the reward for an agent is than it could be expected?” It is the other factor of making the overall situation better for an agent. In this way, the agent learns which actions were rewarding or penalizing for it. Formally it looks like this:

Q(s, a) stands for the expected future reward of taking action at a particular state
V(s) stands for the value of being in a specific state
Challenges and Opportunities
Reinforcement learning’s first application areas are gameplay and robotics, which is not surprising as it needs a lot of simulated data. Meanwhile, today RL applies for mundane tasks like planning, navigation, optimization, and scenario simulation in various verticals chains. For instance, Amazon used it for their logistics and warehouse operations’ optimization and for developing autonomous drone delivery.
Simultaneously, RL still poses challenging questions for industries to answer later. Given its exploratory nature, it is not applicable in some areas yet. Here are some reasons:
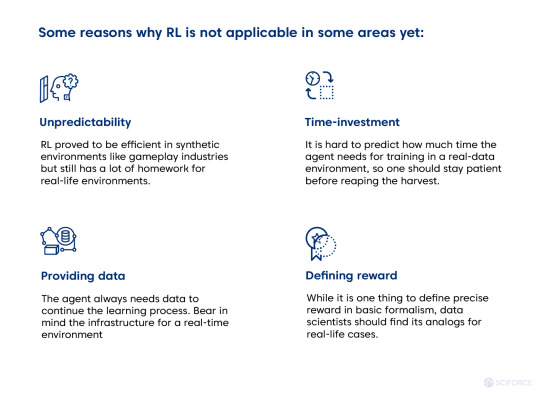
Meanwhile, RL seems to be worth time and resources investment as industry players like Amazon show. Just give it some time, since investment in knowledge always requires it.
#reinforcement learning#machine learning#supervised learning#unsupervised learning#artificial intelligence#data science#ai
0 notes
Text
Potential of Using Machine Learning & AI During COVID-19

The medical application of machine learning & AI is one of the most principal and fast-growing fields of our expertise. Following the global rush for minimizing the coronavirus crisis effects, SciForce can not stay behind in the tremendous eHealth development.
The Severe Acute Respiratory Syndrome CoronaVirus 2 (SARS-CoV-2), popularly known as COVID-19, has become a matter of great concern globally since the end of 2019. While Pfizer/BioNTech, Moderna, AstraZeneca, and Sinovac vaccines have become household names and bring some light at the end of the tunnel, we've got more tasks to solve. Patients' diagnosis, treatment, and monitoring cause enormous pressure on healthcare providers worldwide. Healthcare software development turns out to be on the frontline. Given the pandemic peculiarities, the latest approaches of ML & AI have come to tackle the challenge.
Read on to find out the latest AI & ML corona-driven applications for the eHealth industry that help understand and battling the virus.
1. Diagnosis: Coping with the Challenge at Its Infancy
The efficient testing of the population is a key to curbing the spread of coronavirus. However, the available tests are not meeting the demand and resolving the problem to the end. RT-RCP aimed at the viral RNA is a time- and costs-consuming variant and is not widely applicable. Rapid antigen test detects the viral proteins but still is not a precise and guaranteed answer. The antibody test is only relevant to people who have already undergone the COVID-19.
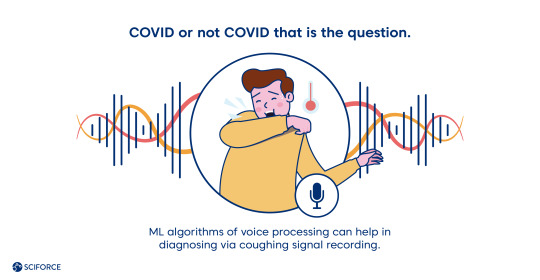
Per recent researches, AI algorithms can diagnose the virus without using the RT-RCP test. Thus, machine learning algorithms detect coronavirus via blood or urine tests, analyzing the samples to predict the COVID-19. The data received from the blood test of the patients stands as the base for neural network analysis for RT-RCP test prediction based on the blood test parameters. ML algorithms of voice processing can help in diagnosing via coughing signal recording. Medical wearables are also widely used in telehealth systems and could be helpful for diagnostics. Hence, virtual visits to the health care providers become possible thanks to the natural language processing algorithm. The Health Center of the Medical University of South Carolina stands as a good example.
Mobile phones serve as great data-generating tools providing immediate access to the potential coronavirus hosts, opening the window of opportunities for epidemiological control as some Pacific Asian governments demonstrate it.
2. AI Assistance for a Treatment: Decision-Making, Recovery Prediction, and Patients' Prioritizing
In constant vital resource scarcity, machine learning algorithms can assist in multi-criteria decision-making for healthcare providers. It is beneficial when it goes about detecting and predicting the disease severity. Thus, medical personnel can prioritize the patients to respond to coronavirus disease and its outcomes. Text processing can help to compare the treatment plans and predict the patient's recovery. Patients prioritizing is particularly crucial in the state of the breathing equipment scarcity.
ML algorithms assist the selection criteria for such existent treatment practice as antibodies circulating blood transfusion. In this case, ML helps to detect whether a subject meets blood donor selection criteria and selects the most suitable plasma.

3. Monitoring Patients: Overcoming Limitations with Telehealth
Deep learning algorithms demonstrate efficacy in predicting patients' severity, mortality, and recovery. In March 2020, the researchers in Wuhan, PRC used the clinical variables of almost 200 hospitalized patients to develop a deep-learning algorithm and risk stratification score system to predict mortality.
One can use the same idea for predicting the disease severity of the patient. It helps forecast the coronavirus effects using clinical and laboratory data like a blood test or even voice signal.
Thus, telehealth gets the new dimension and scope with the pandemic outbreak and promises to show even more tremendous application soon. Combining classical epidemiological methods with deep learning algorithms, natural language processing to process electronic health records using other sensors (temperature, color sensor, camera, and microphone) can cause a paradigm shift for the eHealth industry. So, researchers in Spain show that using clinical variables of more than 10000 patients like age, fever, and tachypnea (abnormal respiration rate) to detect whether a person needs immediate intensive care unit admission.

4. Tackling the Pandemic and Control Regaining
Social distancing, contact tracing, and identifying COVID-19 cases are the crucial steps to keep the reproduction rate small. AI methods of large amounts of data processing come as a powerful tool for large-scale problem-solving. Tracing the person's contact and offering tools for a self-assessment come as one of the possible applications.
Policymakers can use different AI techniques to provide physical distancing among the population, along with surveillance video analysis (PRC), gathering spatio-temporal data provided by mobile phones, and identifying whether a person wears a facemask automatically. Interesting that deep learning methods like computer vision for facemask identification applied for the first time.

Image source
The hidden danger of this pandemic is in the fact that a lot of COVID-19 cases are asymptomatic. ML methods help create mobilized assessment centers based on spatio-temporal data of individuals analyzed. Developing self-organizing feature maps (SOFM) to monitor the epidemic in live time and a particular place is possible. Thus, one can build a projection model for a community spread among the population of a city.

Summing It Up
It is better to predict the problem than to deal with its consequences. However, 2020 showed the globe that we still have a lot to work on for a reliable prognosis. There is not much data on the AI and ML methods to predict the pandemic humankind can face in the future. Meanwhile, the tremendous development of the vaccine and lateral applications for coronavirus diagnosis, treatment, and monitoring shed some light on the overall picture.
AI-based technologies have become great solutions for COVID-19 detecting without RT-RCP testing. They assist in multi-criteria decision-making for healthcare providers, overcome the limitations, and predict the upcoming epidemiological scenarios. It is all already happening now.
SciForce is ready to face the challenge and join the frontline to develop the solutions for coming challenges. The power of science has always empowered people to strive, especially during the last couple of years.
#healthcare#covid19#coronavirus#flattenthecurve#machine learning#data science#artificial intelligence#data
0 notes
Text
Artificial Intelligence and the Shift to the Circular Economy

Over the past 200 years, a model backing by extracting and consuming vast quantities of finite materials and fossil fuels has been shaping the global economy. Such a linear economic model has allowed humanity to build an impressive industrial economy and reach unprecedented prosperity. At the same time, this type of economy is responsible for current environmental issues, depletion of resources, and climate change.
Per McKinsey Global Institute, AI could add $13 trillion to the global economic activity by 2030, yet some issues may constrain its application for social good. At present, the linear economic system requires changes to sustain the growth of the global middle class omitting negative environmental and social impacts.
Circular Economy, Explained
Let us start with the principal difference between the linear and circular economy models. The economic growth is not intertwining with finite resource consumption in the circular economic model. Conversely, it endeavors to eliminate waste and pollution, keep products and materials in use, and regenerate natural systems. The advantages of this approach are substantial not only for the planet but to economic growth. The circular economy can spur innovations, resolve growing environmental challenges, and create new jobs. McKinsey predicts that a net benefit of the circular economy for Europe can reach €1.8 trillion by 2030. The EU adopted the package of policies for the development of a circular economy in December 2015. Witnessing this endeavor's positive effect, the European Commission published The Circular Economy Action Plan in March 2020, which promises more changes.
Why AI?
When we think of the circular economy, we often imagine waste management and recycling, such as dealing with food waste, single use-plastics, packaging, and straws. However, the circular economy is a broader concept of being sustainable, as it embraces renewable energy, design for longevity, upgrading, disassembly, water stewardship, social responsibility, and disassembly.
Artificial intelligence is supposed to play an essential role in enabling the circular economy's systemic shift. It is to enhance and facilitate circular economy innovation across industries in three main ways:
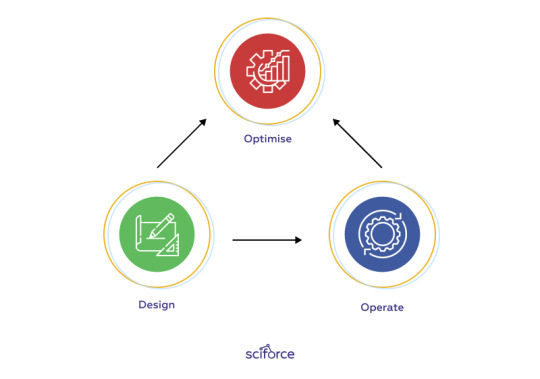
1. Design circular products, components, and materials. It is well-known that AI can accelerate the development of new products, features, and materials fit for a circular economy thanks to the rapid ML-driven prototyping and testing.
2. Operate circular business models. AI increases product circulation by intellegent inventory management, pricing and demand prediction, and predictive maintenance.
3. Optimize circular infrastructure. AI can improve sorting and disassembling products, components remanufacturing, and recycling materials that can build the reverse logistics infrastructure required to 'close the loop' on products and materials.
The key idea underlying all AI applications for the circular economy is to manage resources efficiently, compliant, and sustainable. The AI technologies apply to collate, analyze and interpret complex environmental data and information to understand the issues and prioritize action. More importantly, AI can become a platform to democratize sustainability knowledge, enabling us to drive changes in our behavior that benefit the planet on all levels and scales.
Field Applications
From the manufacturing industry to healthcare, the scope of AI application to curb waste is endless, and the principle is relatively similar for all fields. To grasp the extent of AI applications, we can mention just several examples.
Design of New Materials
The European Space Agency deployed circulated economy models to produce and test novel alloy models in their Accelerated Metallurgy project. The circular economy principles in alloys design bring the following results: materials are non-toxic, can be reused, and can be made using additive manufacturing and processing methods to minimize waste. Accelerated Metallurgy uses AI algorithms to analyze big data to design and test alloy composition systematically.
Infrastructure Optimization
A vital feature of the circular economy is that materials and products are not disposed of after the first use but reused multiple times, which requires optimization of the infrastructure to ensure circular product and material flows. Effective recovery of valuable materials requires homogeneous, pure flows of material and products. However, used material streams are usually far from being pristine: from kitchen waste to used computers, and these streams are mixed and heterogeneous in materials, products, and by-products, both biological and technical. AI shows how it can enable enhanced valorization of materials and products by sorting post-consumer mixed material streams through visual recognition techniques. ZenRobotics, for example, works with cameras and sensors, whose imagery input allows AI to control intelligent waste sorting robots. These robots can reach an accuracy level of 98% in sorting myriad material streams, from plastic packaging to construction waste.

Smart Farming
Two mutually opposing trends are currently putting more pressure on agriculture, calling for immediate action. Already severely depleted soils need to provide food for an ever-growing global population, and at the same time, roughly a third of food remains never eaten. AI offers multiple opportunities to make farming smarter by using image recognition to determine fruit ripeness, food supply, demand-effective matching, and increasing food by-products valorization. Our company, for instance, uses computer vision to monitor the growth and development of plants.

Designing Healthier Food Products
AI techniques can help in reducing waste, eliminate unsafe additives, and develop regenerative grown ingredients. Recent applications include alternative egg-free products, plant-based meat, and fish to decrease dependence on natural resources. A Chilean food technology company called NotCo (The Not Company), for example, is trying to replace foods made with animal products using vegetable-based foods that taste the same. They have developed the Giuseppe artificial intelligence program that takes the molecular structure of meat and can replicate it using plant-based ingredients to create a unique flavor and texture.

Predictive Maintenance
AI algorithms may be able to radically improve the assessment of a product's condition, enabling predictive maintenance and the ability to determine the secondary value of a used device more accurately. By using IoT sensors and AI-driven analytics, manufacturers and service operators can know in advance when equipment needs service. Predictive maintenance help to replace the required detail in advance. This solution predicts machine conditions leading to the failure and provides time estimation to plan and minimize downtime.
Conclusion
AI can be an enabler and accelerator of the global transition to the circular economy. Digital technologies are already driving a profound transformation of our economy and way of life. If such modification embraces circular economy principles, it can create value and generate more comprehensive benefits for society. However, AI production requires a clear understanding of the actual problem to solve. Moreover, the circular economy transition involves a network of trusted partners — it cannot be done by one company alone, even having the smartest AI tool.
The data generation, collection, and sharing are the implications of cooperation between all the stakeholders. It is only together with the community AI can transform our global economy and minimize waste.
0 notes
Text
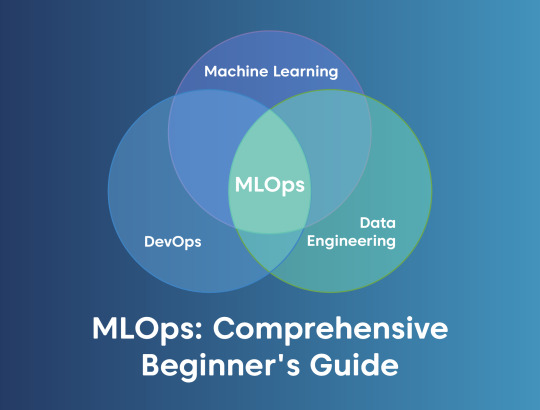
MLOps: Comprehensive Beginner's Guide
MLOps, AIOps, DataOps, ModelOps, and even DLOps. Are these buzzwords hitting your newsfeed? Yes or no, it is high time to get tuned for the latest updates in AI-powered business practices. Machine Learning Model Operationalization Management (MLOps) is a way to eliminate pain in the neck during the development process and delivering ML-powered software easier, not to mention the relieving of every team member's life.
Let's check if we are still on the same page while using principal terms. Disclaimer: DLOps is not about IT Operations for deep learning; while people continue googling this abbreviation, it has nothing to do with MLOps at all. Next, AIOps, the term coined by Gartner in 2017, refers to the applying cognitive computing of AI & ML for optimizing IT Operations. Finally, DataOps and ModelOps stand for managing datasets and models and are part of the overall MLOps triple infinity chain Data-Model-Code.
While MLOps seems to be the ML plus DevOps principle at first glance, it still has its peculiarities to digest. We prepared this blog to provide you with a detailed overview of the MLOps practices and developed a list of the actionable steps to implement them into any team.

MLOps: Perks and Perils
Per Forbes, the MLOps solutions market is about to reach $4 billion by 2025. Not surprisingly that data-driven insights are changing the landscape of every market's verticals. Farming and agriculture stand as an illustration with AI's value of 2,629 million in the US agricultural market projected for 2025, which is almost three times bigger than it was in 2020.
To illustrate the point, here are two critical rationales of ML's success — it is the power to solve the perceptive and multi-parameters problems. ML models can practically provide a plethora of functionality, namely recommendation, classification, prediction, content generation, question answering, automation, fraud and anomaly detection, information extraction, and annotation.
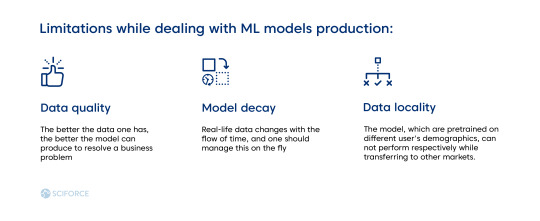
MLOps is about managing all of these tasks. However, it also has its limitations, which we recommend to bear in mind while dealing with ML models production:
Data quality. The better the data one has, the better the model can produce to resolve a business problem.
Model decay. Real-life data changes with the flow of time, and one should manage this on the fly.
Data locality. The model, which are pretrained on different user's demographics, can not perform respectively while transferring to other markets.
Meanwhile, MLOps is particularly useful when experimenting with the models undergoing an iterative approach. MLOps is ready to go through as many iterations as necessary as ML is experimental. It helps to find the right set of parameters and achieve replicable models. Any change in data versions, hyper-parameters, and code versions leads to the new deployable model versions that ensure experimentation.
ML Workflow Lifecycle
Every ML project aims to build a statistical model out of the data, applying a machine learning algorithm. Hence, Data and ML Model come out as two different artifacts to the software development of the Code Engineering part. In general, ML Lifecycle consists of three elements:
Data Engineering: supplying and learning datasets for ML algorithms. It includes data ingestion, exploration and validation, cleaning, labeling, and splitting (into the training, validation, and test dataset).
Model Engineering: preparing a final model. It includes model training, evaluation, testing, and packaging.
Model Deployment: integrating the trained model into the business application. Includes model serving, performance monitoring, and performance logging.
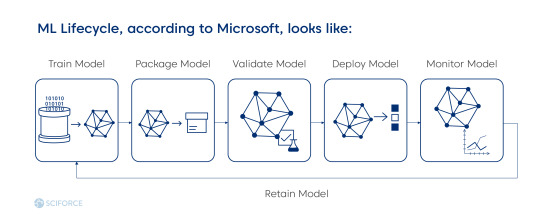
Source: Microsoft
MLOps, Explained: When Data & Model Meet Code
As ML introduces two extra elements into the software development lifecycle, everything becomes more complicated than the use of DevOps for any software development. While MLOps still seeks for source control, unit and integration testing, and continuous delivery of the package, it brings some new differences, compared to DevOps:
Continuous integration (CI) applies to the testing and validating data, schemas, and models, not only refers to the code and components.
Continuous deployment (CD) refers to the whole system, which is to deploy another ML-provided service, but not to the single software or service.
Continuous training (CT) is unique to the ML models and stands for model service and retraining.
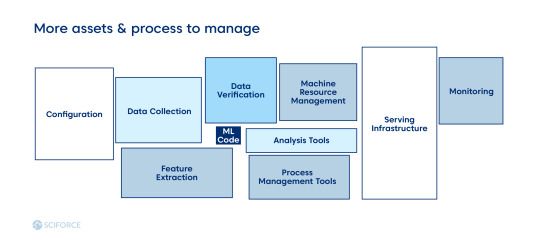
Source: Google Cloud
The level of each step of data engineering automation, model engineering, and deployment define the overall maturity of MLOps. Ideally, CI and CD pipeline should be automated to define the mature MLOps system. Hence, there are three levels of MLOps, categorized and based on the level of processes automation:
MLOps level 0: a process of building and deploying of ML model is entirely manual. It is sufficient for the models that are rarely changed or trained.
MLOps level 1: continuous training of the model by automating the ML pipeline, good fit for models based on the new data, but not for new ML ideas.
MLOps level 2: CI/CD automation lets work with new ideas of feature engineering, model architecture, and hyperparameters.
In contrast to DevOps, model reuse is a different story as it needs manipulations with data and scenarios, unlike software reuse. As the model decays over time, there is a need for model retraining. In general, data and model versioning is “code versioning” in MLOps, which seeks more effort compared to DevOps.
Benefits and Costs
To think through the MLOps hybrid approach for a team, which is implementing it, one needs to assess the possible outcomes. Hence, we've developed a generalized pros-and-cons list, which may not apply to every scenario.
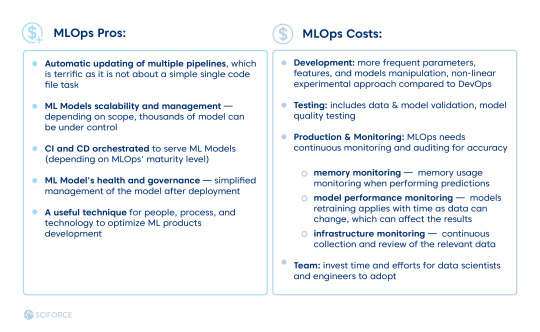
MLOps Pros:
Automatic updating of multiple pipelines, which is terrific as it is not about a simple single code file task
ML Models scalability and management — depending on scope, thousands of model can be under control
CI and CD orchestrated to serve ML Models (depending on MLOps' maturity level)
ML Model's health and governance — simplified management of the model after deployment
A useful technique for people, process, and technology to optimize ML products development
We assume that it might take some time for any team to adapt to the MLOps and develop its modus operandi. Hence, we are proposing a list of possible “stumbling stones” to foresee:
MLOps Costs:
Development: more frequent parameters, features, and models manipulation, non-linear experimental approach compared to DevOps
Testing: includes data and model validation, model quality testing
Production and Monitoring: MLOps needs continuous monitoring and auditing for accuracy
memory monitoring — memory usage monitoring when performing predictions
model performance monitoring — models retraining applies with time as data can change, which can affect the results
infrastructure monitoring — continuous collection and review of the relevant data
Team: invest time and efforts for data scientists and engineers to adopt
Getting Started with MLOps: Actionable Steps
MLOps requires knowledge about data biases and needs high discipline within the organization, which decides to implement it.
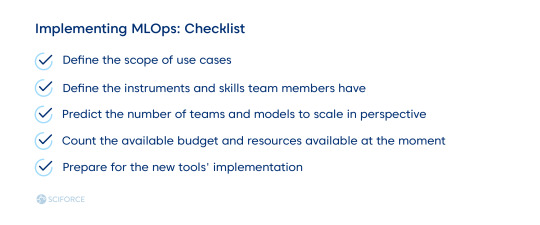
As a result, every company should develop its own set of practices to adjust MLOps to its development and automation of the AI force. We hope that the guidelines mentioned contribute to the smooth adoption of this philosophy into your team.
2 notes
·
View notes
Text
The Strength and Beauty of GraphQL in Use

The Strength and Beauty of GraphQL in Use
Facebook developed GraphQL as a major problem-solver for more efficient mobile data loading in 2012 and released it as an open-source solution three years later. Since that time, it mistakenly associates with PHP only and lacks trust given the Facebook's reputation (if you know what I mean). However, a recent Netflix case that finds GraphQL as a game-changer to power the API layer and increase the scalability and operability of the studio ecosystem attracts attention. This specification already gained popularity — given State of JavaScript 2019 Report, 50.6% of respondents have heard of GraphQL and would like to learn it. However, The New York Times, Airbnb, Atlassian, Coursera, NBC, GitHub, Shopify, and Starbucks are already among the GraphQL users. We decided to dwell on the beauty, strength, and some constructions of GraphQL in its scalability, performance, and security aspects and tell about our use cases for a banking sphere and a platform of commercial targeting. See the list of useful toolkits added in the end as a bonus.
GraphQL: the Beans Spilled
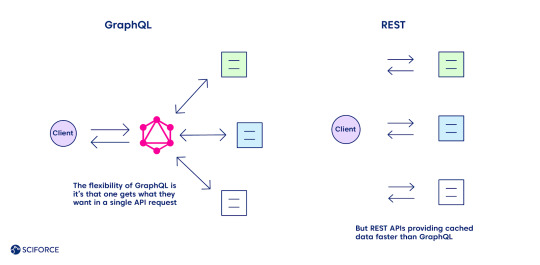
GraphQL is a convenient way of communication between a client and a server first. Sometimes one can see it as an opponent to REST API given the main difference that GraphQL brings to the table — only endpoint to fetch the data by one call from multiple sources. Meanwhile, we are to provide the space for consideration whether this specification is relevant to particular tasks or REST API is the silver bullet for your case.
Both REST and GraphQL APIs are stateless, supported by any server-side language and any frontend framework, exchange the data through the JSON. But the one and the only endpoint containing the query expression to define the data that should be returned creates the what-you-see-is-what-you-get principle to optimize the work. Let's deep dive into the specification's main advantages and disadvantages.
Performance and Security
The flexibility of GraphQL is its main advantage over REST, as one gets what they want in a single API request. Define the structure of the information to receive back, and it goes back in the format requested, no under-fetching or over-fetching.
Meanwhile, caching seems to be one of the GraphQL downsides compared to REST (see the complete list of all the pros and cons further). REST APIs use the HTTP caching mechanism, providing cached data faster. It leverages its community-powered and time-tested feature, leaving GraphQL behind at the moment.
Security is another area of improvement for GraphQL while comparing it with REST, which boasts of a more mature system. The latter leverages HTTP authentication, JSON Web Tokens (JWT), or OAUth 2.0 mechanisms.
Pros and Cons: All Things Considered
Unlike REST API, GraphQL has detailed documentation and supports the function of nested queries that contributes to the principle "no over fetching and under fetching data," which happened while using the first specification. Query and mutation are the joint GraphQL operations. Thus, the CRUD (create, read, update, delete) model is not relevant for GraphQL as the create operation executes through the query command (other ones are implemented with mutations).
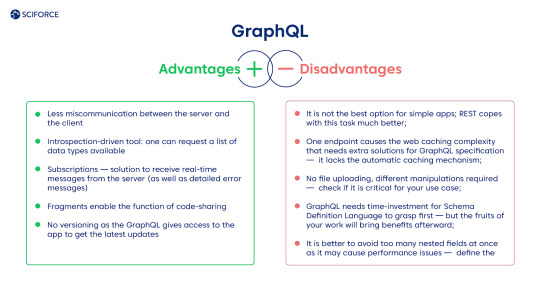
Advantages
Less miscommunication between the server and the client.
Introspection-driven tool: one can request a list of data types available.
Subscriptions — solution to receive real-time messages from the server (as well as detailed error messages).
Fragments enable the function of code-sharing.
No versioning as the GraphQL gives access to the app to get the latest updates.
Disadvantages
It is not the best option for simple apps; REST copes with this task much better.
One endpoint causes the web caching complexity that needs extra solutions for GraphQL specification — it lacks the automatic caching mechanism.
No file uploading, different manipulations required — check if it is critical for your use case.
GraphQL needs time-investment for Schema Definition Language to grasp first — but the fruits of your work will bring benefits afterward.
It is better to avoid too many nested fields at once as it may cause performance issues — define the architecture of the query beforehand.
Our Use Cases with GraphQL
GraphQL provides developers with higher scalability of the system that applies in any sphere. We want to share our experience of functions diversification for a commercial targeting platform and solving the banking application's two-fold task.
The Platform for a Commercial Targeting
GraphQL became a convenient solution for one of our clients who needed to develop a platform for commercial targeting, providing a straightforward approach for searching the potential customers in any national institution or facility. Using it, the client can direct the ads straight to the audience of interest using geolocation data and a set of filters. The platform consists of two primary services: one for geo-based consumers extraction based on PlaceIQ dataset usage and one for attribute-based (consumers identity graph) with consumer dataset. The project can be extended by adding the missing residential dataset to retrieve residents at requested addresses. Also, the services could be wrapped into the REST API to provide the ability to trigger them using web requests.
Risk Reduction and Resilience Boosting Financial Platform
An average bank encounters no more than 100K transactions a day. Moreover, it also faces malicious actions and the risk of cyberattack. One of our clients needed to empower their software platform to encounter higher transaction pressure and provide a higher risk-management system to avoid financial crimes. As a result, we have developed a solution that stands for the high amount of transactions and provides the reports while detecting anomalies based on the transactions' data in real-time.
GraphQL: Useful Toolkit
Check out the growing GraphQL community to find the latest updates on this solution. There are many horizontally and vertically developed solutions for GraphQL client, GraphQL gateway, GraphQL server, and database-to-GraphQL server. Add some of the tools that you enjoy using while working with GraphQL in comments to this blog.
GraphQL's servers are available for languages like JavaScript, Java, Python, Perl, Ruby, C#, Go, etc.
Apollo Server for JavaScript applications and GraphQL Ruby are some of the most popular choices.
Apollo Client, DataLoader, GraphQL Request, and Relay are among popular GraphQL clients. Graphiql, GraphQL IDE, and GraphQL Playground for IDE's respectively.
Some handy tools:
GraphQL Bindings — to use GraphQL API's as modular buildings blocks
GraphQL Docs — to generate GraphQL documentation in a simple way
GraphCMS — GraphQL-based CMS
GraphQL Network for easy debugging
GraphQL Voyager — to visualize data relations
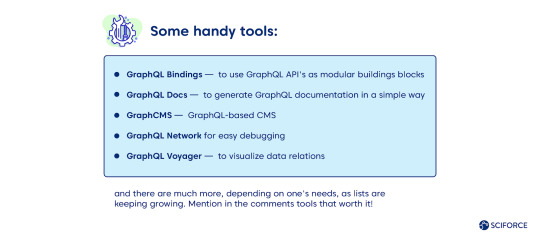
and there are much more, depending on one's needs, as lists are keeping growing. Mention in the comments tools that worth it!
0 notes
Text
SEO in Times of Voice-Activated Apps: How to Make Voice Search Work for You

Probably when Siri appeared in our life for the first time, the idea of talking to your device sounded like a whim or a funny activity to test Artificial Intelligence. By now, the use of voice-activated assistants has become an everyday experience. Siri, Google Assistant, and Cortana from our mobile devices and Amazon Echo, Google Home and Apple’s HomePod in our house are always ready to answer our question of complete a task. Such spreading of voice-activated applications has changed the way we perform a search in the Internet shifting it from typing keywords to asking direct
Voice search is being increasingly used by customers to find businesses around them, complete tasks, or just help them go about their day-to-day life. By 2020, Gartner predicts that 30% of all searches will take place without a screen altogether, meaning voice or image search. Andrew Ng, then Chief Scientist at Baidu stated in September 2014 that “In five years’ time, at least 50% of all searches are going to be either through images or speech” — the prediction that has spread all over the market.
Accurate or not, we already see how the voice search is changing our way of communication with our devices and our ideas and expectations of search. Check out a few of these stats that substantiate how much voice search has changed life as we know it, and how it’ll shape the future as well.
What it means for users
The key to unlocking the power of voice search is its convenience. Throughout history, we can see that as technology develops and advances, it makes life easier for people and this, in turn, changes the behavior of consumers.
Similarly in our search habits, with more people using their smartphones to search for products and services, many will begin to use the voice capability to speak into the search engine rather than trying to type on the go. New voice technology makes it easier than ever for people to gather information and answers from search results.
Voice-activated applications are already changing our habits in many aspects.
The most important difference in voice search query behavior is that the query string tends to be longer than keyboard written text queries. 41% of people admit they talk to voice assistants as if they were a friend(5). Obviously, voice search behavior similarly differs in comparison to manual searches: if you are typing a search for places to buy pizza, you might input something like “Best Pizza near me.” However, using voice search, we’ll end up in a conversational style, asking “Where are the closest pizza restaurants to me?”
We’re already seeing consumer expectations migrating from links to answers. And virtual assistants will also continue to evolve from answers to actions, making our search more individualized, accurate, and based on voice and visual inputs.

What it means for businesses
In the present-day search, as in the case with many new technologies, businesses need to make sure they can be found by voice or they risk being left on the sidelines. However, new challenges can open new opportunities for growth is addressed intelligently:

Businesses should see voice search as an opportunity to develop a conversation with their audience. Forward-thinking brands will adapt their websites content to engage in conversational search, rather than just short Q&A exchanges to engage with the public and build up interest in their products and loyalty.

It is a powerful and rapidly growing area of search marketing. To get in front of the consumer, businesses should answer their questions in a way that is accessible to voice search and try to understand how your users will be searching given that voice is faster and more convenient than typing.

Thanks to the growing demand for location-based queries, plus the newer ‘near me’, ‘close by’ and other voice-based queries, online market opens its doors to SMEs and empowers them to compete more effectively in markets where they have premises, experts and audiences in place.

Changes in user experience will inevitably shape future advertising models. To be able to answer the new demands, businesses will have to move from text ads to voice ads, and from investing in clicks to answers and actions.
New SEO for voice search
If a business spends time, money, and effort on keyword optimization and potentially spends money on PPC advertising it is missing a growing sector in the search market. As both small businesses and chain companies start taking voice search queries into consideration, they are looking to the ways to optimize SEO for voice queries.
Typed and spoken searches will output different results. Besides, unlike with regular search results, where the second result for a search query is likely to attract a lot of valuable traffic, voice search only returns one answer to searchers from the number one best-optimized result. Therefore, optimizing a website for a traditional search doesn’t always look the same as optimizing the same site for voice search. Here we will try to explore the most essential factors to consider when optimizing for voice search:
Using assistants. You can start simply from getting a voice-activated application and asking questions relevant to your products and business. You can learn what the assistants can answer and what the gaps in their answers are and how you can rewrite your product description accordingly. Further, you can bulk query assistants and classify the results by type to pick a key phrase where we could provide an answer either with a web answer box or using a Google action. If you don’t have a device you can use https://echosim.io/ welcome or https://allo.google.com/ which are web versions of the two assistants.
Conversational approach. In order to optimize content for voice search, you need to understand how your audience speaks about your products and services and what questions they ask. The content you create should answer those questions or include these more natural language queries, including conversational keywords or long-tail keywords . Modify your SEO strategy to include researching and understanding LSI (latent semantic indexing) keywords. LSI keywords are closely related to or synonyms of your main keyword and are natural language variations that can help your content rank for your main keyword and more. So, using synonyms and trying to give the searcher all the information they can consume related to their query, is likely to increase the site visibility. These tricks will enable you to create content that helps search engines determine the context of the page so it can deliver the right content based on user intent.
Data structuring. Structuring of data for a growing number of informational queries will be a logical evolution of SEO. Structured data is a code added to HTML markup that is used by search engines to better understand a site’s content. Therefore, structured data can help search engines crawl and read your content efficiently. With schema markup, you can better control the way you provide information about your brand, and the way machines interpret it. Implementing structured data results in more powerful snippets.

Featured snippets. Featured snippets are selected search results that are featured on top of Google’s organic results below the ads in a box and are believed to provide the most relevant content or to give a direct answer. They are known to increase click-through rate, drive traffic, and bring you competitive advantages. You can be sure that if the results include a featured snippet, your voice assistant will pull its answer from there.
So if you optimize for voice search what you’re really optimizing for is featured snippets. This means looking at the featured snippets that appear for queries you’d like to rank for and considering whether the format of that snippet is ideal. If it looks optimal, you can mimic it with your content to take its place (same format but better quality) and if not, produce content that would rank but in a format that makes more sense. For example, if a question can be better answered by a list — make content that includes a list, not a long description.
User intent. User intent tells us the reason a person entered a query into a search engine: to buy a product or to look for a recommendation, to compare different options, or to get new information? Sometimes the intent is obvious and clearly expressed in the query with words such as “buy,” “price,” “how-to,” “what is,” etc. But other times, intent hides only in a user’s mind. To enhance the relevance of your pages to specific search queries you should always consider user intent when creating content. To succeed, businesses should seek to answer questions, and provide details wherever possible. At the same time, the same steps you take to optimize for answer boxes are going to help you in voice search.
Mobile-friendly is voice-friendly. The recent course of development of search algorithms has already made search engine marketing a “mobile-first” environment. Since most voice searches come from mobile devices, it might be beneficial to focus specifically on voice search optimization. Besides, much of what you can do to optimize for voice search is also beneficial for mobile-first optimization.

It is still dubious whether one day we’ll see that search engines switch to prioritizing voice-friendly results or our habits of typing queries into search engines fade away, but voice commands will undoubtedly have a big impact on search marketing. Since almost every effort you can take to optimize for voice search might be beneficial to your SEO efforts overall, it is a good idea to start focusing on voice optimization. Incorporating voice search optimization strategies into your overall optimization efforts can help you ensure you’re prepared for the voice-driven future.
0 notes
Text
Computational Aesthetics: shall We Let Computers Measure Beauty?

As we all know, tastes differ and change over time. However, each epoch tried to define its own criteria for beauty and aesthetics. As science was developing, so was the urge to measure beauty quantitatively. Not surprisingly, the recent advancements in Artificial Intelligence pushed forward the question of whether intelligent models can overcome what seems to be human subjectivity.
A separate subfield of artificial intelligence (AI), called ‘computational aesthetics’, was created to assess beauty in domains of human creative expression such as music, visual art, poetry, and chess problems. Typically, it uses mathematical formulas that represent aesthetic features or principles in conjunction with specialized algorithms and statistical techniques to provide numerical aesthetic assessments. Computational aesthetics merges the study of art appreciation with analytic and synthetic properties to bring into view the computational thinking artistic outcome.
Brief History of Computational Aesthetics
Though we are used to thinking about Artificial Intelligence as a recent development, computational aesthetics can be traced back as far as 1933, when American mathematician George David Birkhoff in “Aesthetic Measure” proposed the formula M = O/C where M is the “aesthetic measure,” O is order, and C is complexity. This implies that orderly and simple objects appear to be more beautiful than chaotic and/or complex objects. Order and complexity are often regarded as two opposite aspects, thus, order plays a positive role in aesthetics while complexity often plays a negative role. Birkhoff applied that formula to polygons and artworks as different as vases and poetry, and is considered to be the forefather of modern computational aesthetics.
In the 1950s, German philosopher Max Bense and French engineer Abraham Moles independently combined Birkhoff’s work with Claude Shannon’s information theory to develop a scientific means of grasping aesthetics. These ideas found their niche in the first computer-generated art but did not feel close to human perception.
In the early 1990s, the International Society for Mathematical and Computational Aesthetics (IS-MCA) was founded. This organization is specialized in design with an emphasis on functionality and aesthetics and attempts to be a bridge between science and art.
In the 21st century, computational aesthetics is an established field with its own specialized conferences, workshops, and special issues of journals uniting researchers from diverse backgrounds, particularly AI and computer graphics.
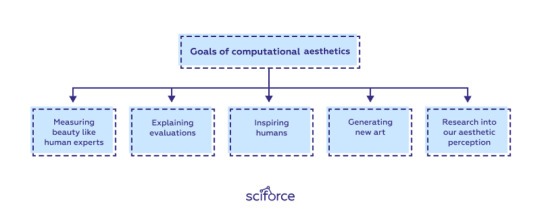
Objectives of Computational Aesthetics
The ultimate goal of computational aesthetics is to develop fully independent systems that have or exceed the same aesthetic “sensitivity” and objectivity as human experts. Ideally, machine assessments should correlate with human experts’ assessment and even go beyond it, overcoming human biases and personal preferences.
Additionally, those systems should be able to explain their evaluations, inspire humans with new ideas, and generate new art that could lie beyond typical human imagination.
Finally, computing aesthetics can also provide a deeper understanding of our aesthetic perception.
In practical terms, computational aesthetics can be applied in various fields and for various purposes. To name a few, aesthetics can be used in the following applications:
as one of the ranking criteria for image retrieval systems;
in image enhancement systems;
managing image or music collections;
improving the quality of amateur art;
distinguishing between videos shot by professionals and by amateurs;
aiding human judges to avoid controversies, etc.
Features
The backbone of all classifiers is a robust selection of features that can be associated with the perception of a certain form of art. In the search for correlation with human perception, aesthetic systems apply specific sets of features for visual art and music that are developed by theorists in arts and domain experts.
Visual Art
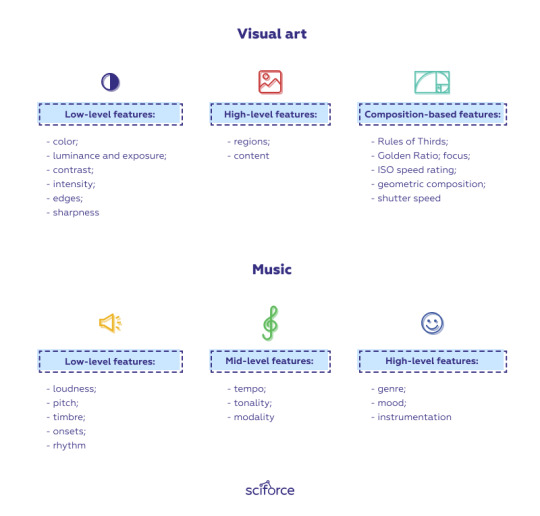
Image aesthetic features could be categorized as low-level or high-level plus composition-based. However, some research is based on features related to saliency (Zhang and Sclaroff, 2013), object (Roy et al., 2018), and information theory (Rigau,1998). The selection of features largely depends on the type of art and the level of abstraction, as well as the algorithm applied. For instance, photography assessment relies heavily on the compositional aspects, while measurement of the beauty of abstract art requires another approach assessing color harmony or symmetry (Nishiyama et al.,2011).
Low-level features try to describe an image objectively and intuitively with relatively low time and space complexity. They include color, luminance and exposure, contrast, intensity, edges, and sharpness.
High-level features include regions and contents as aspects that make great contributions to overall human aesthetic judgment and try to establish the regions of an image that seem to be more important for human judgment and find the correlation between the content and human reaction.
Composition-based features differ for photography and artwork and may include depending on the form of art a range of features, such as Rules of Thirds, Golden Ratio (Visual Weight Balance), focus and focal length, ISO speed rating, geometric composition and shutter speed (Aber et al., 2010).
Music
Similarly to image analysis, music aesthetics assessments try to combine research in human perception and cognition of basic dimensions of sound, such as loudness or pitch and in higher-level concepts related to music, including the perception of its emotive content (Juslin and Laukka, 2004), as well as performance specific traits (Palmer, 1997) to develop a comprehensive set of features that would be able to assess a piece of music.
In 2008, Gouyon et al. offered a hierarchy organized in three levels of abstraction starting from the most fundamental acoustic features, to be extracted directly from the signal, and progressively building on top of them to get to model more complex concepts derived from music theory and even from cognitive and social phenomena:
Low-level features are related to the physical aspect of the signal and include loudness, pitch, timbre, onsets, and rhythm (e.g., see Justus and Bharucha, 2002).
Mid-level features move to a higher level of abstraction within the music theory and cover tempo, tonality, modality, etc.
High-level features try to establish a correlation between abstract music descriptors like genre, mood, and instrumentation and human perception.
Methods and Algorithms
At its broadest, we can speak of computational aesthetics as a tool to assess aesthetics in visual art or music and as a means to generate new art.
For aesthetics assessment, various algorithms have been proposed over the past few years based either on classification or clusterization.
Classification approach
There are a number of algorithms that are extensively used to assess image aesthetics by means of classification. Among the most popular are AdaBoost, Naive Bayes, and Support Vector Machine, and substantial work is also conducted using Random Forests and Artificial Neural Networks (ANNs).
AdaBoost in computational aesthetics is a widely used method that is believed to render the best results. It was first offered in 2008 by Luo and Tang who conducted a study on photo quality evaluation, with the unique characteristic of focusing on the subject. They utilized Gentle AdaBoost (Torralba et al., 2004), a variant of AdaBoost that uses a specific way of weighting its data, applying less weight to outliers. The success rate obtained was 96%. However, when Khan and Vogel (2012) utilized their proposed set of features for photographic portraiture aesthetic classification, the accuracy rate with the multiboosting variant (multi-class version) of AdaBoost fell to 59.14% (Benbouzid et al., 2012).
Naïve Bayes is another popular method that was used in the same study by Luo and Tang (2008). In 2009, Li and Chen utilized the Naïve Bayes classifier to aesthetically classify paintings in which the results were described as robust. The success rate achieved utilizing a Bayesian classifier was 94%.

Support Vector Machine is probably the most wide-spread algorithm for binary classification in computational aesthetics. It has been used since 2006 when Datta et al. studied the correlation between a defined set of features and their aesthetic value, by using a previously rated set of photographs and showed up to 76% of accuracy. Other studies that rested on the same classifier include Li and Chen (2009) who aesthetically classified paintings; Wong and Low (2009) who built a classification system of professional photos and snapshots, Nishiyama et al. (2011) who conducted a research on the aesthetic classification of photographs based on color harmony, and others, with an average accuracy rate of about 75% and higher.
Random Forest, though usually showing lower results as compared to Bayesian classifiers or AdaBoost, were used in a number of studies of photograph aesthetics. For instance, Ciesielski et al. (2013) achieved a 73% accuracy to assess photograph aesthetics. Khan and Vogel (2012) utilizing their proposed set of features for photographic portraiture aesthetic classification, achieved an accuracy of 59.79% by making use of random forests (Breiman, 2001).

Artificial Neural Networks (ANNs) rendered extremely good results when used with compression-based features by Machado et al. (2007) and Romero et al. (2012). The former research aimed at the identification of the author of a set of paintings and reported a success rate from 90.9% to 96.7%. The latter work used an ANN classifier to predict the aesthetic merit of photographs at a success rate of 73.27%.
Convolutional Neural Networks (CNNs) are state-of-the-art deep learning models for rating image aesthetics that have been extensively used in the past few years. CNNs learn a hierarchy of filters, which are applied to an input image in order to extract meaningful information from the input. For example, Denzler et al. (2016) applied the AlexNet model (Krizhevsky et al., 2012) on different datasets to experimentally evaluate how well pre-learned features of different layers are suited to distinguish art from non-art images using an SVM classifier. They report the highest discriminatory power with a Network trained on the ImageNet dataset, which outperforms a network solely trained on natural scenes.
Clustering
Image clustering is a very popular unsupervised learning technique. By grouping sets of image data in a particular way, it maximizes the similarity within a cluster, simultaneously minimizing the similarity between clusters. In computational aesthetics, researchers use K-Means, Fuzzy Clustering, and Spectral Clustering in image analysis.
K-Means Clustering is widely used to analyze the color scheme of an image. For instance, Datta et al. (2006) used k-means to compute two features to measure the number of distinct color blobs and disconnected large regions in a photograph. Lo et al. (2012) utilized this method to find dominant colors in an image.

Fuzzy Clustering is a form of clustering in which each data point can belong to more than one cluster, therefore it is used in multi-class classification (see, for example, Felci Rajam and Valli (2011)). Celia and Felci Rajam (2012) utilized FCM clustering for effective image categorization and retrieval.
Spectral Clustering is used to identify communities of nodes in a graph based on the edges connecting them. In computational aesthetics, a spectral clustering technique named normalized cuts (Ncut) was used to organize images with similar feature values (Zakariya et al., 2010).
Generative models
A separate task of computational aesthetics is to generate artwork independently from human experts. At present, the algorithm that is best known for directly learning the transformations between images from the training data is Generative Adversarial Network(GAN). GANs automatically learn the appropriate operations from the training data and, therefore, have been widely adopted for many image-enhancement applications, such as image super-resolution and image denoising. Machado et al. (2015) also used GANs for automatically enhancing image aesthetics by performing mainly tone adjustment.
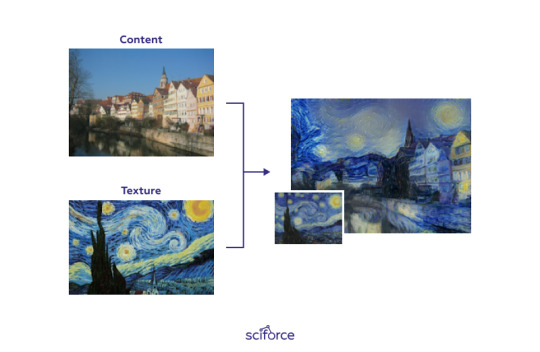
Example that combines the content of a photo with a well-known artwork
Conclusion: Restrictions and Limitations
Aspiring to reach objectivity, research in computational aesthetics tries to reduce the focus to form, rather than to content and its associations to a person’s mind and memories. However, from a psychophysiological viewpoint, it is not clear whether we can have a dichotomy here or whether aesthetics is intrinsically subjective.
Besides, it is difficult to ascertain whether a system that performs on the same level as a human expert is actually using similar mechanisms as the human brain and, therefore, whether it reveals something about human intelligence.
It might be that in the future we will rely on machines in our artistic preferences, but for now, human experts will dictate their opinions and try to get machines simulate their choices.
34 notes
·
View notes
Text
Is AI Democratization a Real Thing?

In the last decades, we’ve seen tremendous advancements in Artificial Intelligence (AI) and related fields. It is viewed not only as a ground-breaking technology, but as a step forward to the future having the means to change our society. We expect AI to use hardware and software to see and hear patterns, make predictions, learn and improve, and take action with this intelligence. Some enthusiasts believe that AI can be a tool that will guide us to a better world showing how to achieve more. In this context, new questions have been raised of power and pervasiveness of such technologies. However, many IT companies claim that AI will democratize AI and will make it available “for every person and every organization”, open to developers and researchers around the world. But does AI really democratize our world? And is it only a positive development?
What does AI democratization mean?
When we say that something is democratized, we imply that all people can access it and benefit from it. In enterprise IT, to democratize AI means to make it accessible for every organization or even to every person within the organization. Such dissemination of AI is indeed beneficial in many respects:
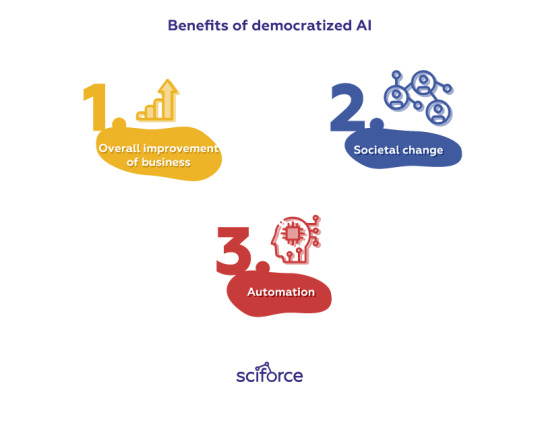
Benefits of democratized AI
Overall improvement of business — AI currently encompasses cloud suites, NLP-based virtual assistants to run business, improve customer’s experience and increase stats;
Societal change — as the awareness and the usage of AI grows, it gains more power to address global issues, like fighting climate change, tracking police work to avoid unfair targeting, or developing new standards in healthcare;
Automation — Gartner predicts that many of these tools will be automated, offering a completely new level of self-service that will free up companies’ potential.
What do we see today?
It is true that many companies, first of all tech startups and market giants, deploy artificial intelligence of some kind: machine learning does their predictions, natural language processing is improving their communication with clients, and sophisticated deep learning algorithms detect anomalies in their processes. However, many companies do not have the resources to build AI of their own and have to rely on cloud technologies to fill the gaps. For companies that are not tech-savvy, AI often feels complicated or overwhelming and it can be downright expensive, especially when engaging data science.
In this context, big tech firms end up way ahead of the curve, other enterprises can hardly catch them up, or even benefit from AI. To understand whether true AI democratization is achievable, let’s discuss what aspects of the market and inherent characteristics of AI add to inequality and what measures are taken to make AI available for everyone:
Data is the King
Data is the key to successful AI-driven intelligence and the more data we create, fuelling the so-called new “data economy”, the smarter products and services we can develop. Data seems to be an increasingly important asset and often the only significant advantage over the competition and as a result it is vigorously kept private. Undeniably, having access to all data produced by your devices or every trace of your digital presence and being able to cross-correlate them across different platforms, services and people give an enormous power. To understand the scale, we can think of the monopolizing presence of IT giants like Facebook or Google in our daily digital life. This is completely rightful and strategically sound, but unfortunately completely in contrast with the AI democratization process.
We are promised that the monopolizing effect is mitigated by new algorithms that offer insightful predictions even with limited datasets. However, best results are still achieved with gigantic amounts of data, so to make AI available to everyone, we first need to make data available to every interested party via open and shared datasets. AI democratization can not work if we do not democratize data first.
At the same time, access to data is only the first step towards AI democratization, since it is not the amount of data that wins the competition, but the ability to use it.
Technical Illiteracy
In many cases, we do not think of the amount of digital data we produce in the world where every “like” on Facebook counts. At the enterprise-level, companies that are not technically savvy, are easily misled by complicated Ai solutions. Major AI companies intentionally take advantage of the common illiteracy in AI by oversimplifying and even undermining more serious AI democratization approaches. Similarly to data ownership, concerns are raised on the dangerous monopolization of AI technologies by only a few organizations.
Network Effect
An extension of such monopolization is the “network effect”, a social and economic phenomenon where an increased number of users improves the value of a good or service in turn attracting more participants and triggering a virtuous cycle. This effect makes the situation even more unequal, as the tech giants gather most of the participants, their data and, as a result, intelligence — just think of Google and Baidu that detain ~86% the entire market share.

AI Talents
As big companies have more resources, they open up their doors to the best scientists, creating advanced labs for AI research with infinite resources. This has led to great advancements and speed-up in AI research. At the same time, tech giants tend to open up their AI research labs, giving the researchers the freedom to collaborate with other institutions or make everything open-source.
Does it add to democratization of AI? From the inspirational point of view, yes, since everyone now can download the sample code and try to use it in any project.
However, in reality the results are not always reproducible, and what tech giants achieve is free improvement and testing of their open-source tools.
Cloud
Most companies who successfully deploy AI have to invest heavily on the tech side. The enterprises that have more limited resources or that have no wish to engage in the full circle of AI research and development can get more affordable cloud solutions. The cheaper cloud tech gets, more AI tools can exist offering immediate solutions. Besides, as clouds make AI more accessible, more people can specialize in it, decreasing salary costs to companies for these data-specific jobs.

As we can see, democratization in reality is a myth as the access to AI is limited, on the one hand, by the resources and knowledge a company has and, on the other hand, by the amount of data and technology tech giants are eager to share. However, the lack of accessibility is not necessarily totally bad. Data quality is often uncertain, to say the least. When relying on a combination of entry-level AI specialists typical for smaller companies and automated or self-service AI tools, companies may be relying on data that is poor and produces unstable solutions. Results from poor data can ripple across the business, with unanticipated outcomes not evident until it’s too late.
Another problem we may face as AI democratizes is the bureaucracy inherent to many enterprises that will prevent companies and employees from acting quickly. Yet, it is the only way that intelligence can actually make a difference — if it is applied at the right time, which often arrives faster than a board can enact a decision.
To sum up, AI is indeed our future, and we’ll see the technology getting more accessible to everyone. However, like in human democracy, we’ll need a system of checks and balances to ensure that the AI-driven world remains afloat.
1 note
·
View note
Text
Text Preprocessing for NLP and Machine Learning Tasks

As soon as you start working on a data science task you realize the dependence of your results on the data quality. The initial step — data preparation — of any data science project sets the basis for effective performance of any sophisticated algorithm.
In textual data science tasks, this means that any raw text needs to be carefully preprocessed before the algorithm can digest it. In the most general terms, we take some predetermined body of text and perform upon it some basic analysis and transformations, in order to be left with artefacts which will be much more useful for a more meaningful analytic task afterward.
The preprocessing usually consists of several steps that depend on a given task and the text, but can be roughly categorized into segmentation, cleaning, normalization, annotation and analysis.
Segmentation, lexical analysis, or tokenization, is the process that splits longer strings of text into smaller pieces, or tokens. Chunks of text can be tokenized into sentences, sentences can be tokenized into words, etc.
Cleaning consists of getting rid of the less useful parts of text through stop-word removal, dealing with capitalization and characters and other details.
Normalization consists of the translation (mapping) of terms in the scheme or linguistic reductions through stemming, lemmatization and other forms of standardization.
Annotation consists of the application of a scheme to texts. Annotations may include labeling, adding markups, or part-of-speech tagging.
Analysis means statistically probing, manipulating and generalizing from the dataset for feature analysis and trying to extract relationships between words.
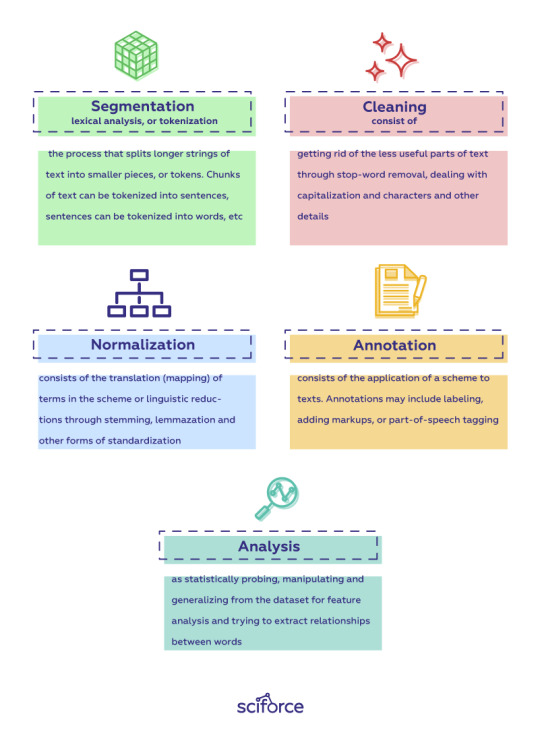
Segmentation
Sometimes segmentation is used to refer to the breakdown of a text into pieces larger than words, such as paragraphs and sentences, while tokenization is reserved for the breakdown process which results exclusively in words.
This may sound like a straightforward process, but in reality it is anything but. Do you need a sentence or a phrase? And what is a phrase then? How are sentences identified within larger bodies of text? The school grammar suggests that sentences have “sentence-ending punctuation”. But for machines the point is the same be it at the end of an abbreviation or of a sentence.
“Shall we call Mr. Brown?” can easily fall into two sentences if abbreviations are not taken care of.
And then there are words: for different tasks the apostrophe in he’s will make it a single word or two words. Then there are competing strategies such as keeping the punctuation with one part of the word, or discarding it altogether.
Beware that each language has its own tricky moments (good luck with finding words in Japanese!), so in a task that involves several languages you’ll need to find a way to work on all of them.
Cleaning
The process of cleaning helps put all text on equal footing, involving relatively simple ideas of substitution or removal:
setting all characters to lowercase
noise removal, including removing numbers and punctuation (it is a part of tokenization, but still worth keeping in mind at this stage)
stop words removal (language-specific)
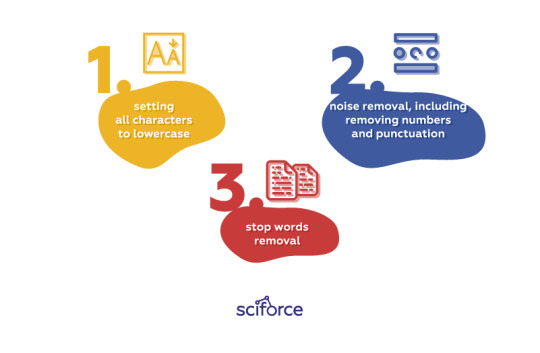
Lowercasing
Text often has a variety of capitalization reflecting the beginning of sentences or proper nouns emphasis. The common approach is to reduce everything to lower case for simplicity. Lowercasing is applicable to most text mining and NLP tasks and significantly helps with consistency of the output. However, it is important to remember that some words, like “US” and “us”, can change meanings when reduced to the lower case.
Noise Removal
Noise removal refers to removing characters digits and pieces of text that can interfere with the text analysis. There are various ways to remove noise, including punctuation removal, special character removal, numbers removal, html formatting removal, domain specific keyword removal, source code removal, and more. Noise removal is highly domain dependent. For example, in tweets, noise could be all special characters except hashtags as they signify concepts that can characterize a tweet. We should also remember that strategies may vary depending on the specific task: for example, numbers can be either removed or converted to textual representations.
Stop-word removal
Stop words are a set of commonly used words in a language like “a”, “the”, “is”, “are” and etc in English. These words do not carry important meaning and are removed from texts in many data science tasks. The intuition behind this approach is that, by removing low information words from text, we can focus on the important words instead. Besides, it reduces the number of features in consideration which helps keep your models better sized. Stop word removal is commonly applied in search systems, text classification applications, topic modeling, topic extraction and others. Stop word lists can come from pre-established sets or you can create a custom one for your domain.
Normalization
Normalization puts all words on equal footing, and allows processing to proceed uniformly. It is closely related to cleaning, but brings the process a step forward putting all words on equal footing by stemming and lemmatizing them.
Stemming
Stemming is the process of eliminating affixes (suffixes, prefixes, infixes, circumfixes) from a word in order to obtain a word stem. The results can be used to identify relationships and commonalities across large datasets. There are several stemming models, including Porter and Snowball. The danger here lies in the possibility of overstemming where words like “universe” and “university” are reduced to the same root of “univers”.
Lemmatization
Lemmatization is related to stemming, but it is able to capture canonical forms based on a word’s lemma. By determining the part of speech and utilizing special tools, like WordNet’s lexical database of English, lemmatization can get better results:
The stemmed form of leafs is: leaf
The stemmed form of leaves is: leav
The lemmatized form of leafs is: leaf
The lemmatized form of leaves is: leaf
Stemming may be more useful in queries for databases whereas lemmazation may work much better when trying to determine text sentiment.

Annotation
Text annotation is a sophisticated and task-specific process of providing text with relevant markups. The most common and general practice is to add part-of-speech (POS) tags to the words.
Part-of-speech tagging
Understanding parts of speech can make a difference in determining the meaning of a sentence as it provides more granular information about the words. For example, in a document classification problem, the appearance of the word book as a noun could result in a different classification than book as a verb. Part-of-speech tagging tries to assign a part of speech (such as nouns, verbs, adjectives, and others) to each word of a given text based on its definition and the context. It often requires looking at the proceeding and following words and combined with either a rule-based or stochastic method.
Analysis
Finally, before actual model training, we can explore our data for extracting features that might be used in model building.
Count
This is perhaps one of the more basic tools for feature engineering. Adding such statistical information as word count, sentence count, punctuation counts and industry-specific word counts can greatly help in prediction or classification.
Chunking (shallow parsing)
Chunking is a process that identifies constituent parts of sentences, such as nouns, verbs, adjectives, etc. and links them to higher order units that have discrete grammatical meanings, for example, noun groups or phrases, verb groups, etc..
Collocation extraction
Collocations are more or less stable word combinations, such as “break the rules,” “free time,” “draw a conclusion,” “keep in mind,” “get ready,” and so on. As they usually convey a specific established meaning it is worthwhile to extract them before the analysis.
Word Embedding/Text Vectors
Word embedding is the modern way of representing words as vectors to redefine the high dimensional word features into low dimensional feature vectors. In other words, it represents words at an X and Y vector coordinate where related words, based on a corpus of relationships, are placed closer together.
Preparing a text for analysis is a complicated art which requires choosing optimal tools depending on the text properties and the task. There are multiple pre-built libraries and services for the most popular languages used in data science that help automate text pre-processing, however, certain steps will still require manually mapping terms, rules and words.
3 notes
·
View notes
Text
How to Make Team Communication Effective When Working Remotely?

So, your team has fully moved to remote work. You are probably already used to working in your pajamas, having endless snacks and communicating with your colleagues via Slack or Zoom. And suddenly you find out that your work has become less effective. It’s all about the discipline, you think at first. And your team thinks the same. And your manager. And to get your work back under control you start inventing new means of communication, having more meetings and then a few more. When hearing others’ experience with home office, the most common complaint (apart from having children at home, of course) is spending too much time on meetings. What can we do not to feel drowning in them?
In this blog post, we offer some possibilities to consider that might make your communication less disruptive and help you focus on your work instead of distracting from it.
Strategy 1. Document more
It sounds counter-intuitive — no one likes spending time on documenting each step or filling in lists of specifications and instructions. However unpleasant the process may be, it will boost the company’s effectiveness: on-site, people come up to each other’s desks to ask questions or just listen to conversations. Though fast and informal, this method can lead to rumors-like communication where the truth is eventually lost. With proper documentation, the team has a single reliable source of truth for all questions.
Make documentation everyone’s responsibility
Docs as Code is the approach that is gaining momentum now. It treats documents as a part of your code, ensuring version control, cooperation with other team members — and the importance of writing documentation for everyone. Even outside IT, this approach ensures that over time, teams that own their documents grow more responsible and respectful to one another’s time, move fast by adding changes to already existing docs, and are able to communicate the knowledge effectively across teams and to newcomers.

Write handbooks
Having documentation on the project somewhere in Gitlab is good, but when you don’t have a handbook that is reliably actionable, it can feel burdensome to seek answers in a repository. Handbooks usually are more human-friendly, as people tend to trust other humans who address them directly more than abstract words written online.
Documenting all your solutions makes communication more effective for team members who join a project or conversation midstream and need to understand what steps have been taken thus far, new hires who try to catch up with the rest of the team, managers who need to track the work done, and, finally, customers who want to understand what they get.
Strategy 2. Embrace textual communication
A logical extension of documentation, text communication can feel unusual or even uncomfortable for many. In remote environments, or in teams spread across countries with different time zones, communicating through text is ideal. It prevents a vicious cycle of meetings which serve only to “bring people up to speed.” Communicating answers to problems via text makes documentation easier and more trustworthy.
Make notes
When all your meetings are moved online, it’s crucial to maintain a written account of all the words said. Try to write everything down — from meeting notes to quarterly objectives. Before meetings, the lead can create an agenda and ask participants to add items for discussion. During meetings, team members or one person in charge can write down decisions, ideas, or notes to specify who is responsible for specific tasks or to trace the chain of reasoning leading to decisions. Documenting everything makes for a stronger, more informed, more trusting, and more connected team.
Writing down things is far from exciting, but it will provide you with reference that will evolve together with your team.

Strategy 3. Switch to asynchronous communication
We all are most likely used to communicating synchronously — gathering in the same place (physical or virtual) at the same time. An asynchronous workflow allows moving forward even when other stakeholders are unavailable. Asynchronous communication, by definition, is any type of communication where one person provides information and then there is a time lag before the recipients take in the information and offer their responses. Essentially, asynchronous communication is when you send a message without expecting an immediate response. The most common example of such communication is, of course, sending an email.
The major benefit of asynchronous communication is that it relieves employees from the burden of being always online and ready to react. Constant disruption of the work with requests for immediate reaction does not allow team members to concentrate and dive into the project, increases the stress and reduces their productivity.
However, though there are many tools of asynchronous communication — Google Drive, Monday, or Asana, to name just a few, they all have one prerequisite: a standardized method of documentation. Without a corporate standard, team members will be left to determine their own methods for communicating, that will inevitably lead to chaotic document movement across teams and departments.
Strategy 4. Make meetings optional
When we all have to work from home, sitting at another meeting becomes even more frustrating than ever. The way to avoid spending time on unnecessary meetings is to make them optional to attend. It is easy to reduce the number of mandatory meetings, if every meeting has an agenda that the team can collaborate on. The simplest way is to create a Google Doc that allows the team to contribute or modify questions. When the agenda is shaped, every person can decide whether to participate, or to catch up on the outcomes afterwards.
However, it is necessary to assure that all the information will not be lost even if some team members aren’t able to join you online. For example, Loom and Zoom allow recording meetings, which is particularly useful when some of the key stakeholders are absent.
Probably, the idea of “optional meetings” is absurd to those who are used to synchronous communication, but with the team working remotely, it is handy to ask people to contribute whenever they have time — with a deadline, of course!

Strategy 5. Maintaining informal communication
When people are physically located in the same place, informal communication is natural: social connections are crucial to build trust within the organization and to encourage knowledge sharing. Moreover, if we have friends at work, we are also more satisfied with our jobs and the company. But when working remotely, it may sound intentional and fake.
Using emojis
One thing that is easily transferred from personal conversations is using emojis to express emotions. Both remote employees and managers should feel comfortable using them in everyday discourse in professional settings. When working remotely, such visual tools bring about a larger pallet of tones and emotions, creating more empathy and the feeling of human connection. On top of this, using custom emojis allows colleagues to develop their own signal language and build more ties between team members.

It goes without saying that we all have a long way to go to adapt to working from home, and the feeling of isolation from your team is only one, though crucial, side of the overall struggle we are all having. The key to quick adaptation is to adopt a strategy and to try to find order in the present-day chaos. Let’s try and clean up our communication channels — and in the next post, we’ll talk about protecting our workplace from cyberattacks.
3 notes
·
View notes
Text
White Box AI: Interpretability Techniques

While in the previous article of the series we introduced the notion of White Box AI and explained different dimensions of interpretability, in this post we’ll be more practice-oriented and turn to techniques that can make algorithm output more explainable and the models more transparent, increasing trust in the applied models.
The two pillars of ML-driven predictive analysis are data and robust models, and these are the focus of attention in increasing interpretability. The first step towards White Box AI is data visualization because seeing your data will help you to get inside your dataset, which is a first step toward validating, explaining, and trusting models. At the same time, having explainable white-box models with transparent inner workings, followed by techniques that can generate explanations for the most complex types of predictive models such as model visualizations, reason codes, and variable importance measures.
Data Visualization
As we remember, good data science always starts with good data and with ensuring its quality and relevance for subsequent model training.
Unfortunately, most datasets are difficult to see and understand because they have too many variables and many rows. Plotting many dimensions is technically possible, but it does not improve the human understanding of complex datasets. Of course, there are numerous ways to visualize datasets and we discussed them in our dedicated article. However, in this overview, we’ll rely on the experts’ opinions and stick to those selected by Hall and Gill in their book “An Introduction to Machine Learning Interpretability”.
Most of these techniques have the capacity to illustrate all of a data set in just two dimensions, which is important in machine learning because most ML algorithms would automatically model high-degree interactions between multiple variables.
Glyphs
Glyphs are visual symbols used to represent different values or data attributes with the color, texture, or alignment. Using bright colors or unique alignments for events of interest or outliers is a good method for making important or unusual data attributes clear in a glyph representation. Besides, when arranged in a certain way, glyphs can be used to represent rows of a data set. In the figure below, each grouping of four glyphs can be either a row of data or an aggregated group of rows in a data set.
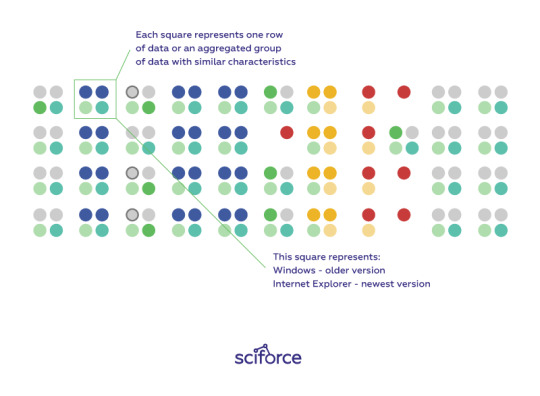
Figure 1. Glyphs arranged to represent many rows of a data set. Image courtesy of Ivy Wang and the H2O.ai team.
Correlation Graphs
A correlation graph is a two-dimensional representation of the relationships (i.e. correlation) in a data set. Even data sets with tens of thousands of variables can be displayed in two dimensions using this technique.
For the visual simplicity of correlation graphs, absolute weights below a certain threshold are not displayed. The node size is determined by a node’s number of connections (node degree), its color is determined by a graph community calculation, and the node position is defined by a graph force field algorithm. Correlation graphs show groups of correlated variables, help us identify irrelevant variables, and discover or verify important relationships that machine learning models should incorporate.
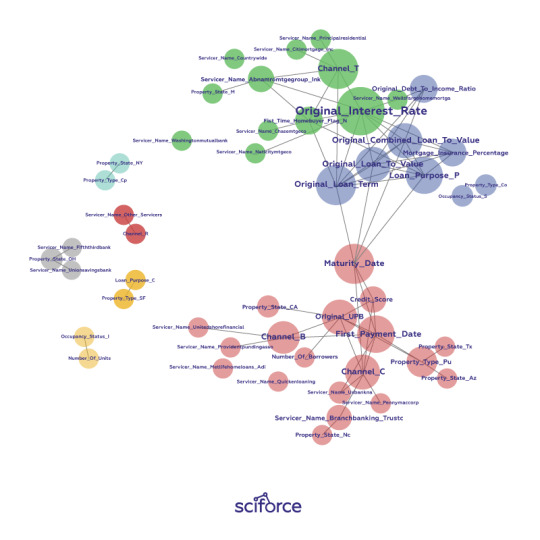
Figure 2. A correlation graph representing loans made by a large financial firm. Figure courtesy of Patrick Hall and the H2O.ai team.
In a supervised model built for the data represented in the figure above, we would expect variable selection techniques to pick one or two variables from the light green, blue, and purple groups, we would expect variables with thick connections to the target to be important variables in the model, and we would expect a model to learn that unconnected variables like CHANNEL_Rare not very important.
2-D projections
Of course, 2-D projection is not merely one technique and there exist any ways and techniques for projecting the rows of a data set from a usually high-dimensional original space into a more visually understandable 2- or 3-D space two or three dimensions, such as:
Principal Component Analysis (PCA)
Multidimensional Scaling (MDS)
t-distributed Stochastic Neighbor Embedding (t-SNE)
Autoencoder networks
Data sets containing images, text, or even business data with many variables can be difficult to visualize as a whole. These projection techniques try to represent the rows of high-dimensional data projecting them into a representative low-dimensional space and visualizing using the scatter plot technique. A high-quality projection visualized in a scatter plot is expected to exhibit key structural elements of a data set, such as clusters, hierarchy, sparsity, and outliers.
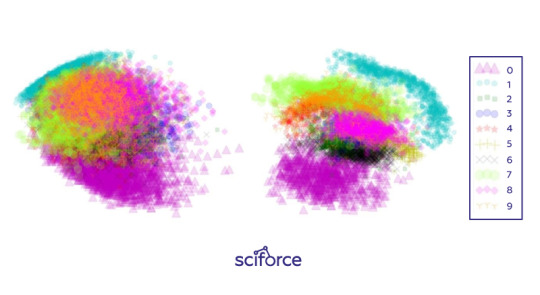
Figure 3. Two-dimensional projections of the 784-dimensional MNIST data set using (left) Principal Components Analysis (PCA) and (right) a stacked denoising autoencoder. Image courtesy of Patrick Hall and the H2O.ai team.
Projections can add trust if they are used to confirm machine learning modeling results. For instance, if known hierarchies, classes, or clusters exist in training or test data sets and these structures are visible in 2-D projections, it is possible to confirm that a machine learning model is labeling these structures correctly. Additionally, it shows if similar attributes of structures are projected relatively near one another and different attributes of structures are projected relatively far from one another. Such results should also be stable under minor perturbations of the training or test data, and projections from perturbed versus non-perturbed samples can be used to check for stability or for potential patterns of change over time.
Partial dependence plots
Partial dependence plots show how ML response functions change based on the values of one or two independent variables, while averaging out the effects of all other independent variables. Partial dependence plots with two independent variables are particularly useful for visualizing complex types of variable interactions between the independent variables. They can be used to verify monotonicity of response functions under monotonicity constraints, as well as to see the nonlinearity, non-monotonicity, and two-way interactions in very complex models. They can also enhance trust when displayed relationships conform to domain knowledge expectations. Partial dependence plots are global in terms of the rows of a data set, but local in terms of the independent variables.
Individual conditional expectation (ICE) plots, a newer and less spread adaptation of partial dependence plots, can be used to create more localized explanations using the same ideas as partial dependence plots.
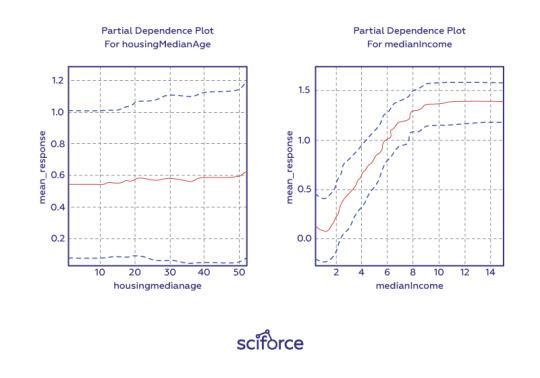
Figure 4. One-dimensional partial dependence plots from a gradient boosted tree ensemble model of the California housing data set. Image courtesy Patrick Hall and the H2O.ai team.
Residual analysis
Residuals refer to the difference between the recorded value of a dependent variable and the predicted value of a dependent variable for every row in a data set. In theory, the residuals of a well-fit model should be randomly distributed because good models will account for most phenomena in a data set, except for random error. Therefore, if models are producing randomly distributed residuals, this is an indication of a well-fit, dependable, trustworthy model. However, if strong patterns are visible in plotted residuals, there are problems with your data, your model, or both. Breaking out a residual plot by independent variables can additionally expose more granular information about residuals and assist in reasoning through the cause of non-random patterns.
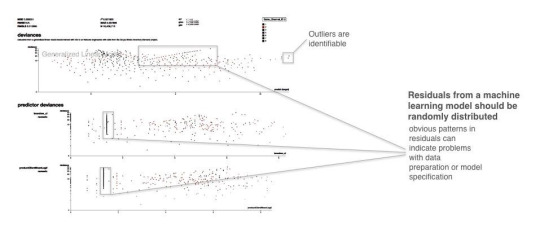
Figure 5. Screenshot from an example residual analysis application. Image courtesy of Micah Stubbs and the H2O.ai team.
Seeing structures and relationships in a data set makes those structures and relationships easier to understand and makes up a first step to knowing if a model’s answers are trustworthy.
Techniques for Creating White-Box Models
Decision trees
Decision trees, predicting the value of a target variable based on several input variables, are probably the most obvious way to ensure interpretability. They are directed graphs in which each interior node corresponds to an input variable. Each terminal node or leaf node represents a value of the target variable given the values of the input variables represented by the path from the root to the leaf. The major benefit of decision trees is that they can reveal relationships between the input and target variable with “Boolean-like” logic and they can be easily interpreted by non-experts by displaying them graphically. However, decision trees can create very complex nonlinear, nonmonotonic functions. Therefore, to ensure interpretability, they should be restricted to shallow depth and binary splits.
eXplainable Neural Networks
In contrast to decision trees, neural networks are often considered the least transparent of black-box models. However, the recent work in XNN implementation and explaining artificial neural network (ANN) predictions may render that characteristic obsolete. Many of the breakthroughs in ANN explanation were made possible thanks to the straightforward calculation of derivatives of the trained ANN response function with regard to input variables provided by deep learning toolkits such as Tensorflow. With the help of such derivatives, the trained ANN response function prediction can be disaggregated into input variable contributions for any observation. XNNs can model extremely nonlinear, nonmonotonic phenomena or they can be used as surrogate models to explain other nonlinear, non-monotonic models, potentially increasing the fidelity of global and local surrogate model techniques.
Monotonic gradient-boosted machines (GBMs)
Gradient boosting is an algorithm that produces a prediction model in the form of an ensemble of weak prediction models, typically decision trees. Used for regression and classification tasks, it is potentially appropriate for most traditional data mining and predictive modeling applications, even in regulated industries and for consistent reason code generation provided it builds monotonic functions. Monotonicity constraints can improve GBMs interpretability by enforcing a uniform splitting strategy in constituent decision trees, where binary splits of a variable in one direction always increase the average value of the dependent variable in the resultant child node, and binary splits of the variable in the other direction always decrease the average value of the dependent variable in the other resultant child node. Understanding is increased by enforcing straightforward relationships between input variables and the prediction target. Trust is increased when monotonic relationships, reason codes, and detected interactions are parsimonious with domain expertise or reasonable expectations.
Alternative regression white-box modeling approaches
There exist many modern techniques to augment traditional, linear modeling methods. Such models as elastic net, GAM, and quantile regression, usually produce linear, monotonic response functions with globally interpretable results similar to traditional linear models but with a boost in predictive accuracy.
Penalized (elastic net) regression
As an alternative to old-school regression models, penalized regression techniques usually combine L1/LASSO penalties for variable selection purposes and Tikhonov/L2/ridge penalties for robustness in a technique known as elastic net. Penalized regression minimizes constrained objective functions to find the best set of regression parameters for a given data set that would model a linear relationship and satisfy certain penalties for assigning correlated or meaningless variables to large regression coefficients. For instance, L1/LASSO penalties drive unnecessary regression parameters to zero, selecting only a small, representative subset of parameters for the regression model while avoiding potential multiple comparison problems. Tikhonov/L2/ridge penalties help preserve parameter estimate stability, even when many correlated variables exist in a wide data set or important predictor variables are correlated. Penalized regression is a great fit for business data with many columns, even data sets with more columns than rows, and for data sets with a lot of correlated variables.
Generalized Additive Models (GAMs)
Generalized Additive Models (GAMs) hand-tune a tradeoff between increased accuracy and decreased interpretability by fitting standard regression coefficients to certain variables and nonlinear spline functions to other variables. Also, most implementations of GAMs generate convenient plots of the fitted splines. That can be used directly in predictive models for increased accuracy. Otherwise, you can eyeball the fitted spline and switch it out for a more interpretable polynomial, log, trigonometric or other simple function of the predictor variable that may also increase predictive accuracy.
Quantile regression
Quantile regression is a technique that tries to fit a traditional, interpretable, linear model to different percentiles of the training data, allowing you to find different sets of variables with different parameters for modeling different behavior. While traditional regression is a parametric model and relies on assumptions that are often not met. Quantile regression makes no assumptions about the distribution of the residuals. It lets you explore different aspects of the relationship between the dependent variable and the independent variables.
There are, of course, other techniques, both based on applying constraints on regression and generating specific rules (like in OneR or RuleFit approaches). We encourage you to explore possibilities for enhancing model interpretability for any algorithm you choose and which is the most appropriate for your task and environment.
Evaluation of Interpretability
Finally, to ensure that the data and the trained models are interpretable, it is necessary to have robust methods for interpretability evaluation. However, with no real consensus about what interpretability is in machine learning, it is unclear how to measure it. Doshi-Velez and Kim (2017) propose three main levels for the evaluation of interpretability:
Application level evaluation (real task)
Essentially, it is putting the explanation into the product and having it tested by the end user. This requires a good experimental setup and an understanding of how to assess quality. A good baseline for this is always how good a human would be at explaining the same decision.
Human level evaluation (simple task)
It is a simplified application-level evaluation. The difference is that these experiments are not carried out with the domain experts, but with laypersons in simpler tasks like showing users several different explanations and letting them choose the best one. This makes experiments cheaper and it is easier to find more testers.
Function level evaluation (proxy task)
This task does not require humans. This works best when the class of model used has already been evaluated by humans. For example, if we know that end users understand decision trees, a proxy for explanation quality might be the depth of the tree with shorter trees having a better explainability score. It would make sense to add the constraint that the predictive performance of the tree remains good and does not decrease too much compared to a larger tree.
Most importantly, you should never forget that interpretability is not for machines but for humans, so the end users and their perception of data and models should always be in the focus of your attention. And humans prefer short explanations that contrast the current situation with a situation in which the event would not have occurred. Explanations are social interactions between the developer and the end user and it should always account for the social (and legal) context and the user’s expectations.
3 notes
·
View notes
Text
How to Find a Perfect Deep Learning Framework

Many courses and tutorials offer to guide you through building a deep learning project. Of course, from the educational point of view, it is worthwhile: try to implement a neural network from scratch, and you’ll understand a lot of things. However, such an approach does not prepare us for real life, where you are not supposed to spare weeks waiting for your new model to build. At this point, you can look for a deep learning framework to help you.
A deep learning framework, like a machine learning framework, is an interface, library or a tool which allows building deep learning models easily and quickly, without getting into the details of underlying algorithms. They provide a clear and concise way for defining models with the help of a collection of pre-built and optimized components.
Briefly speaking, instead of writing hundreds of lines of code, you can choose a suitable framework that will do most of the work for you.
Most popular DL frameworks
The state-of-the-art frameworks are quite new; most of them were released after 2014. They are open-source and are still undergoing active development. They vary in the number of examples available, the frequency of updates and the number of contributors. Besides, though you can build most types of networks in any deep learning framework, they still have a specialization and usually differ in the way they expose functionality through its APIs.
Here were collected the most popular frameworks
TensorFlow

The framework that we mention all the time, TensorFlow, is a deep learning framework created in 2015 by the Google Brain team. It has a comprehensive and flexible ecosystem of tools, libraries and community resources. TensorFlow has pre-written codes for most of the complex deep learning models you’ll come across, such as Recurrent Neural Networks and Convolutional Neural Networks.
The most popular use cases of TensorFlow are the following:
NLP applications, such as language detection, text summarization and other text processing tasks;
Image recognition, including image captioning, face recognition and object detection;
Sound recognition
Time series analysis
Video analysis, and much more.
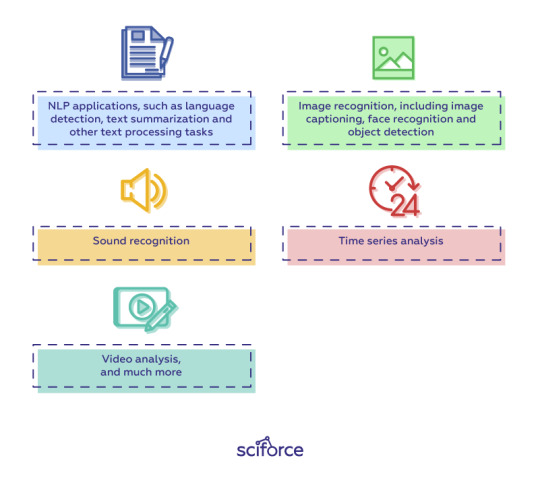
TensorFlow is extremely popular within the community because it supports multiple languages, such as Python, C++ and R, has extensive documentation and walkthroughs for guidance and updates regularly. Its flexible architecture also lets developers deploy deep learning models on one or more CPUs (as well as GPUs).
For inference, developers can either use TensorFlow-TensorRT integration to optimize models within TensorFlow, or export TensorFlow models, then use NVIDIA TensorRT’s built-in TensorFlow model importer to optimize in TensorRT.
Installing TensorFlow is also a pretty straightforward task.
For CPU-only:
pip install tensorflow
For CUDA-enabled GPU cards:
pip install tensorflow-gpu
Learn more:
An Introduction to Implementing Neural Networks using TensorFlow
TensorFlow tutorials
PyTorch

PyTorch
Facebook introduced PyTorch in 2017 as a successor to Torch, a popular deep learning framework released in 2011, based on the programming language Lua. In its essence, PyTorch took Torch features and implemented them in Python. Its flexibility and coverage of multiple tasks have pushed PyTorch to the foreground, making it a competitor to TensorFlow.
PyTorch covers all sorts of deep learning tasks, including:
Images, including detection, classification, etc.;
NLP-related tasks;
Reinforcement learning.
Instead of predefined graphs with specific functionalities, PyTorch allows developers to build computational graphs on the go, and even change them during runtime. PyTorch provides Tensor computations and uses dynamic computation graphs. Autograd package of PyTorch, for instance, builds computation graphs from tensors and automatically computes gradients.
For inference, developers can export to ONNX, then optimize and deploy with NVIDIA TensorRT.
The drawback of PyTorch is the dependence of its installation process on the operating system, the package you want to use to install PyTorch, the tool/language you’re working with, CUDA and others.
Learn more:
Learn How to Build Quick & Accurate Neural Networks using PyTorch — 4 Awesome Case Studies
PyTorch tutorials
Keras

Keras was created in 2014 by researcher François Chollet with an emphasis on ease of use through a unified and often abstracted API. It is an interface that can run on top of multiple frameworks such as MXNet, TensorFlow, Theano and Microsoft Cognitive Toolkit using a high-level Python API. Unlike TensorFlow, Keras is a high-level API that enables fast experimentation and quick results with minimum user actions.
Keras has multiple architectures for solving a wide variety of problems, the most popular are
image recognition, including image classification, object detection and face recognition;
NLP tasks, including chatbot creation
Keras models can be classified into two categories:
Sequential: The layers of the model are defined in a sequential manner, so when a deep learning model is trained, these layers are implemented sequentially.
Keras functional API: This is used for defining complex models, such as multi-output models or models with shared layers.
Keras is installed easily with just one line of code:
pip install keras
Learn more:
The Ultimate Beginner’s Guide to Deep Learning in Python
Keras Tutorial: Deep Learning in Python
Optimizing Neural Networks using Keras
Caffe

The Caffe deep learning framework created by Yangqing Jia at the University of California, Berkeley in 2014, and has led to forks like NVCaffe and new frameworks like Facebook’s Caffe2 (which is already merged with PyTorch). It is geared towards image processing and, unlike the previous frameworks, its support for recurrent networks and language modeling is not as great. However, Caffe shows the highest speed of processing and learning from images.
The pre-trained networks, models and weights that can be applied to solve deep learning problems collected in the Caffe Model Zoo framework work on the below tasks:
Simple regression
Large-scale visual classification
Siamese networks for image similarity
Speech and robotics applications
Besides, Caffe provides solid support for interfaces like C, C++, Python, MATLAB as well as the traditional command line.
To optimize and deploy models for inference, developers can leverage NVIDIA TensorRT’s built-in Caffe model importer.
The installation process for Caffe is rather complicated and requires performing a number of steps and meeting such requirements, as having CUDA, BLAF and Boost. The complete guide for installation of Caffe can be found here.
Learn more:
Caffe Tutorial
Choosing a deep learning framework
You can choose a framework based on many factors you find important: the task you are going to perform, the language of your project, or your confidence and skillset. However, there are a number of features any good deep learning framework should have:
Optimization for performance
Clarity and ease of understanding and coding
Good community support
Parallelization of processes to reduce computations
Automatic computation of gradients
Model migration between deep learning frameworks
In real life, it sometimes happens that you build and train a model using one framework, then re-train or deploy it for inference using a different framework. Enabling such interoperability makes it possible to get great ideas into production faster.
The Open Neural Network Exchange, or ONNX, is a format for deep learning models that allows developers to move models between frameworks. ONNX models are currently supported in Caffe2, Microsoft Cognitive Toolkit, MXNet, and PyTorch, and there are connectors for many other popular frameworks and libraries.
New deep learning frameworks are being created all the time, a reflection of the widespread adoption of neural networks by developers. It is always tempting to choose one of the most common one (even we offer you those that we find the best and the most popular). However, to achieve the best results, it is important to choose what is best for your project and be always curious and open to new frameworks.
10 notes
·
View notes
Text
Memorability in Computer Vision

Among many things that define us as humans, there is our ability to remember things such as images in great detail, and sometimes after a single view. What is even more interesting, humans tend to remember and forget the same things, suggesting that there might be some general internal capability to encode and discard the same types of information.
What makes certain images more memorable than others? Research suggests that pictures of people, salient actions and events are more memorable than natural landscapes and images that lack distinctiveness will soon be forgotten. We can conclude that memorable and forgettable images must have certain intrinsic visual features, making some information easier to remember than others. To prove this fact, a number of computer vision projects, such as Isola 2011, Khosla 2013, Dubey 2015 managed to reliably estimate the memorability ranks of novel pictures. However, the task to predict image memorability is quite complex: images that are memorable do not even look alike. A baby elephant, a kitchen, an abstract painting and an old man’s face can have the same level of memorability, but no visual recognition algorithm would cluster them together. So what are the common visual features of memorable, or forgettable, images? And is it ever possible to predict which images people will remember?
What is memorability?
Memorability is a relatively new concept in computer vision that assesses the chance that a particular image will be stored in either short-term or long-term memory. From the psychological perspective, visual memory has been a focus of attention in research for decades: for instance, thanks to psychological research, we know that different images are more or less remembered depending on many factors concerning intrinsic visual appearance and user’s context. In computer vision, researchers have revealed that color, simple image features derived from pixel statistics, and object statistics, such as number of objects, do not have strong correlation with memorability. The factors that play a role are object and scene semantics, aesthetics and interestingness and high-level visual attributes (such as emotions, actions, movements, appearance of objects, etc.,). Besides, people tend to memorize the same images, which gives us hope that memorability is something that we can measure and predict.
Memorability data sets
It is well-known that the basis for any successful ML project is the availability of extensive and meaningful data. With more advancement in memorability research, several small datasets were developed and publicly released as a part of specific projects, including face photographs, scene categories, visualization pictures, and affective impact on image memorability.
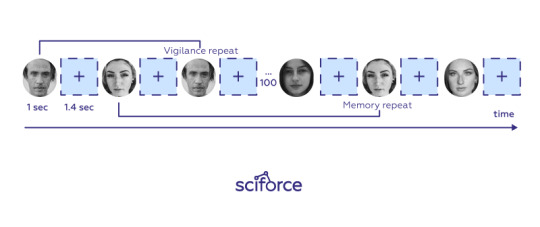
The most important is the MIT’s large-scale image memorability dataset (LaMem) containing roughly 60,000 images annotated by crowdsourcing that was published together with a memorability prediction model (MemNet) for benchmarking the task.
As the visual memory studies progress, new research has expanded to cover video memorability that also resulted in a creation of the large-scale VideoMem dataset containing 10,000 soundless videos of 7 seconds.
How to predict memorability
In recent years, a number of projects in deep learning emerged to address the task of memorability prediction. The models they introduced managed to achieve results close to human consistency (0.68), with the model called MemNet being the most prominent one.
Memorability prediction as a regression task
The established idea is to treat memorability prediction as a regression task. Among a number of proposed models, MemNet developed by MIT is considered to be the most successful and well-known one. It is based on convolutional neural networks (CNN) that have proven successful in various visual recognition tasks [10, 21, 29, 35, 32]. As memorability depends on both scenes and objects, the first step in developing the model was to initialize the training using the pre-trained Hybrid-CNN [37], trained on both ILSVRC 2012 [30] and Places dataset [37]. Since memorability is a single real-valued output, the Hybrid-CNN was fine-tuned with a Euclidean loss layer.
A similar approach is used to predict memorability of videos on the basis of the VideoMem dataset.

Memorability prediction as a classification task
Treating memorability prediction not as a regression, but as a classification task, Technicolor developed a model that could even surpass MemNet. The model used semantic features derived from an image captioning (IC) system. Such an IC model builds an encoder comprising a CNN and a long short-term memory recurrent network (LSTM) for learning a joint image-text embedding. Thus the CNN image feature and the word2vec representation of the image caption are projected on a 2D embedding space which enforces the alignment between an image and its corresponding semantic caption that could be used to predict image memorability. A set of hyper-parameters, including number of neurons per layer, dropout coefficient, activation function and optimizer were selected with the Bayesian optimization library Hyperas 1 to maximize the average Spearman correlation coefficient between the predicted scores and the ground-truth scores in a 5-fold validation process.
Beyond memorability: interestingness and aesthetics
As the ultimate goal of many computer vision tasks is to attract the user’s attention, there is much research on different factors that might increase the chance that users will look at the image or the video and gain the desired information from it. In this quest for factors that contribute to the image relevance, researchers try to find out whether memorability is related to interestingness and aesthetics of a certain image.
In general, interestingness is the power of attracting or holding one’s attention. Like memorability, it is largely studied in psychology resulting in discovering its various sides, such as novelty, uncertainty, conflict and complexity, according to Berlyne. Also like in case with memorability, users show a significant agreement, though finding something interesting is clearly subjective and depends on personal preferences and experiences. However, the bases of image memorability and interestingness are quite different, so there is little correlation.
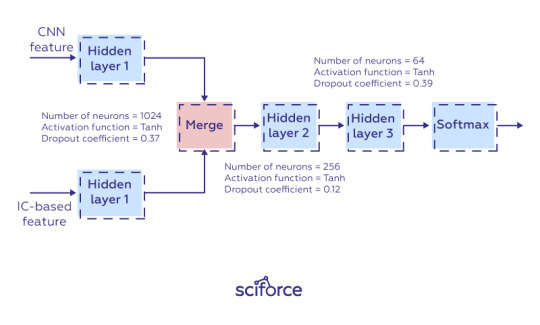
Another aspect of images that is believed to be correlated with memorability is the image aesthetics. Studies prove that people are more attracted to highly aesthetically attractive pictures and they choose more aesthetically appealing pictures for authentication purposes. However, aesthetics is a fairly ephemeral concept that has to do with the beauty and human appreciation of an object. Hence, though a number of computer vision papers have tried to rate, assess and predict image aesthetics, this aspect of an image is subjectively derived and aesthetic values of an image vary from subject to subject.
Hence, contrary to popular belief, unusual or aesthetically pleasing scenes are not necessarily highly memorable.
Conclusion
Evolution has created our brain to remember only the information relevant for our survival, reproduction, happiness, etc. That is why we share what we remember and what we forget that can be used in present-day technology to capture our attention. If machines can predict what we will remember, it can be used in various areas, including education and learning, content retrieval and search, content summarizing, storytelling, content filtering, advertising, which make us even more efficient in our everyday life.
0 notes
Text
Evolution of Forecasting from the Stone Age to Artificial Intelligence

Each nation has its ancient monument or a pagan holiday — the relic of the days when our ancestors tried to persuade their gods to give them more rain, no rain, better harvest, fewer wars and many other things considered essential for survival. However, neither Stonehenge nor jumping over fire could predict the gods’ reaction. It was a totally reactive world with no forecast. However, as time passed, people started to look into the future more inquisitively trying to understand what would be waiting for them. The science of prediction has emerged.
In this article, we’ll see how prediction evolved over time shaping our technologies, expectations and the worldview.
Naïve Forecasting
Naïve forecasting is an estimating technique in which the last period’s values are used as this period’s forecast, without adjusting them or attempting to establish causal factors. In other words, a naive forecast is just the most recently observed value. It is calculated by the formula
Ft+k=yt
where at the time t, the k-step-ahead naive forecast (Ft+k) equals the observed value at time t (yt).
In Ancient times, before such formulas, communities typically relied on observed patterns and recognized sequences of events for weather forecasting. The remnants of these techniques we can see in our everyday lives: we can foresee the next Monday routine based on the previous Monday, or expect spring to come in March (even though such expectations rely more on our imagination than the recorded seasonal changes).
In industry and commerce, it is used mainly for comparison with the forecasts generated by the better (sophisticated) techniques. However, sometimes this is the best that can be done for many time series including most stock price data. It also helps to baseline the forecast by tracking naïve forecast over time and estimating the forecast value added to the planning process. It reveals how difficult products are to forecast, whether it is worthwhile to spend time and effort on forecasting with more sophisticated methods and how much that method adds to the forecast.
Even if it is not the most accurate forecasting method, it provides a useful benchmark for other approaches.

Statistical Forecasting
Statistical forecasting is a method based on a systematic statistical examination of data representing past observed behavior of the system to be forecast, including observations of useful predictors outside the system. In simple terms, it uses statistics based on historical data to project what could happen out in the future.
As the late 19th and early 20th centuries were stricken by a series of crises that lead to severe panics — in 1873, 1893, 1907, and 1920 — and also substantial demographic change, as countries moved from being predominantly agricultural to being industrial and urban, people were struggling to find stability in the volatile world. Statistics-based forecasting invented at the beginning of the 20th century showed that economic activity was not random, but followed discernable patterns that could be predicted.
The two major statistical forecasting approaches are time series forecasting and model-based forecasting.
Time Series forecasting is a short-term purely statistical forecasting method that predicts short-term changes based on historical data. It is working on time (years, days, hours, and minutes) based data, to find hidden insights. The simplest technique of Time Series Forecasting is a simple moving average (SMA). It is calculated by adding up the last ’n’ period’s values and then dividing that number by ’n’. So the moving average value is then used as the forecast for next period.
Model-Based Forecasting is more strategic and long-term, and it accounts for changes in the business environment and events with little data. It requires management. Model-based forecasting techniques are similar to conventional predictive models which have independent and dependent variables, but the independent variable is now time. The simplest of such methods is the linear regression. Given a training set, we estimate the values of regression coefficients to forecast future values of the target variable.
With time the basic statistical methods of forecasting have seen significant improvements in approaches, forming the spectra of data-driven forecasting methods and modeling techniques.
Data-Driven Forecasting
Data-driven forecasting refers to a number of time-series forecasting methods where there is no difference between a predictor and a target. The most commonly employed data-driven time series forecasting methods are Exponential Smoothing and ARIMA Holt-Winters methods.
Exponential Smoothing
Exponential smoothing was first suggested in the statistical literature without citation to previous work by Robert Goodell Brown in 1956. Exponential smoothing is a way of “smoothing” out data by removing much of the “noise” from the data by giving a better forecast. It assigns exponentially decreasing weights as the observation gets older:
y^x=α⋅yx+(1−α)⋅y^x−1
where we’ve got a weighted moving average with two weights: α and 1−α.
This simplest form of exponential smoothing can be used for short-term forecast with a time series that can be described using an additive model with constant level and no seasonality.
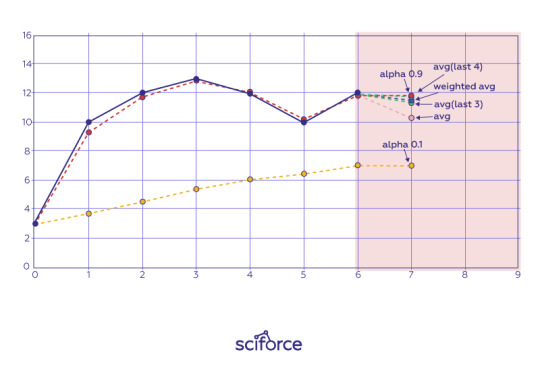
Holt-Winters Filtering
Charles C. Holt proposed a variation of exponential smoothing in 1957 for a time series that can be described using an additive model with increasing or decreasing trend and no seasonality. For a time series that can be described using an additive model with increasing or decreasing trend and seasonality, Holt-Winters exponential smoothing, or Triple Exponential Smoothing, would be more accurate. It is an improvement of Holt’s algorithms that Peter R. Winters offered in 1960.
The idea behind this algorithm is to apply exponential smoothing to the seasonal components in addition to level and trend. The smoothing is applied across seasons, e.g. the seasonal component of the 3rd point into the season would be exponentially smoothed with the one from the 3rd point of last season, 3rd point two seasons ago, etc.
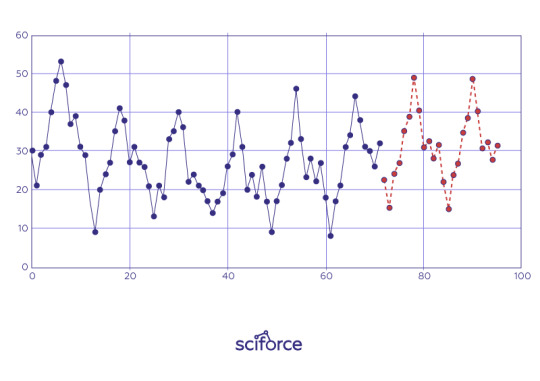
Here we can see evident seasonal trends that are supposed to continue in the proposed forecast.
Autoregressive Integrated Moving Average (ARIMA), or Box-Jenkins model
ARIMA is a statistical technique that uses time series data to predict future. It is are similar to exponential smoothing in that it is adaptive, can model trends and seasonal patterns, and can be automated. However, ARIMA models are based on autocorrelations (patterns in time) rather than a structural view of level, trend and seasonality. All in all, ARIMA models take trends, seasonality, cycles, errors and non-stationary aspects of a data set into account when making forecasts. ARIMA checks stationarity in the data, and whether the data shows a constant variance in its fluctuations over time.
The idea behind ARIMA is that the final residual should look like white noise; otherwise there is information available in the data to extract.
ARIMA models tend to perform better than exponential smoothing models for longer, more stable data sets and not as well for noisier, more volatile data.
While many of time-series models can be built in spreadsheets, the fact that they are based on historical data makes them easily automated. Therefore, software packages can produce large amounts of these models automatically across large data sets. In particular, data can vary widely, and the implementation of these models varies as well, so automated statistical software can assist in determining the best fit on a case by case basis.
Regression Models
A step forward compared to pure time series models, dynamic regression models allow incorporating causal factors such as prices, promotions and economic indicators into forecasts. The models combine standard OLS (“Ordinary Least Squares”) regression (as offered in Excel) with the ability to use dynamic terms to capture trend, seasonality and time-phased relationships between variables.
A dynamic regression model lends insight into relationships between variables and allows for “what if” scenarios. For example, if we study the relationship between sales and price, the model allows us to create forecasts under varying price scenarios, such as “What if we raise the price?” “What if we lower it?” Generating these alternative forecasts can help you to determine an effective pricing strategy.
A well-specified dynamic regression model captures the relationship between the dependent variable (the one you wish to forecast) and one or more (in cases of linear or multiple regressions, respectively) independent variables. To generate a forecast, you must supply forecasts for your independent variables. However, some independent variables are not under your control — think of weather, interest rates, price of materials, competitive offerings, etc. — you need to keep in mind that poor forecasts for the independent variables will lead to poor forecasts for the dependent variable.

Forecasting demand for electricity using data on the weather (e.g. when people are likely to run their heat or AC).
In contrast to time series forecasting, regression models require knowledge of the technique and experience in data science. Building a dynamic regression model is generally an iterative procedure, whereby you begin with an initial model and experiment with adding or removing independent variables and dynamic terms until you arrive upon an acceptable model. Everyone who ever had a look at data or computer science knows that linear regression is in fact the basic prediction model in machine learning, which brings us to the final destination of our journey — Artificial Intelligence.
Artificial Intelligence
Artificial intelligence and machine learning are considered the tools that can revolutionize forecasting. An AI that can take into account all possible factors that might influence the forecast gives business strategists and planners breakthrough capabilities to extract knowledge from massive datasets assembled from any number of internal and external sources. The application of machine learning algorithms in the so called predictive modeling unearths insights and identifies trends missed by traditional human-configured forecasts. Besides, AI can simultaneously test and learn, constantly refining hundreds of advanced models. The optimal model can then be applied at a highly granular SKU-location level to generate a forecast that improves accuracy.
Neural networks
Among multiple models and techniques for prediction in ML and AI inventory, we have chosen one that is closest to our notion of a truly independent artificial intelligence. Artificial neural network (ANN) is a machine learning approach that models the human brain and consists of a number of artificial neurons. Neural networks can derive meaning from complicated or imprecise data and are used to detect the patterns and trends in the data, which are not easily detectable either by humans or by machines.
We can make use of NNs in any type of industry, as they are very flexible and also don’t require any algorithms. They are regularly used to model parts of living organisms and to investigate the internal mechanisms of the brain.
The simplest neural network is a fully Connected Model which consists of a series of fully connected layers. In a fully connected layer each neuron is connected to every neuron in the previous layer, and each connection has its own weight. Such model resembles a simple regression model that takes one input and will spit out one output. It basically takes the price from the previous day and forecasts the price of the next day. Such models repeat the previous values with a slight shift. However, fully connected models are not able to predict the future from the single previous value.
With the latest emergence of Deep Learning techniques, neural networks have seen significant improvements in terms of accuracy and ability to tackle the most sophisticated and complex tasks. Recently introduced recurrent neural networks deal with sequence problems. They can retain a state from one iteration to the next by using their own output as input for the next step. In programming terms, this is like running a fixed program with certain inputs and some internal variables. Such models can learn to reproduce the yearly shape of the data and don’t have the lag associated with a simple fully connected feed-forward neural network.
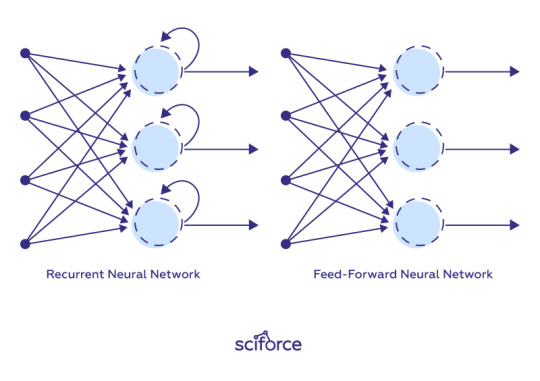
More than forecasting
With the development of Artificial Intelligence, forecasting as we knew it has transformed itself into a new phenomenon. Traditional forecasting is a technique that takes data and predicts the future value for the data looking at its unique trends. Artificial Intelligence and Big Data introduced predictive analysis that factors in a variety of inputs and predicts the future behavior — not just a number. In forecasting, there is no separate input or output variable but in the predictive analysis you can use several input variables to arrive at an output variable.
While forecasting is insightful and certainly helpful, predictive analytics can provide you with some pretty helpful people analytics insights. People analytics leaders have definitely caught on.
2 notes
·
View notes
Text
Work in Times of Corona

It has become clear that the beginning of the year is defined by the new pandemic. As any other massive shake-up, COVID-19 brings about the questions of survival: for individuals, businesses and the whole states. Similar to citizens of disease-stricken towns, businesses are trying to live through the epidemic, which, in many cases, means a trade-off between social responsibility and economic activity. The IT industry is, generally, the lucky one — most employees can be safely left to work from home without major impact on their productivity. However, even within the industry, Sciforce feels privileged: having medical professionals and data scientists on board, we are more than prepared to predict the threat and react to coronavirus responsibly.
Our Actions
Last Friday the government announced statewide quarantine. Why is this an appropriate measure?
As both data scientists and medical researchers throughout the globe agree, the virus is spreading exponentially, meaning that first it crawls into your region slowly and almost unnoticed and in a couple of weeks it is suddenly everywhere:
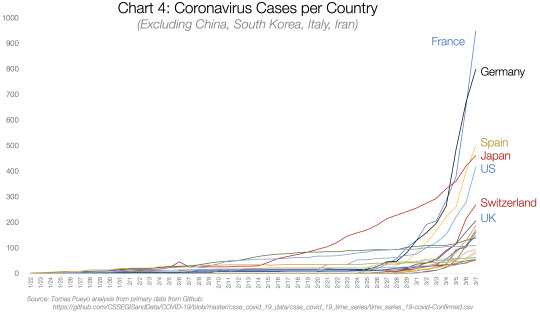
This graph modelled by Tomas Pueyo shows the grave similarity of the coronavirus spread in very different countries from different parts of the world. The most effective way to fight this, as shown by South Korea, is immediate and strict social distancing.
For Ukraine not to become yet another victim of the pandemic, measures are to be taken right away, and Sciforce has already modified the working routine accordingly.
What does this mean for the team?
Until the situation improves, we are working from home. Sciforce will take care to provide a smooth transition to the new way of operation, so that our team does not feel isolated. For those, who need assistance in setting up a remote workstation, our IT person is available — and willing — to help.
We ensure constant communication between team members, management and customers to minimize the effects of the quarantine on our performance.
Our medical team can help us all — they share only trustworthy information, can answer all our concerns and questions and are ready to give advice. We always rely on their professionalism in our everyday office life, be it selection of the painkillers to have in the office medical kit or selection of the best flu vaccine.
Besides from our physical help, it is crucial not to surrender to panic. Luckily for Sciforce, the head of our medical team is a trained psychologist and he can help us stay mentally stable even in the tough situation.

What does this mean for our clients?
Despite the volatile situation, all our commitments and deadlines remain intact. We are working from home, but our team is equipped to deliver all our products in time.
To make sure that there is no disconnection between the team and our clients, we make sure to provide all the necessary and timely communication. In addition to our usual talks and correspondence, we can send, if necessary, regular updates as to the situation in Ukraine. We believe that the key to effective work and trust is communication and we are willing to adapt it according to our clients’ wishes.
To provide extra security to our clients, we establish a VPN connection for our team members at a number of projects. Feel free to ask for a secure connection, if necessary.
What can we expect in the future?
As for now, Ukraine remains relatively free from coronavirus. The first confirmed case was registered on March, 3, and so far, there are only 3 confirmed cases as of March, 16 (one of which lethal) and 12 people are currently tested.
In the following diagrams we’ve tried to model the virus spreading with and without social distancing.
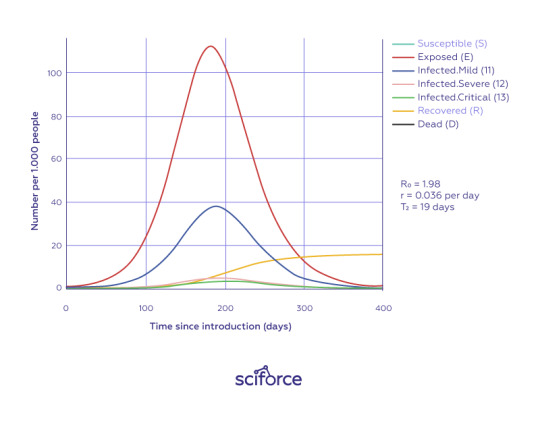
Where
Exposed — infected patients during the incubation period;
Infected Mild/Severe/Critical — infected patients with different severity of disease;
Recovered — recovered patients;
Dead — death toll;
The first diagram predicts the spreading of the disease without social distancing.
As you can see from the first diagram, the number of infected patients will reach its peak in about 6 months and will amount to over 100 people per 1000.
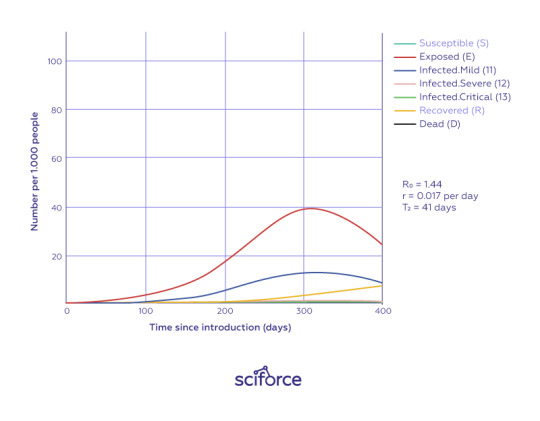
The second diagram shows the dynamics of the infection spreading with social distancing. It shows that the virus spreads slowlier and reaches 40 people per 1000 and twice as low death toll.
In any case, Sciforce remains committed to both our clients and employees and we will do whatever it takes us to ensure smooth — and safe — operation.

0 notes
Text
Big Data is not so big: Data Science for small- and medium-sized enterprises

New basis for any business
Current advances in technology are in many ways fueled by the growing flow of data coming from multiple sources and analyzed to create competitive advantage. Both individual users and businesses are switching to a digital system¹, which in turn generates pools of information. In their turn, organizations share data with other companies, giving rise to digital ecosystems that begin to blur traditional industry borders. As the amount of data available grows, the size, diversity, and applications of it are accelerating at a near-exponential rate, and businesses are discovering that traditional data management systems and strategies do not have the means to support the demands of the new data-driven world.
If several years ago data analytics was used mostly in finance, sales and marketing (such as customer targeting) and risk analysis, today analytics are everywhere²: HR, manufacturing, customer service, security, crime prevention and much more. As Ashish Thusoo, co-founder and CEO, Qubole, pointed out, “A new generation of cloud-native, self-service platforms have become essential to the success of data programs, especially as companies look to expand their operations with new AI, machine learning and analytics initiatives.”
While, according to a report by Qubole³, only 9% of businesses already support self-service analytics, 61 percent express plans for moving to a self-service analytics model. With different forms of data collected and connected to aid businesses in drawing analogies between datasets, coming up with actionable insights and improving decision-making, Big Data and Data Science have moved to the foreground of the industrial and commercial sector.
However, the volume of data may not be the decisive factor for optimizing business operations. Small- and medium-sized businesses need to understand the benefits that intelligent data analytics can bring and the opportunities for data collection and management.
Big Data and its relation to Data Science
Big Data is a term covering large collections of heterogeneous data whose size or type is beyond the ability of traditional databases to capture, manage, and process. Big Data encompasses all types of data, namely:
structured (such as RDBMS, OLTP, transaction data, etc.)
semi-structured (XML files, system logs, text files and such), and
unstructured information (emails, blogs, digital images, sensor data, web pages and many other types).
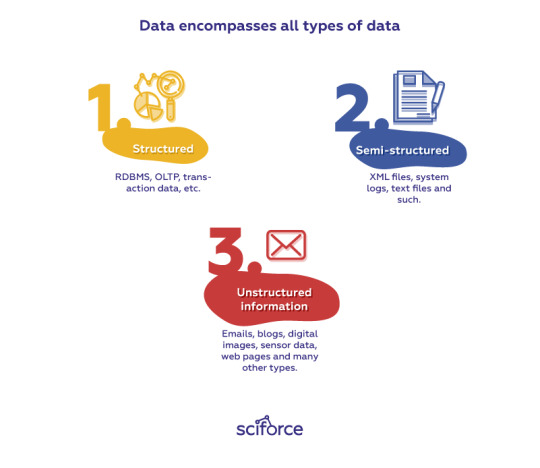
The sources of big amounts of data are multiple and varying depending on the industry or the business sector: data may come from sensors, devices, video/audio, networks, log files, transactional applications, web, and social media, with much of it generated in real time and on a very large scale.
The heterogeneity of data and inclusion of unstructured information in the data set require specialized data modeling techniques, tools, and systems to extract insights and information. Analyzing large amounts of data allows businesses to make decisions based on the data that was previously inaccessible or unusable with the help of advanced analytics techniques such as text analytics, machine learning, predictive analytics, data mining, statistics, and natural language processing. In this sense, the term Big Data refers to the whole range of the processes that information goes through, encompassing data gathering, data analysis, and data implementation.
Such scientific approach which applies mathematical and statistical ideas and computer tools for processing big data is called Data Science. It is a specialized field that combines intersecting areas such as statistics, mathematics, intelligent data capture techniques, data cleansing, mining and programming to prepare and align big data for intelligent analysis to extract insights and information.
Hence, the field of Data Science has evolved from Big Data, or Big Data and Data Science are inseparable.
The big Vs of big data:
The concept of Big Data as is known today was rolled running in the early 2000s when industry analyst Doug Laney articulated the now-mainstream definition of Big Data as the three Vs⁴:
Volume: with data coming from sensors, business transactions, social media and machines, there is a problem of the amount of data required for analytics is considered to be solved.
Velocity, or the pace and regularity at which data flows in. It is critical, that the flow of data is massive and continuous, and the data could be obtained in real time or with milliseconds to seconds delay.
Variety: for the data to be representative, it should come from various sources and in many types and formats.
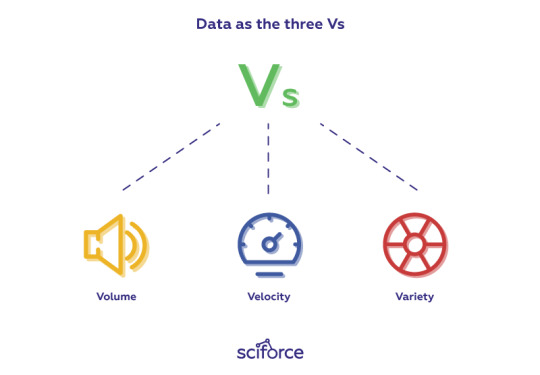
The initial concept has evolved to capture other factors that impact the effectiveness of manipulations with data, such as:
Variability: in addition to the increasing velocities and varieties of data, data flows can be highly inconsistent with periodic daily, seasonal or event-triggered peaks that need to be taken into account in analytics.
Veracity: in most general terms, data veracity is the degree of accuracy or truthfulness of a data set in terms of the source, the type, and processing techniques.
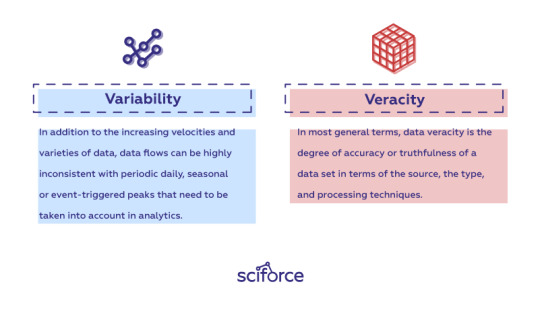
As technology evolves, more aspects of data come into the foreground giving rise to new big Vs.
Challenges posed by Big Data to businesses
Even though the amount of data collected is sufficient for analytics, it cannot guarantee that the analytical findings will be useful for the company. The problems that companies face in their quest for effective analytics can be triangulated into the problems related to the overabundance of versatile data, the lack of tools and the talent shortage.
On the data processing and machine learning side, analyzing extremely large data sets (40%), ensuring adequate staffing and resources (38%) and integrating new data into existing pipelines (38%) were called the primary obstacles to implementing projects.
Oversized pool of data
The research firm Gartner forecasts that in 2019 we will see 14.2 billion connected things in use⁵ resulting in a never-ending stream of information that can become a challenge for drawing meaningful insights.
Lack of adequate tools
To successfully compete in today’s marketplace, small businesses need the tools larger companies use. In its 2018 Big Data Trends and Challenges report⁶ Oubole, the data activation company, stated that 75 percent of respondents also reported that a sizeable gap exists between the potential value of the data available to them, and dedicated tools and talent dedicated to delivering it.
Changes in labor market
The spreading of new technologies will shift the core skills required to perform a job. The Future of Jobs Report⁷ estimates that by 2022, no less than 54% of employees will require re- and upskilling. According to Qubole, 83 percent of companies say it is difficult to find data professionals with the right skills and experience.
For business these challenges mean that they need to choose between retraining their existing personnel, hiring new talent with required skills and invest into developing their own tools for data collection and processing, purchasing third-party analytical products or finding subcontractors for doing Big Data Analytics.
Applications of Big Data
Big Data affects organizations across practically every industry and of any size ranging from governments and bank institutions to retailers.
Manufacturing
Armed with the power of Big Data, industries can turn to predictive manufacturing that can improve quality and output and minimize waste and downtime. Data Science and Big Data Analytics can track process and product defects, plan supply chains, forecast output, increase energy consumption as well as support mass-customization of manufacturing.
Retail
The retail industry largely depends on the customer relationship building. Retailers need their customers, the most effective way to handle transactions, and the most strategic way to bring back lapsed business — and Big Data provides the best solution for this. Originated from the financial sector, the use of large amounts of data for customer profiling, expenditures prediction and risk management become the essential Data Science tasks in the retail industry.
Marketing
The digital marketing spectrum is probably the biggest application of Data Science and machine learning. Ranging from the display banners on websites to the digital bill boards at the airports — almost all digital advertisement is decided by Data Science algorithms. Based on the user’s past behavior, digital advertisement ensures a higher CTR than traditional advertisement targeting the audience in a timely and more demand-based manner. Another facet of digital marketing is recommender systems, or suggestions about similar products used by businesses to promote their products and services in accordance with the user’s interest and relevance of information.

Logistics
Remaining a new application for Data Science, logistics benefits from its insights to improve the operational efficiency. Data science is used to determine the best routes to ship, the best suited time to deliver, the best mode of transport ensuring cost efficiency. Furthermore, the data that logistic companies generate using the GPS installed on their vehicles, in its turn creates new possibilities to explore using Data Science.
Media & Entertainment
The current consumers’ search patterns and the requirement of accessing content anywhere, any time, on any device lead to emerging new business models in media and entertainment. Big Data provides actionable points of information about millions of individuals predicting what the audience wants, scheduling optimization, increasing acquisition and retention as well as content monetization and new product development.
Education
In education, data-driven insight can impact school systems, students and curriculums by identifying at-risk students, implementing a better system for evaluation and supporting of teachers and principals.
Health Care
Big Data Analytics is known as a critical factor to improve healthcare by providing personalized medicine and prescriptive analytics. Researchers mine data to see what treatments are effective for particular conditions, identify patterns related to drug side effects, strategize diagnostics and plan for stocking serums and vaccines.
How it works
Step 1. Discover the data sources
The first step for processing data is discovering the sources that might be useful for your business. The sources for Big Data generally fall into one of three categories:
Streaming data — the data that reaches your IT systems from a web of connected devices, often part of the IoT.
Social media data — the data on social interactions that might be used for marketing, sales and support functions.
Publicly available sources — massive amounts of data are available through open data sources like the US government’s data.gov, the CIA World Factbook or the European Union Open Data Portal.
Step 2. Harness data
Harnessing information is the next step that requires choosing strategies for storing and managing the data.
Data storage and management: at present, there are low-cost options for storing data in clouds that can be used by small businesses.

Amount of data to analyze: while some organizations don’t exclude any data from their analyses, relying on grid computing or in-memory analytics, others try to determine upfront which data is relevant to spare machine resources.
Potential of insights: Generally, the more knowledge you have, the more confident you are in making business decisions. However, not to be overwhelmed, it is critical to select only the insights relevant to the specific business or market.
Step 3. Choose the technology
The final step in making Big Data work for your business is to research the technologies that help you make the most of Big Data Analytics. Nowadays there is a variety of ready-made solutions for small-businesses, such as SAS, ClearStory Data, or Kissmetrics, to name a few. Another option to tackle your specific needs is to develop — or subcontract — your own solution. In the choice it is useful to consider:
Cheap, abundant storage;
Fast processors;
Affordable open source, distributed big data platforms, such as Hadoop;
Parallel processing, clustering, MPP, virtualization, large grid environments, high connectivity, high throughputs and other techniques to optimize analytics;
Cloud computing and other flexible resource allocation solutions.
Conclusion
In the past, Big Data was used primarily by big businesses, since they were the only ones who could afford the technology and channels used to collect and analyze the information. However, today, even smaller-scale businesses can take advantage of Big Data and Data Science by choosing the relevant information they might use for their specific needs, and selecting tools or teams that can accessed remotely and on demand.
Critically, the importance of Big Data doesn’t revolve around the amount of collected data, but around the specific insights it may bring to a specific business or an industry. The combination of relevant Big Data with high-powered and targeted analytics can serve the following tasks:
Determining causes of failures and defects in near-real time;
Generating advertisements or promotion campaigns based on the customer’s buying habits;
Recalculating risk portfolios in minutes;
Prediction of stocks and sales;
Detecting and prevention of fraudulent behavior and much more.
References
https://www.forbes.com/sites/joshbersin/2016/12/11/how-everything-is-becoming-digital-and-why-businesses-must-adapt-now/
https://www.ibm.com/analytics/nl/nl/?cm_mmc=OSocial_Blog-_-IBM+Analytics_Data+Science-_-IBN_NL-_-NL+BLOG+ANALYTICS&cm_mmca1=000017WL&cm_mmca2=10003914&
https://insidebigdata.com/white-paper/report-depth-look-big-data-trends-challenges
https://blogs.gartner.com/doug-laney/files/2012/01/ad949-3D-Data-Management-Controlling-Data-Volume-Velocity-and-Variety.pdf
https://www.gartner.com/en/newsroom/press-releases/2018-11-07-gartner-identifies-top-10-strategic-iot-technologies-and-trends
https://insidebigdata.com/white-paper/report-depth-look-big-data-trends-challenges
http://www3.weforum.org/docs/WEF_Future_of_Jobs_2018.pdf
2 notes
·
View notes