#Aroon Indicator
Text
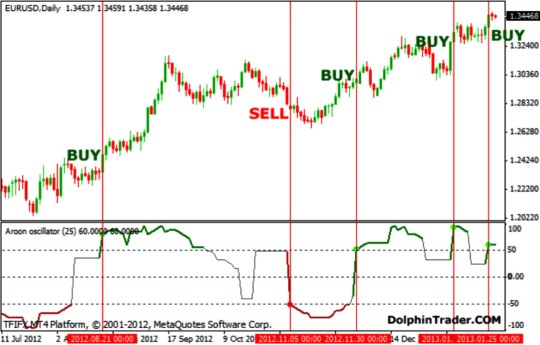
|AROON OSCILLATOR|TECHNICAL ANALYSIS INDICATOR|
The Aroon Oscillator is a technical indicator that is commonly used in stock market analysis. It is based on the Aroon indicator, which was developed by Tushar Chande in 1995, and provides insights into the strength and direction of a trend. The Aroon Oscillator is a derivative of the Aroon indicator, and its main purpose is to identify the trend’s momentum.
The Aroon Oscillator is calculated by…
View On WordPress
1 note
·
View note
Text
5 Projects Set to Unlock New Tokens and Their Price Predictions
Next week, several projects are scheduled to unlock a new set of tokens and release them into circulation. Some of the projects in this cohort include Sui (SUI), Manta Network (MANTA), dydx (DYDX), Optimism (OP), and SingularityNET (AGIX).
According to data from Token Unlocks, SUI would unlock $7.12 million worth of the token. MANTA plans to release $5.75 million, while DYDX’s token unlock would be worth $111.33 million. In addition, OP’s unlocks would be worth $86.01 million, and YFI’s unlock was valued at $9.34 million.
Most times, token unlocks are associated with price fluctuations and a change in volatility. Here, Coin Edition looks at the price predictions for the tokens when the event takes place.
SUI
At press time, SUI changed hands at $1.80, representing a 4.40% decrease in the last 24 hours. On the 4-hour chart, the Bollinger Bands (BB) indicated extreme volatility with the token. This implies that the price might fluctuate in either direction.
However, the RSI trended downwards, suggesting that the previous bullish momentum had become weak. In a highly bullish case, the price of SUI might extend toward $1.94. But if bears continue to dictate the momentum, the value might fall to $1.54.
SUI/USD 4-Hour Chart (Source: TradingView) MANTA
The Awesome Oscillator (AO) on the 4-hour chart revealed that bulls were trying to force the momentum upward. If this continues, the price of MANTA might head toward $3.45. However, at $3.45, the token might experience a pushback.
Should this be the case, MANTA might retrace to $2.98. But if bulls can defend the support at $2.74, the value might rally back to $3 as the Aroon indicator favored a bullish trend over a bearish one.
MANTA/USD 4-Hour Chart (Source: TradingView) DYDX
From the 4-hour chart, DYDX has been a victim of intense selling pressure since March 9. As a result of that, the value of the token has lost 8.56% of its value in the last seven days.
But bulls have been able to capitalize on seller exhaustion in an attempt to revive the price action. However, signals from the Supertrend showed that the uptrend might be short-lived. This was because of the sell signal at $3.55.
If the price of DYDX increased, it might hit $3.55. But when the tokens are unlocked, the value could be forced back to $3.10.
1 note
·
View note
Text
IQ Option Mobile Trick with Chaikin Volatility and Aroon Indicators
https://bit.ly/fxtools28
#iqoption #iqoptionmobile #iqoptionstrategy #iqoptiontrading #chaikinvolatility #aroon
0 notes
Text
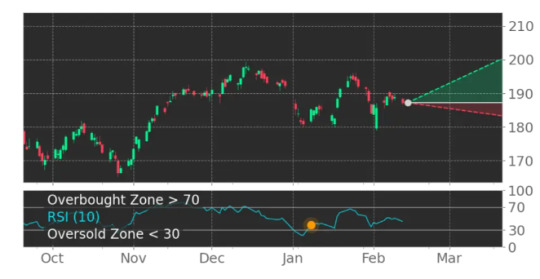
AAPL's RSI Oscillator climbs out of oversold territory
The RSI Indicator for AAPL moved out of oversold territory on January 08, 2024. This could be a sign that the stock is shifting from a downward trend to an upward trend. Traders may want to buy the stock or call options. The A.I.dvisor looked at 22 similar instances when the indicator left oversold territory. In 17 of the 22 cases the stock moved higher. This puts the odds of a move higher at 77%.
Technical Analysis (Indicators)
Bullish Trend Analysis
The Stochastic Oscillator suggests the stock price trend may be in a reversal from a downward trend to an upward trend. 29 of 42 cases where AAPL's Stochastic Oscillator exited the oversold zone resulted in an increase in price. Tickeron's analysis proposes that the odds of a continued upward trend are 69%.
Following a +0.92% 3-day Advance, the price is estimated to grow further. Considering data from situations where AAPL advanced for three days, in 259 of 342 cases, the price rose further within the following month. The odds of a continued upward trend are 76%.
Bearish Trend Analysis
The Momentum Indicator moved below the 0 level on February 01, 2024. You may want to consider selling the stock, shorting the stock, or exploring put options on AAPL as a result. In 29 of 69 cases where the Momentum Indicator fell below 0, the stock fell further within the subsequent month. The odds of a continued downward trend are 42%.
The Moving Average Convergence Divergence Histogram (MACD) for AAPL turned negative on January 31, 2024. This could be a sign that the stock is set to turn lower in the coming weeks. Traders may want to sell the stock or buy put options. Tickeron's A.I.dvisor looked at 42 similar instances when the indicator turned negative. In 20 of the 42 cases the stock turned lower in the days that followed. This puts the odds of success at 48%.
AAPL moved below its 50-day moving average on January 30, 2024 date and that indicates a change from an upward trend to a downward trend.
The 10-day moving average for AAPL crossed bearishly below the 50-day moving average on February 05, 2024. This indicates that the trend has shifted lower and could be considered a sell signal. In 9 of 14 past instances when the 10-day crossed below the 50-day, the stock continued to move higher over the following month. The odds of a continued downward trend are 64%.
Following a 3-day decline, the stock is projected to fall further. Considering past instances where AAPL declined for three days, the price rose further in 50 of 62 cases within the following month. The odds of a continued downward trend are 55%.
AAPL broke above its upper Bollinger Band on January 22, 2024. This could be a sign that the stock is set to drop as the stock moves back below the upper band and toward the middle band. You may want to consider selling the stock or exploring put options.
The Aroon Indicator for AAPL entered a downward trend on January 17, 2024. This could indicate a strong downward move is ahead for the stock. Traders may want to consider selling the stock or buying put options.
Fundamental Analysis (Ratings)
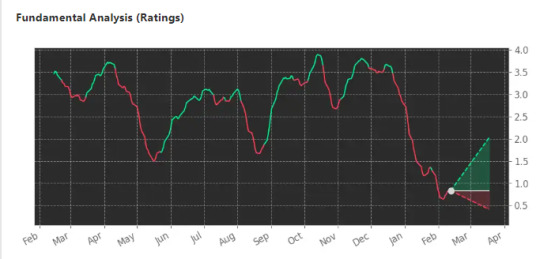
The Tickeron Profit vs. Risk Rating rating for this company is 6 (best 1 - 100 worst), indicating low risk on high returns. The average Profit vs. Risk Rating rating for the industry is 90, placing this stock better than average.
The Tickeron SMR rating for this company is 12 (best 1 - 100 worst), indicating very strong sales and a profitable business model. SMR (Sales, Margin, Return on Equity) rating is based on comparative analysis of weighted Sales, Income Margin and Return on Equity values compared against S&P 500 index constituents. The weighted SMR value is a proprietary formula developed by Tickeron and represents an overall profitability measure for a stock.
The Tickeron PE Growth Rating for this company is 27 (best 1 - 100 worst), pointing to outstanding earnings growth. The PE Growth rating is based on a comparative analysis of stock PE ratio increase over the last 12 months compared against S&P 500 index constituents.
The Tickeron Price Growth Rating for this company is 50 (best 1 - 100 worst), indicating steady price growth. AAPL’s price grows at a higher rate over the last 12 months as compared to S&P 500 index constituents.
The Tickeron Valuation Rating of 88 (best 1 - 100 worst) indicates that the company is significantly overvalued in the industry. This rating compares market capitalization estimated by our proprietary formula with the current market capitalization. This rating is based on the following metrics, as compared to industry averages: P/B Ratio (47.619) is normal, around the industry mean (78.744). P/E Ratio (31.056) is within average values for comparable stocks, (40.926). Projected Growth (PEG Ratio) (2.245) is also within normal values, averaging (1.997). AAPL has a moderately low Dividend Yield (0.005) as compared to the industry average of (0.024). P/S Ratio (7.855) is also within normal values, averaging (71.908).
AAPL is expected to report earnings to fall 30.28% to $1.52 per share on April 25
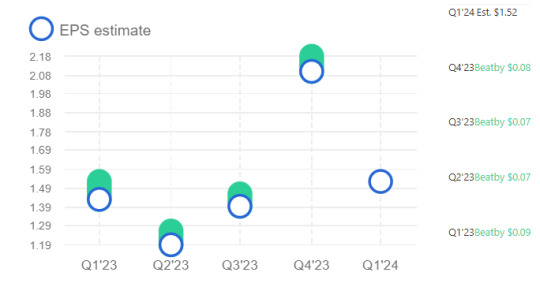
The last earnings report on February 01 showed earnings per share of $2.18, beating the estimate of $2.10. With 34.55M shares outstanding, the current market capitalization sits at 2.96T.
AAPL is expected to pay dividends on February 15, 2024
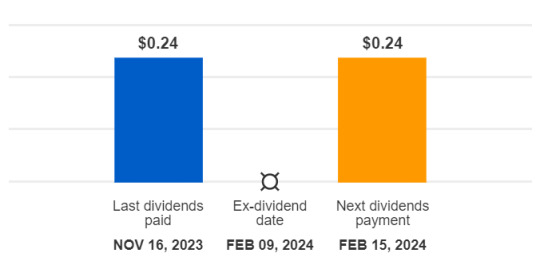
A dividend of $0.24 per share will be paid with a record date of February 15, 2024, and an ex-dividend date of February 09, 2024. The last dividend of $0.24 was paid on November 16. The ex-dividend date is usually set several business days before the record date. If a stock is purchased on its ex-dividend date or after, the next dividend payment will not be received. Instead, the dividends are repossessed by to the seller. If the stocks are purchased before the ex-dividend date, the buyer will receive the dividends.
Notable companies
The most notable companies in this group are Apple (NASDAQ:AAPL), GoPro (NASDAQ:GPRO).
Industry description
TVs, telephones, washing machines, home speakers and even home-office equipment like computers and printers…the list is virtually endless when it comes to consumer electronics and appliances. And, with ‘smarthomes’ increasingly becoming the reality, we could see a sharp surge in high-tech gadgets (including robotic appliances) making their way into our homes– and therefore spelling plenty opportunities in the related industries. Consumers account for 70% of US GDP, and their purchases of high-functioning electronics could make significant dents in the economy’s health. Sony Corp., Whirlpool and iRobot are some of the major consumer electronics/appliances makers.
Market Cap
The average market capitalization across the Electronics/Appliances Industry is 95.31B. The market cap for tickers in the group ranges from 129.13K to 2.96 T. AAPL holds the highest valuation in this group at 2.96 T. The lowest-valued company is IALS at 129.13K.
High and low price notable news
The average weekly price growth across all stocks in the Electronics/Appliances Industry was 0%. For the same Industry, the average monthly price growth was -4%, and the average quarterly price growth was -16%. ZEPP experienced the highest price growth at 17%, while PXDT experienced the biggest fall at -43%.
Volume
The average weekly volume growth across all stocks in the Electronics/Appliances Industry was -37%. For the same stocks of the Industry, the average monthly volume growth was 3% and the average quarterly volume growth was -16%
Fundamental Analysis Ratings
The average fundamental analysis ratings, where 1 is best and 100 is worst, are as follows
Valuation Rating: 62
P/E Growth Rating: 54
Price Growth Rating: 56
SMR Rating: 64
Profit Risk Rating: 89
Seasonality Score: -45 (-100 ... +100)
1 note
·
View note
Text
Polygon co-founder submitted a proposal to the ApeCoin DAO governance forum for the creation of its own zero-knowledge Layer-2 blockchain.
APE has seen a significant decline in demand since the month began.
In a new proposal dated 10 October, Polygon’s co-founder Sandeep Nailwal suggested that ApeCoin DAO develop its own zero-knowledge Layer-2 (zk-L2) blockchain using the Polygon Chain Development Kit (CDK).
Read ApeCoin’s [APE] Price Prediction 2023-2024
The proposal comes nearly 18 months after Yuga Labs, the creators of the Bored Ape Yacht Club NFT collection, tweeted that ApeCoin “will need to migrate to its own chain in order to properly scale” following its “Otherside” NFT minting event in April 2022, which resulted in the highest gas fees in the history of the Ethereum [ETH] network.
We're sorry for turning off the lights on Ethereum for a while. It seems abundantly clear that ApeCoin will need to migrate to its own chain in order to properly scale. We'd like to encourage the DAO to start thinking in this direction.
— Yuga Labs (@yugalabs) May 1, 2022
The ApeCoin DAO voted in a later proposal to keep ApeCoin within the Ethereum ecosystem. However, the question of an ApeCoin-specific chain remains open.
In his proposal, the co-founder argued in favor of Polygon’s CDK for the proposed zk-L2 network by highlighting its security, low fees, shared liquidity, customizability, and interoperability, making it suitable for achieving ApeCoin DAO’s goals.
According to Nailwal:
“ApeChain will provide the ApeCoin DAO with an efficient, secure, and decentralized execution environment upon which ApeCoin DAO projects can be built to help realize this mission.”
APE holders have it rough
At press time, the project’s native token APE traded at $1.04. In the last month, its price has declined by 10%, according to data from CoinMarketCap.
The month so far has been marked by a drop in demand for the metaverse-based token. On 2 October, the token attained a price peak of $1.29 and has since declined by 19%.
Source: CoinMarketCap
An assessment of the movements of key momentum indicators on a daily chart lent credence to the above position.
After the bears initiated a downtrend on 3 October, the token’s Relative Strength Index (RSI) and Money Flow Index (MFI), initially positioned above their respective center lines, began trending downwards.
As of this writing, the token’s MFI approached the oversold zones at 28.34, while its RSI was spotted at 35.37. This suggested that token sell-offs have significantly exceeded accumulation in the last two weeks.
Moreover, APE’s Parabolic Stop and Reverse (SAR) indicator – which identifies potential reversal points in an asset’s price direction- confirmed the market’s downtrend.
How much are 1,10,100 APEs worth today?
When the dots that make up the indicator are positioned above the price, it indicates a downtrend. Also, when these dots are closely packed together, it suggests that the trend is strong. All of these were true in APE’s case at the time of writing.
Lastly, its Aroon Down Line (blue) at 78.57% indicated that the downtrend was strong, and APE’s most recent price low was reached relatively recently.
Source: APE/USDT on TradingView
0 notes
Text
Stock Market
Introduction to Stock Market Algorithms
Difficulty Level : Basic
Last Updated : 30 Jan, 2020
ReadDiscuss
If you would know the practical use of Machine Learning Algorithms, then you could mint millions in the stock market through algorithmic trading. Sounds Interesting, Right?!. Yup! Whatever we got to have the zeal of coding, at the end of the day, we would end up barely seeking ways to monetize our coding skills! Isn’t it?.
If that sounds more of you, dive into this article till the end to amass umpteen knowledge on stock market algorithms and how they help in monetizing our programming skills. First, let’s have a lively discussion on the basics of the stock market, and it’s technical concepts.
What is the Stock Market?
Stock Market or Share Market or Financial Market is the place where the financial demands and supplies meet. It is the economic pool of investors, brokerage agency and the mighty corporates who offer public shares for trading. Trading is nothing but buying of shares and selling them when you find profit. Buying low and selling high is the core concept in building wealth in the stock market.
But there lies the numerous tricks and tactics to formulate this risky trading activity. In this epoch of digital transformation, Artificial Intelligence and Machine Learning Algorithms come in place to simplify the trading activity and make it less complex. Now we will look deep into the algorithmic trading activity.
How do Algorithms Help in Trading Activities?
Algorithmic trading is mostly deployed in high-frequency trading (HFT). The concept of trading is buying a potential share at a low price and selling it while it touches the peak growth in the market. This involves a lot of statistical verification and stock analyzation process to find out the potentiality of the stock.
It depends on variables like time, price, volume, and technical indicators to implement this trading activity. Over the process, the trading decision should also combat the human parallax error.
In the case of algorithmic trading, these activities are curatively programmed to attain the highest profit in each trading activity with no error.
As the algorithm could process in the timely cycle, it could do more number of trades in a given time that results in the accumulation of huge profits. This is referred to as high-frequency trading, which allows more liquidity in the market.
This algorithmic trading reduces the error and processes more trading activities to attain maximum gain in the market.
What are the Probabilities of Developing Your Algorithm to Trade in the Stock Market?
So how you would develop an algorithm that helps you in trading. To create an algorithm for trading, you should be knowing about the basic algorithmic trading strategies based the market behavior. You should be following the recent trends in the market and the arbitrage alternatives to succeed in understanding the nature and functions of the market.
You could create trading algorithms on any programming language but API integration for direct market access could be easily achieved when you code on MQL4. Then you should use should be installing MQL4 (Meta Quotes Language 4). MQL4 is the fast, intelligent and effective programming language for creating trading robots. It runs on Meta Trader 4 forex platform. It is a high-level object-oriented program that is more similar to C++ Programming. After configuring MT4 and establishing an account with a brokerage agency you could create your trading bot now. But these need ultimate understating of the trading concepts to design practical trading not.
Basic Technical Trading Signals @ Tools for Effective Trading
There are critical technical tools of the trade to gauge the market activity which helps us to determine and predict future market behavior.
Moving Average Convergence Divergence(MACD): These indicators signals after the trading conditions appear. Also called a lagging signal.
Aroon Indicator: This technical indicator measure the new highs and lows in the price movement of the market trend.
Average Directional Index(ADI): It determines the strength and momentum of the price moving trend. The ADX value is above 40 the directional strength is trending high. If it falls below 20 the strength is none trending.
Accumulation or Distribution Line(A/D): This measures the volume of a security over a range of trade. Accumulation and distribution over near range or halfway through or far range.
On Balance Volume(OBV): This measures the volume of security over time with positive and negative flows.
Relative Strength Index(RSI): These are leading signals that indicate before the trading conditions appear.
Directional Movement Indicator(DMI): This is a price indicator that compares the current share price with the previous range of prices. The positive value indicates the upward movement and the negative value describes the fall of prices.
Implementing and Analysing Trendlines Movement: Trendline depicts the upward and downward movements of prices in trade over some time.
With these crucial technical indicators, one could develop a trading algorithm that would implement the trading activity in real-time markets.
How Algorithmic Trading Helps You to Hunt Bounties on the Capital Markets?
With the logistics of trading develop a set of procedures to buy and sell stocks in the market. Then implore for API integration for direct market access with your stock broker to place your bidding. Though it may sound simple but it needs a lot of time and effort to create a trading bot that would mint millions in the form of high-frequency trading which humans cannot possibly achieve.
1 note
·
View note
Text
Bitcoin (BTC) may have to wait for a bull cycle
Bitcoin (BTC) may have to wait for a bull cycle
Bitcoin was hovering at US $23,448.87 as of 28 February at the time of writing (1:11 am GMT), according to CoinMarketCap.
The global crypto market cap stood at US$1.07 trillion, down by 0.46% over a day with a 24-hour volume of US $45.37 billion.
When Bitcoin touched US$25000 on 21 February for the first time since August, several crypto enthusiasts hoped the bull cycle would return to the king of crypto. Courtesy of a 9% rally, Bitcoin was able to trade as high as US $25,104, thereby helping it recover some of its losses and bring its YTD gains to 50%.
However, all hopes were quashed as it quickly retraced and returned to the US$23000 mark following the negative remarks from financial regulators. Currently, it is hovering at US $23,448.87 as of 28 February at the time of writing (1:11 am GMT), according to CoinMarketCap.
The global crypto market cap stood at US$1.07 trillion, down by 0.46% over a day with a 24-hour volume of US $45.37 billion.
Will Bitcoin bulls rise again?
Well! That's the question on everyone's mind. Cryptoverse-Explored But seeing how Bitcoin has reacted of late, it would be safe to assume that the leading crypto could witness a sideways action, like 2015-2016, to move towards sustainable growth rather than rushing like in 2019.
In fact, since trading above US$ 25000, the BTC has quickly slipped back and has now registered losses of 5% over a week. BTC's futures premium seems to have stuck in a sideways zone despite the US $25,000 rejection.
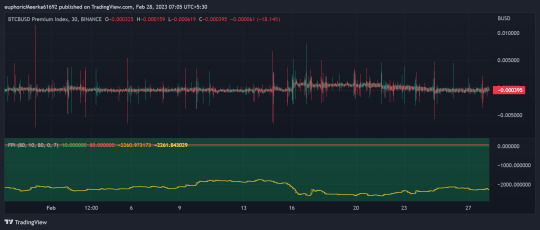
Futures are often seen as a preferred instrument of whales as their settlement date and the price difference from spot markets.
Image credit: Trading View
That said, the Futures Perpetual Index (FPI) indicates it is below 2000, indicating that sellers request more money to withhold settlement longer.
Not just the FPI, BTC's OI (Open Interest) seems to have dropped over the past week resulting in the stagnation of market participation and trading activity. Besides, it also hints at a decline in demand for BTC.
How is the BTC price faring?
The Numero Uno crypto on Tuesday was down by 0.53% with a live market cap of US $4,51,60,28,59,197.
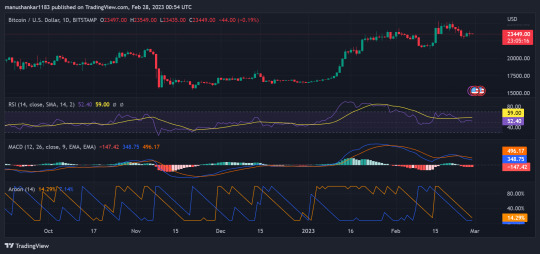
The RSI of Bitcoin stood at 52.4, indicating sellers have moved into a more stagnant phase compared to a week before.
The MACD, too, indicated a weakening of demand as the blue line (MACD line) dropped below the signal line (red line). The momentum seems to have slowed and shows that the bitcoin bulls might take some time to pull themselves back to the momentum.
Finally, the BTC's Aroon Up Line (orange) was about 14.29% at the writing. Usually, when an Aroon Up line is close to zero, it indicates a weak trend. A decline often follows this in the asset's prices.
The market participants may want to wait before making critical investment decisions even as the bears start circling around the bulls.
Risk Disclaimer: Please note that cryptocurrency investment involves significant risks and may result in substantial losses. The cryptocurrency market is highly volatile and unpredictable. The value of cryptocurrencies can fluctuate widely within short periods due to various factors such as market demand, government regulations, and investor sentiment. Therefore, conducting research and seeking professional advice before making investment decisions is important. Cryptoverse Explored cannot and does not represent or guarantee that any of the information/data available here is current, complete, or appropriate for your needs. Cryptoverse Explored will not accept liability for any loss or damage due to your trading or your reliance on the information shared on this website.
#bitcoin#BTC#cryptocurrency#cryptoverse explored#cryptoverse-explored#cryptocurrency trading#crypto#bitcoin latest news
0 notes
Text
How to Measure the Strength of a Crypto Trend with the Aroon indicator | And More
How to Measure the Strength of a Crypto Trend with the Aroon indicator | And More
Get up to date on the latest analysis and trading tips with our Crypto update week 41
How to Measure the Strength of a Crypto Trend with the Aroon indicator | And More in This Weeks Crypto Update.
Why Ethereum is Selling-Off After the Merge?Is Huobi Token Megaphone Pattern Bullish or Bearish?How to Measure the Strength of a Crypto Trend with the Aroon indicator
Ethereum (ETH) has lost over 26%…
View On WordPress
0 notes
Text
Aroon Indicator: A Powerful Tool for Identifying Trends
The world of trading is filled with a myriad of technical indicators designed to help traders analyze market trends, identify potential entry and exit points, and make informed decisions.
One such tool that has gained popularity among traders is the Aroon Indicator. Developed by Tushar Chande, the Aroon Indicator is a versatile tool that assists traders in determining the strength and direction…
View On WordPress
#aroon#indicators#learn technical analysis#stock markets#successful trading#technical analysis#tools and indicators
0 notes
Text
Does The Aroon Indicator Really Work?
Does The Aroon Indicator Really Work?
This is interesting. This video explains how most traders use the Aroon Indicator and result of a test of 100 trades.
Invest better, together with the world’s leading trading & investing community. Share strategies and invest together with over 20M users worldwide. Enjoy 0% commission on local and global stocks. Buy in bulk, or just a fraction.
Click here for a free eToro demo account.
View On WordPress
#Aroon Arrow Indicator#Aroon Chart Indicator#Aroon Indicator#Aroon Indicator Accuracy#Aroon Indicator Crossover#Aroon Indicator Day Trading#Aroon Indicator Example#Aroon Indicator Explained#Aroon Indicator For Intraday#Aroon Indicator Settings#Aroon Indicator Strategy#Aroon Indicator Technical Analysis
0 notes
Video
youtube
How to Trade Chande Momentum Oscillator
#investing#day trading#technical indicators#technical analysis#forex#forex trading#tradingview#work from home#finance#how to trade forex#bollinger bands#relative strength index#awesome oscillator#support and resistance lines#accumlation distribution#chaikin#commodities#options trading#aroon indicator
0 notes
Text
Ethereum’s Open Interest has rallied steadily since the beginning of September.
With prices down 5% this month, spot market traders stall on accumulation.
Ethereum [ETH] futures Open Interest has risen by 9% since the beginning of September despite the coin’s narrow price movements within that period.
Read Ethereum’s [ETH] Price Prediction 2023-24
According to data from Coinglass, the leading altcoin’s Open Interest at press time was $5.43 billion.
Source: Coinglass
Open Interest refers to the total number of outstanding contracts in a derivatives market. It is a measure of the overall activity in a market and can be used to gauge investor sentiment.
When ETH’s Open Interest increases, it means that the total number of ETH Futures contracts that have not been settled has increased. It is a bullish signal as it suggests that more investors are opening new positions in ETH and that there is increasing demand for the asset.
However, the month-long uptick in Open Interest has been accompanied by “neutral to negative” funding rates, crypto research firm Kaiko noted in a recent post on X (formerly Twitter).
#ETH open interest has increased since the start of September.
Funding rates remain neutral to negative, suggesting the market lacks direction. pic.twitter.com/EHESMQMncw
— Kaiko (@KaikoData) October 10, 2023
Positive funding rates indicate buyers are paying sellers to keep their contracts open, which suggests the market is bullish.
On the other hand, negative funding rates indicate that sellers are paying buyers to keep their contracts open, which suggests that the market is bearish.
When an asset sees neutral to negative funding rates in its futures market, it suggests that the market lacks a clear direction or bias. It connotes that there isn’t a strong bullish or bearish sentiment dominating the market, and traders remain unclear about the market’s next direction.
The downtrend is apparent in the coin’s spot market
At press time, an Ether coin sold for $1,560, according to data from CoinMarketCap. The month so far has been marked by a decline in the ETH’s value. After its brief stint above $1700 on 2 October, the alt’s price has since trended downward. In the last week, ETH’s price dipped by 5%.
The steady decline in the alt’s value has strengthened the downtrend in the coin’s spot market. As of this writing, ETH’s price observed on a daily chart traded dangerously close to the lower band of its Bollinger Bands indicator.
When an asset’s price trades this way, it suggests that selling pressure significantly outweighs buying momentum.
Although it signaled potential oversold conditions and an imminent short-term price bounce or retracement, ETH’s key momentum indicators, which were below their respective neutral lines at press time, did not indicate the possibility of that happening any time soon.
How much are 1,10,100 ETHs worth today?
Likewise, the coin’s Aroon Down Line (blue) was pegged at 100% at press time. This indicator is used to identify trend strength and potential trend reversal points in a crypto asset’s price movement.
When the Aroon Down line is close to 100, it indicates that the downtrend is strong and that the most recent low was reached relatively recently.
Source: ETH/USDT on TradingView
0 notes
Text
100.
with @idxjinhwan at kbs showtime in chile vip after party
in some ways aroon thinks he was made for this as much as he was made for performing. if his abilities as a performer were born with him and later honed by midas the social skills necessary for party environments were pushed into him since a young age. dad always had gather-togethers at home, bringing his friend for a game of poker or two, mixing thai, chinese and english as little aroon was made to watch how gentlemen should behave next to each other. mother always had her friends over, ladies gossiping over tea as aroon sat by the side, learning how to behave in the presence of women.
so this isn’t anything new to him. replace the large living rooms of his house with a hotel saloon and the millionaires his parents used to dine with other idols, local personalities and vip guests and it’s all the same. he has always been good with this, a people pleaser through and through. it’s easy when you’re pretty, it’s what his mother always told him. makes people pay more attention to you, trust you more, want to give you what you want. so aroon grows pretty and skilled, walks around the place as if he owns it, stops here and there to greet people, introduce himself to this and that producer. nothing is new here.
nothing but the tiredness he feels. he blames it on the jet lag he feels, the pressure of performing his song, the idea that as soon as they are back home they will have more schedules to attend since they are mid-promotions. the wine glass in his hands does little to help him relax; in fact, aroon feels as if he could drink way more and feel way less. mother and father didn’t prepare him for the problems of adulthood, of fighting for every aspect of your career while nursing a broken heart.
he leaves the conversation he’s in with the excuse of getting a refil, grabs another glass of wine from a waitress and walks until he finds an emptier space, open into the night. the weather is pleasant, or as pleasant as somewhere as different from seoul would be when he’s still on kst, and aroon closes his eyes, enjoys the breeze hitting his face. it’s not bad, he thinks to himself, his life is not that bad.
he opens his eyes, drinks his wine, vows to go back to the hotel and try to sleep soon, no first class seat is as comfortable as an actual bed, after all. someone stops behind him and when aroon turns he sighs. of all the people, why jinhwan? his presence is not unplesant, not at all, but he is sure the feeling isn’t mutual if the way jinhwan talked to him earlier in the day is any indication.
aroon is so, so tired, he doesn’t say anything, only waits for whatever other insults his ex can throw at his direction, but when they don’t come he drinks some more, sighs again. “do you want anything, jinhwan?” he asks, eyebrow raised. “are you looking for anyone?” because jinhwan sure didn’t come here for him, so it’s best to get this interaction over with as soon as possible.
6 notes
·
View notes
Text
BinBot Pro Review: Profitable Auto Trading or a Scam?

Reviews for automated trading systems like BinBot Pro are the most sought after.
This is because auto trading is the newest trend in the world of trading.
Many traders are confused about how auto trading work or are skeptical about it.
But we are here to the rescue!
In this review, we will go through the features of BinBot Pro to see how it works, how well it delivers on its promises and most importantly, you can know if it is a scam or not.
Binbot Pro Review
Automated trading systems like BinBot Pro allow auto trading with the help of trading algorithms.
The trader has to set some rules such as risk levels, entry and exit stipulations, and leverage and the rest will be done by the auto trader.
The traders can then relax and not worry about monitoring their positions.
This has made trading robots very popular and in demand.
As a result, the market is now flooded with tons of trading robots.
As a trader who’s looking for a reliable robot, it might become difficult to choose one.
Our Review on BinBot Pro will clear that doubt for you.
Let’s start.
BinBot Pro Review: What is BinBot Pro?
BinBot Pro Review - Binoption
High Capital Risk Is Involved In Financial Trading
BinBot Pro is a Binary Options Robot that offers automated trading to its users.
It was established in the year 2016 and has been offering an automated trading service since then.
There are multiple robots available for that trades on your behalf.
You can also customize them to match your requirements.
Each trading robot follows a different strategy and you can choose the one that you think will work the best for you.
BinBot Pro has partnered with BinaryCent which is an online broker.
You carry out transactions like deposits and withdrawals through this broker.
We will discuss more this broker later in the review.
Trading robots have been popping up left and right due to the increased demand for automated trading.
Unfortunately, not all trading robots have proven to be effective.
They enter and disappear from the market without anyone noticing.
This proves that you cannot expect to provide poor service and survive in the market.
BinBot Pro has been going strong ever since it was released in 2016.
It has gained popularity among traders quickly and has become one of the best-automated trading systems currently.
In 2016, they won the award for the best binary robot.
Why choose BinBot Pro?
BinBot Pro offers certain features that you cannot overlook.
Let’s see the reasons as to why you should choose BinBot Pro as your preferred choice of the trading robot.
Offers profitable auto-trading
Even new traders can make large profits
Easy registration process
Returns as high as 90%
Demo account offered
Award-winning automated trading
Robots have a profit rate up to 300%
Provides services to many countries around the globe
Major forex pairs as binary options
Popular Crypto assets
A minimum deposit fee of $250
Manual customization of trading robots
Fast and reliable platform
Dedicated customer support
BinBot Pro Live Trading Video, Results and Withdrawal
BinBot Pro Sign-up and Login
BinBot Pro Login Signup - Binoption
The account creation process is quick and hassle-free.
The process is described below:
Step 1
Click on the ‘Registration’ button below to start your registration process.
Step 2
Step 3
Step 4
To log in into your account, just use your provided email address and password.
CLICK FOR REGISTRATION
High Capital Risk Is Involved In Financial Trading
BinBot Pro Broker- BinaryCent
BinaryCent BinBot Pro Broker - Binoption
BinBot Pro currently only offers one broker to deal with: BinaryCent.
BinaryCent is an online trading platform which was founded in the year 2016.
It is managed by Cent Project Ltd., which is a subsidiary of Finance Group Corp.
The company is based in Vanuatu where their head office is located in Transpacific Haus, Lini Highway, Vanuatu.
BinaryCent is regulated by the Vanuatu Financial Services Commission (VFSC).
BinaryCent guaranteed withdrawals processing within 1 hour.
BinaryCent’s focus lies on small traders and hence their minimum deposit and investment are very low.
You need to deposit a minimum of $250 to start trading and the minimum trade investment is only $0.1.
This is one of the lowest we have seen and is beneficial for small and new traders.
You get leverage up to 1:100 on trading assets.
BinaryCent offers binary options along with forex and CFDs in their trading portfolio.
Recently they have added cryptocurrencies such as Bitcoin, Litecoin, Ethereum, Zcash, Monero, BCH, Dash, PrimeCoin, Reddcoin, and many others.
BinaryCent offers customer support through live web chat or through the telephone.
BinaryCent has its proprietary trading platform for trading.
The platform is web-based which means you don’t have to download separate software for trading.
The platform is user-friendly and trade execution happens without any delay.
They also offer mobile trading on the iOS and Android.
They have the same features and functionalities as the web-platform.
There are three different types of trading accounts on BinaryCent; Bronze, silver, and gold. Silver and gold accounts offer extra benefits and bonuses to traders.
Speaking of bonuses, traders get rewarded with bonuses for the deposit they make.
Depending on the type of account they choose to create, they get rewarded with 20%-100% bonus.
All these features make BinaryCent a great choice to be BinBot Pro’s broker.
VISIT BINARYCENT BROKER
High Capital Risk Is Involved In Financial Trading
BinBot Pro Top Robots - Created By Users
BinBot Pro Top Performing Robots - Binoption
BinBot Pro ranks robots on the basis of profits they generate for traders.
Here are some of the top performing robots for BinBot Pro:
RSIMA Cross Robot
This is the top robot with a profit of over 300%.
The strategy used in this robot involves matching the RSI with the moving average cross indicator.
The robot buys or sells when it matches with the RSI overbought or oversold signal.
The signal is maintained until an opposite signal is received.
The minimum deposit for this robot is $3000 and its algorithm level is at 5 points.
xProfit Robot
Ichimoku Crypto V2 Robot
Rising East v1.2 Robot
HP Cycles Robot
Strong ADX v.2 Robot
Strong US v2 Robot
Bolly Band Bounce Robot
RVI and MA Robot
Bladerunner Robot
CHOOSE YOUR TRADING ROBOT
High Capital Risk Is Involved In Financial Trading
BinBot Pro Settings and Trading Platform
BinBot Pro’s auto trading platform is available on the web.
You don’t need any separate software for trading which is convenient for many traders.
The whole auto-trading is revolved around following a trading robot which is available from the list of robots.
The platform displays the top 10 performing robots based on the profit level they generate.
Note that you can either copy the robot directly by letting it do all the trading for you or you can customize the robot to suit your needs.
You can also create a robot from scratch if you have the necessary trading experience.
Let’s take a look at the process of robot creation.
Robot Creation:
BinBot Pro Settings Robot Creation - Binoption
On the left side of the trading platform, there is a ‘create my robot’ button. Click on it to start the robot creation process.
STEP 1
Choose a name for your robot. You can give it any name you desire but by adding a relevant name, you can easily remember its strategy and even others can benefit from it.
STEP 2
STEP 3
STEP 4
STEP 5
BinBot Pro Indicators:
BinBot Pro Settings Trading Indicators - Binoption
There are 6 different types of indicators available in BinBot Pro:
ADM Index:
ADM stands for Average Directional Movement. It is an indicator that indicates the trend strength. It can determine when the price of an asset will trend strongly. This strength indication can be bi-directional, i.e. both upwards and downwards.
Commodity Chanel Index (CCI):
Momentum Indicator:
RSI Indicator:
RVI Indicator:
AROON:
BinBot Pro Demo Trading
BinBot Pro offers demo auto-trading before you invest.
You can demo run the top 10 trading robots and see which suits your needs the best.
The demo runs for a robot runs exactly for one minute.
The initial fund offered is $1000 and at the end of the one-minute demo, the final balance is displayed.
In our extensive testing, the demo tests always ended in profits and never seemed to face any loss which seemed suspecting to us.
When we traded on our real accounts, on an average, the robot won us 8/10 trades.
This is normal as no robot can guarantee a 100% win rate.
Their demo robot winning all trades may just be a marketing gimmick.
Also, the demo market conditions are obviously different than the real market conditions.
BinBot Pro Cryptocurrency Trading
BinBot Pro offers exclusive crypto trading to its traders.
Although binary trading is not allowed in the U.S, you can trade forex-crypto assets from any country in the world through BinBot Pro.
You can trade popular cryptos such as BTC, ETH, Litecoin, Dash, and much more.
BinBot Pro even offers deposits and withdrawals using Bitcoins and altcoins.
This makes the transactions fast and secure.
The BinBot Pro crypto software claims to have income returns of 700% or higher.
According to statistics, on a daily basis, their robots win 32390 trades, 1765 new clients join their website, they pay profits of $86003, and a customer earns $3836 in profits on an average.
Approximately, 25000 clients have had profitable trades with BinBot Pro.
The current offer of BinBot Pro offers 100% sign up bonus to their clients for Cryptocurrency trading.
START TRADING CRYPTOCURRENCY
High Capital Risk Is Involved In Financial Trading
BinBot Pro Mobile Trading
Currently, there is no mobile app for BinBot Pro.
However, BinaryCent offers mobile trading.
So you can perform transactions on the mobile app.
However, for trading, you have to use the web platform.
BinBot Pro Asset Index
BinBot mainly offers the major forex pairs along with few crypto-forex pairs.
Here is a list of the assets BinBot Pro offers in its portfolio:
Forex Pairs:
EUR/AUD
EUR/USD
GBP/USD
USD/CHF
EUR/JPY
USD/CAD
AUD/USD
EUR/GBP
Crypto-Forex Pairs:
BTC/USD
LTC/USD
ETH/USD
BCH/USD
BinBot Pro Minimum Deposit
The minimum deposit on BinaryCent is $250 but for some regions, it is $500.
BinBot Pro redirects you to BinaryCent during the withdrawal and deposit process.
BinaryCent offers multiple transaction methods such as Credit card (Visa, MasterCard), wire transfer, WebMoney, Skrill, Neteller, Crypto wallets to accept cryptocurrencies.
The deposit process is quick and is process instantly.
BinBot Pro Withdrawal
BinBot Pro offers multiple withdrawal methods such as Bitcoin, credit cards, Neteller, Skrill, and Perfect Money.
They charge a 5% transfer fee on credit card transactions.
BinBot Pro guarantees withdrawal processing within 1 hour.
The time it takes for you to receive this payment takes 2-7 business days.
Is BinBot Pro Scam or Legit?
BinBot Pro Scam - Binoption
BinBot Pro has been around 2016 and has a very good success rate of over 90%.
It has multiple trading robots and offers a regulated broker to trade with.
These reasons along with positive customer reviews make it a legit broker.
However, there has been a couple of complaints regarding this platform.
The thing with automated trading is, you are depending on algorithms and machines to do the trading for you.
This cannot ensure success every time, unlike popular beliefs.
Although not with complete certainty, we would like to say this platform is legal and you can use it for profitable trading.
BinBot Pro Cons
Though it has many unique features for traders but it has also some drawbacks and they are –
Demo account lasts only one minute
Demo trading results seemed suspecting to us
Offers only one broker for trading
Minimum deposits for top robots are high
Conclusion
BinBot Pro stands out from the rest of the auto trading by providing multiple robots that have a high success rate, multiple indicators offering vast technical analysis, and a convenient robot creation process both novice and experienced traders benefit from the profitable auto trading BinBot Pro offers.
However, there are a few things they could work on to improve further.
Their website feels lackluster to use.
They need to partner with more brokers to cater to more traders.
In conclusion, BinBot Pro is an excellent auto-trading robot that delivers what it claims to do
1 note
·
View note
Text
Download Now
[arm_download item_id="348" link_type="button"]
https://ezyforextrading.com/aroon-horn-mt4-indicator/?feed_id=1508&_unique_id=624dd5f2981b7&Best%20forex%20mt4%2Cmt5%20indicators%20and%20trading%20systems%21%20-%20EzyForexTrading
0 notes
Text
√8XoG4aV> FREE DOWNLOAD Aroon Indicator SG SOFTWARE Created by Stuart Goodwin [.ZIP .RAR] MT4 MT5
<kTrhFak> DOWNLOAD THIS Aroon Indicator SG by Stuart Goodwin v1.0 [.ZIP .RAR] MT4 MT5 PROGRAM
Download This Software Now It is Free Aroon Indicator SG
⬇⬇⬇Download Full Software by Clicking Link Below⬇⬇⬇
https://cybermedialibrary.blogspot.com/access59.php?id=27646
Size: 32,170 KB
DOWNLOAD BY CLICKING THIS LINK >> https://cybermedialibrary.blogspot.com/access85.php?id=27646 - DOWNLOAD Program Aroon Indicator SG by Stuart Goodwin FULL FREE
Accessed by: 97255 user
Last server checked: 14 Minutes ago!
Aroon Indicator SG by Stuart Goodwin Current Version: 1.0
Aroon Indicator SG by Stuart Goodwin Current Update:
Aroon Indicator SG by Stuart Goodwin Published on: 1 February 2018
Aroon Indicator SG by Stuart Goodwin Rating: 50
Aroon Indicator SG by Stuart Goodwin Price: 30
Aroon Indicator SG by Stuart Goodwin [Download .Zip, and .Rar Program Here]
Aroon Indicator SG by Stuart Goodwin Software Download
Aroon Indicator SG by Stuart Goodwin Free Download
Stuart Goodwin by Aroon Indicator SG Program
Here, Download Aroon Indicator SG by Stuart Goodwin Program
Let's Download Aroon Indicator SG by Stuart Goodwin Program. It's Free!
Aroon Indicator SG by Stuart Goodwin Program Download
Aroon Indicator SG Software
Go Download This Aroon Indicator SG by Stuart Goodwin Application
You can Download Aroon Indicator SG by Stuart Goodwin Here
FREE Aroon Indicator SG by Stuart Goodwin DOWNLOAD
INSTALL ONLINE Aroon Indicator SG by Stuart Goodwin PROGRAM
DOWNLOAD Aroon Indicator SG by Stuart Goodwin .zip
Aroon Indicator SG by Stuart Goodwin .rar Format
Hurry Up! Install Online Stuart Goodwin by Aroon Indicator SG Program
Aroon Indicator SG by Stuart Goodwin Program is Here!
Aroon Indicator SG by Stuart Goodwin Software Download
DOWNLOAD THIS Aroon Indicator SG .RAR SOFTWARE
DOWNLOAD Aroon Indicator SG AND ACCESS THIS PROGRAM NOW
DOWNLOAD APPLICATION Aroon Indicator SG in .RAR FORMAT
[APPS] [Application] Aroon Indicator SG by Stuart Goodwin AVAILABLE NOW, GO DOWNLOAD IT!
ACCESS THIS Aroon Indicator SG by Stuart Goodwin APPLICATION
REVIEW THIS Aroon Indicator SG by Stuart Goodwin PROGRAM
GO DOWNLOAD AND ACCESS THIS Aroon Indicator SG Stuart Goodwin SOFTWARE
Aroon Indicator SG Stuart Goodwin SOFTWARE IS AVAILABLE IN .RAR, AND .ZIP FORMAT
If you want This Stuart Goodwin Aroon Indicator SG Program, Download it. It's Free!
Aroon Indicator SG Stuart Goodwin FREE NOW
Do You Want Aroon Indicator SG Stuart Goodwin Program? Click Link Above to Download
Install Free Aroon Indicator SG Stuart Goodwin Application by Clicking Link Above
DOWNLOAD Aroon Indicator SG Stuart Goodwin FREE ONLINE
Aroon Indicator SG SOFTWARE BY Stuart Goodwin
If you Want Aroon Indicator SG Created by Stuart Goodwin, You Can Download This Program by Clicking Link Above!
Download Aroon Indicator SG from Stuart Goodwin Free Online
Install This Stuart Goodwin by Aroon Indicator SG Program
Want this Aroon Indicator SG Stuart Goodwin Software? Go Download It.
Aroon Indicator SG Stuart Goodwin .ZIP Formatted Program
Install Aroon Indicator SG .Zip, or .Rar Program
Aroon Indicator SG download Software APPS Application, Software in english language
[download] Software Aroon Indicator SG in format APPS
Download This Aroon Indicator SG Program
Stuart Goodwin Created This Aroon Indicator SG Application, If You Want This Application, You can Download by Clicking Link Above.
Aroon Indicator SG Stuart Goodwin APPS
Aroon Indicator SG Stuart Goodwin Application
Aroon Indicator SG Stuart Goodwin EXE
Aroon Indicator SG Stuart Goodwin ZIP
Aroon Indicator SG Stuart Goodwin RAR
Aroon Indicator SG Stuart Goodwin Software
Aroon Indicator SG Stuart Goodwin iSoftwares
Aroon Indicator SG Stuart Goodwin with .Zip .Rar format
Aroon Indicator SG Stuart Goodwin Rar
Aroon Indicator SG Stuart Goodwin Zip
Aroon Indicator SG Stuart Goodwin Programpocket
Aroon Indicator SG Stuart Goodwin Program Online
Aroon Indicator SG Stuart Goodwin AudioSoftware Online
Aroon Indicator SG Stuart Goodwin Review Online
Aroon Indicator SG Stuart Goodwin Install Online
Aroon Indicator SG Stuart Goodwin Download Online
D0WNL0AD APPS Software TextSoftware Aroon Indicator SG by Stuart Goodwin
D0wnl0ad URL => https://cybermedialibrary.blogspot.com/access49.php?id=27646
0 notes
Last Seen Blogs

ptsldn
P A T S A L D A N A

middyrose
Cats are life

sissyslavearianne
Sissy_Arianne (18+)

mattiaspersson1
Untitled

urfavbooblover
imagines abt ur favs