#4.26 predictions
Text
"At the beginning of Book 4, then, the scene returns to Olympus, from where the gods gaze out over Troy, for a second divine council. Zeus immediately raises the subject of the abortive duel (4.14–19): ‘Let us consider how the work will proceed, whether we are again to stir evil war and dread strife, or cast mutual regard between the two sides. And if this should be amenable and pleasing to all, then would the city of lord Priam remain inhabited, and Menelaus would bring back Argive Helen.’
The Iliad makes clear in advance how Zeus’ words here are to be understood: before Zeus opens his mouth, we are told that they will be ‘mocking’ (κερτοµίοις), spoken ‘with a hidden meaning’ (παραβλήδην), and designed ‘to provoke a response’ (ἐρεθιζέµεν, 4.5–6). Having already established his willingness to deceive mortals when he sent the destructive dream to Agamemnon, Zeus is now shown to be equally deceptive when dealing with his fellow gods. Zeus’ suggestion that they consider allowing the war to end is, predictably, not pleasing to Hera, who responds angrily (4.26–9): ‘How are you willing to make vain and incomplete the sweat I sweated with effort, and the weariness of my horses as I bring together the host, and evils for Priam and his children? Do it; but all the rest of us gods will not agree with you.’
While Zeus’ provocative question appealed to a sense of divine inclusivity in his invitation to ‘let us consider’ (14), Hera attempts to recast Zeus as the outsider on Olympus by identifying herself with ‘the rest of the gods.’ Zeus, however, is quick to reassert that it is Hera who is the outsider (4.31–46): ‘What have Priam and his children done that is so wicked that you rage unceasingly to destroy the well-founded city of Ilium? If you should come to the gates and great walls and devour raw Priam and his children and the other Trojans, then you might be relieved of your anger. Do what you wish; let there be no conflict afterwards and cause of strife for you and me. But let me tell you another thing, and you keep this in mind: whenever I myself am eager to destroy a city, where the men are dear to you, do not restrain my anger, but let me do it. And in fact I myself have given in to you, though my heart was unwilling: for under the sun and starry heaven, of the cities that men on the ground inhabit, in my heart the most honored is sacred Ilium.’
Zeus characterizes Hera’s dislike of Troy as vicious and extreme, but claims to yield in order to prevent strife between them afterward. So the war will go on. But of course it had to, and Zeus’ claim to consider some other course of action is entirely disingenuous. This is the ‘hidden meaning’ of Zeus’ words: a resumption of hostilities between the Greeks and Trojans is necessary, if for no other reason, so that Zeus may fulfill his promise to Thetis. Hera, however, who has been denied access to Zeus’ plan, is prompted to act as if the end of the Trojan War at this point were a real possibility.
Thus, through this exchange, Zeus advances his plan in a number of ways. First, he brings about the necessary resumption of the war. Second, he induces Hera to assume responsibility for doing so, while casting himself as a compassionate, or at least dispassionate, divinity, in contrast with her supposed desire to ‘devour the Trojans raw,’ and her expressed willingness to see even the cities most devoted to her destroyed. Thirdly, he extracts from Hera concessions that she need not have granted, by making her future acquiescence a prerequisite for the war’s continuation. In sum, by speaking provocatively and deceptively, ‘with mocking words and a hidden meaning,’ and knowing that Hera will respond as she does, Zeus engineers a quarrel with her in which he gains an advantage at no cost to himself. The advantage is that Hera’s narrow aim, to punish the Trojans, is made consistent with Zeus’ larger plan, to which she is pledged to adapt in the future. Moreover, Zeus fortifies his position as leader of the gods by showing a willingness to negotiate with a subordinate, even if the negotiations actually are conducted in bad faith. Zeus’ strategies here are, then, complex and covert, but clearly signposted and entirely rational."
- Herding Cats: Zeus, the Other Gods, and the Plot of the Iliad by Jim Marks, in The Gods of Greek Hexameter Poetry From the Archaic Age to Late Antiquity and Beyond
#the iliad#zeus#hera#quotes#excerpts#it's baffling that some readers of the Iliad seriously believe that Zeus really intended to put a stop to the war in that scene
3 notes
·
View notes
Text
Energy Measurement IC Market Analysis, Research & Forecast till 2033

Energy Measurement IC Market was valued in USD 4.26 billion in 2021 to USD 9.42 billion in 2033. Estimated to grow CAGR 7.4% during 2022-2033
The competitive analysis of the Energy Measurement IC Market include a comprehensive analysis of market trends, competitor landscape, consumer behavior, and potential opportunities. It should cover key demographics, market size, growth projections, and risk factors. The report should also highlight the methodology used for data collection and analysis, presenting findings with visual aids such as charts and graphs. Additionally, recommendations and strategic insights for stakeholders to make informed decisions are crucial. The report should be concise, well-organized, and provide actionable information for businesses aiming to navigate the market effectively.
Key Function:
A Energy Measurement IC market research report serves to assess market dynamics, identify opportunities, and mitigate risks for businesses. It analyzes consumer preferences, competitor strategies, and economic trends. The report facilitates informed decision-making by presenting data on market size, growth potential, and emerging patterns. It aids in product development, pricing strategies, and market positioning. Additionally, market research reports help businesses understand their target audience, enhance marketing efforts, and optimize resource allocation. By offering actionable insights, these reports empower organizations to stay competitive, adapt to changing market conditions, and foster sustainable growth in a dynamic business environment.
Key Dynamics:
Market research reports capture vital dynamics, including market trends, competitive analysis, and consumer behavior. They reveal market size, growth projections, and regional nuances. SWOT analysis examines internal strengths and weaknesses, along with external opportunities and threats. Consumer insights delve into preferences, impacting product development and marketing strategies. The competitive landscape unveils key players, strategies, and market shares. Regulatory factors and industry challenges are explored, aiding risk assessment. Timely and accurate information empowers businesses to adapt strategies, capitalize on opportunities, and navigate challenges, ensuring informed decision-making and sustained competitiveness in dynamic markets.
Receive the FREE Sample Report of Energy Measurement IC Market Research Insights @ https://stringentdatalytics.com/sample-request/energy-measurement-ic-market/8350/
Market Segmentations:
Global Energy Measurement IC Market: By Company
• NXP Semiconductors
• Analog Devises
• Cirrus Logic
• Atmel Corporation
• STMicroelectronics
• Maxim Integrated
• Microchip Technology
• Integrated Device Technology
• Linear Technology
• ON Semiconductor
• Texas Instruments
Global Energy Measurement IC Market: By Type
• Single-Channel
• Multi-Channel
Global Energy Measurement IC Market: By Application
• Smart Home
• Smart City
• Industrial
Regional Analysis of Global Energy Measurement IC Market
All the regional segmentation has been studied based on recent and future trends, and the market is forecasted throughout the prediction period. The countries covered in the regional analysis of the Global Energy Measurement IC market report are U.S., Canada, and Mexico in North America, Germany, France, U.K., Russia, Italy, Spain, Turkey, Netherlands, Switzerland, Belgium, and Rest of Europe in Europe, Singapore, Malaysia, Australia, Thailand, Indonesia, Philippines, China, Japan, India, South Korea, Rest of Asia-Pacific (APAC) in the Asia-Pacific (APAC), Saudi Arabia, U.A.E, South Africa, Egypt, Israel, Rest of Middle East and Africa (MEA) as a part of Middle East and Africa (MEA), and Argentina, Brazil, and Rest of South America as part of South America.
Click to Purchase Energy Measurement IC Market Research Report @ https://stringentdatalytics.com/purchase/energy-measurement-ic-market/8350/
Reseason To Purchase:
Purchasing a market research report is essential for businesses seeking a competitive edge. It provides in-depth insights into market trends, consumer behavior, and competitor strategies. This knowledge empowers informed decision-making, mitigates risks, and identifies growth opportunities. Market reports streamline strategic planning, enhance product development, and optimize resource allocation. For businesses entering new markets, these reports offer critical data for successful market entry. Additionally, the comprehensive analysis instills investor confidence, ensures regulatory compliance, and saves time compared to independent research efforts. Ultimately, investing in market research reports is a strategic move that enhances efficiency, minimizes uncertainties, and fosters sustainable business growth.
About Stringent Datalytics
Stringent Datalytics offers both custom and syndicated market research reports. Custom market research reports are tailored to a specific client's needs and requirements. These reports provide unique insights into a particular industry or market segment and can help businesses make informed decisions about their strategies and operations.
Syndicated market research reports, on the other hand, are pre-existing reports that are available for purchase by multiple clients. These reports are often produced on a regular basis, such as annually or quarterly, and cover a broad range of industries and market segments. Syndicated reports provide clients with insights into industry trends, market sizes, and competitive landscapes. By offering both custom and syndicated reports, Stringent Datalytics can provide clients with a range of market research solutions that can be customized to their specific needs.
Reach US
Stringent Datalytics
+1 346 666 6655
Social Channels:
Linkedin | Facebook | Twitter | YouTube
0 notes
Text
Cam Locks Market | A Digital Revolution in Security Systems

A standard cam lock operates with a key that rotates the cam to lock or unlock the mechanism. Widely used, from personal lockers and office furniture to filing cabinets and vending machines, their efficient security drives its market growth. As per industry sources, most of the export shipments of cam locks were made to countries like Peru, the United States, and India. In this regard, Triton’s research predicts that the Global Cam Locks Market is expected to rise at a 4.26% CAGR over 2024-2032.
Cam locks can be tailored to specific customer needs, including adjustable cam lengths, various locking mechanisms, and compatibility with different key types. As the market grows, the potential for improved cam locks seems limitless, promising a digital future where security is smarter and more reliable.
Explore in detail about this market in our FREE sample-
Cam Locks Market: Leading Product Developments
Recent years have seen remarkable advancements in cam lock technology, driven by the demand for secure storage solutions and smarter locking systems. Manufacturers are integrating smart technologies into traditional locks; the digital cam locks market is bound to grow.
Smart Cam Locks:
This type offers keyless operations through numeric keypads, RFID cards, or Bluetooth connections. These smart cam locks provide enhanced security features such as audit trails, which track who accessed the lock and when.
For instance, in July 2023, ASSA ABLOY announced their SMARTair cam locks that offer both RFID and mobile access. The advantages of electronic access control highlight the shift towards more flexible and secure locking solutions.
Smart cam locks can remotely manage access permissions, significantly reducing the risk of unauthorized access. Furthermore, the adoption of smart technologies and the Internet of Things (IoT) in security systems has opened new avenues for innovation in the digital cam lock market.
Biometric Cam Locks:
Biometric technology has also made its way into the design, with cam lock manufacturers introducing locks that require fingerprint verification or facial recognition to unlock. Companies like Master Lock, Southco, and Blusafe are pivotal in introducing biometric cam locks to the market.
With a storage capacity of up to 100 fingerprints, these locks offer a higher security level. Thus, providing a long-term security solution, these features make them ideal in sensitive areas such as data centers and personal lockers.
Cam Locks for Environmental Durability
Another area of innovation is the development of cam locks designed for extreme conditions. These locks are made from materials resistant to corrosion, dust, and water, making them suitable for outdoor use, where traditional locks would quickly fail.
Biodegradable plastics and recycled metal alloys are some environment-friendly manufacturing materials used to reduce carbon emissions. Moreover, the trend towards sustainability has led manufacturers to offer customized cam locks in harsh environments such as marine applications.
Future Potential of Cam Locks
The future of cam locks lies in further integration with smart home and building management systems, allowing for seamless security solutions. In order to enable remote monitoring, artificial intelligence (AI) and machine learning (ML) technologies can be utilized to make smarter and reliable cam locks. With predictive security features that can detect and prevent unauthorized access attempts before they happen, the cam locks market is set to alter the landscape security technology.
Grab a Quick Read to Understand the Key Insights of the Cam Locks Market-
FAQs
Q.1) What are the common applications for cam locks in various industries?
Answer: Cam locks are widely used in numerous industries, such as furniture manufacturing, automotive, electronic enclosures, healthcare, and security. They cater to the demand for secure storage solutions for cabinets, drawers, mailboxes, vending machines, lockers, and more.
Q.2) What are the advantages of cam lock?
Answer: The key advantage of cam lock fittings lies in their capacity to offer swift and effortless connections. Engineered with a straightforward yet efficient mechanism, these locks enable prompt connection and disconnection without any specialized tools.
0 notes
Text
Cam Locks Market | A Digital Revolution in Security Systems
A standard cam lock operates with a key that rotates the cam to lock or unlock the mechanism. Widely used, from personal lockers and office furniture to filing cabinets and vending machines, their efficient security drives its market growth. As per industry sources, most of the export shipments of cam locks were made to countries like Peru, the United States, and India. In this regard, Triton’s research predicts that the Global Cam Locks Market is expected to rise at a 4.26% CAGR over 2024-2032.

Cam locks can be tailored to specific customer needs, including adjustable cam lengths, various locking mechanisms, and compatibility with different key types. As the market grows, the potential for improved cam locks seems limitless, promising a digital future where security is smarter and more reliable.
Explore in detail about this market in our FREE sample: https://www.tritonmarketresearch.com/reports/cam-locks-market#request-free-sample
Cam Locks Market: Leading Product Developments
Recent years have seen remarkable advancements in cam lock technology, driven by the demand for secure storage solutions and smarter locking systems. Manufacturers are integrating smart technologies into traditional locks; the digital cam locks market is bound to grow.
Smart Cam Locks:
This type offers keyless operations through numeric keypads, RFID cards, or Bluetooth connections. These smart cam locks provide enhanced security features such as audit trails, which track who accessed the lock and when.
For instance, in July 2023, ASSA ABLOY announced their SMARTair cam locks that offer both RFID and mobile access. The advantages of electronic access control highlight the shift towards more flexible and secure locking solutions.
Smart cam locks can remotely manage access permissions, significantly reducing the risk of unauthorized access. Furthermore, the adoption of smart technologies and the Internet of Things (IoT) in security systems has opened new avenues for innovation in the digital cam lock market.
Need help to decode the market growth? Connect with our experts for a simplified analysis!
Biometric Cam Locks:
Biometric technology has also made its way into the design, with cam lock manufacturers introducing locks that require fingerprint verification or facial recognition to unlock. Companies like Master Lock, Southco, and Blusafe are pivotal in introducing biometric cam locks to the market.
With a storage capacity of up to 100 fingerprints, these locks offer a higher security level. Thus, providing a long-term security solution, these features make them ideal in sensitive areas such as data centers and personal lockers.
Cam Locks for Environmental Durability
Another area of innovation is the development of cam locks designed for extreme conditions. These locks are made from materials resistant to corrosion, dust, and water, making them suitable for outdoor use, where traditional locks would quickly fail.
Biodegradable plastics and recycled metal alloys are some environment-friendly manufacturing materials used to reduce carbon emissions. Moreover, the trend towards sustainability has led manufacturers to offer customized cam locks in harsh environments such as marine applications.
Future Potential of Cam Locks
The future of cam locks lies in further integration with smart home and building management systems, allowing for seamless security solutions. In order to enable remote monitoring, artificial intelligence (AI) and machine learning (ML) technologies can be utilized to make smarter and reliable cam locks. With predictive security features that can detect and prevent unauthorized access attempts before they happen, the cam locks market is set to alter the landscape security technology.
Grab a quick read to understand the key insights of the cam locks market: https://www.tritonmarketresearch.com/pressrelease-details/cam-locks-market-insights
FAQs
Q.1) What are the common applications for cam locks in various industries?
Answer: Cam locks are widely used in numerous industries, such as furniture manufacturing, automotive, electronic enclosures, healthcare, and security. They cater to the demand for secure storage solutions for cabinets, drawers, mailboxes, vending machines, lockers, and more.
Q.2) What are the advantages of cam lock?
Answer: The key advantage of cam lock fittings lies in their capacity to offer swift and effortless connections. Engineered with a straightforward yet efficient mechanism, these locks enable prompt connection and disconnection without any specialized tools.
0 notes
Text
Restaurant Catering Systems Market Size, Type, segmentation, growth and forecast 2023-2030

Restaurant Catering Systems Market
The Wealth Management Software Market is expected to grow from USD 4.26 Billion in 2022 to USD 8.96 Billion by 2030, at a CAGR of 13.80% during the forecast period.
Get the Sample Report: https://www.reportprime.com/enquiry/sample-report/11112
Restaurant Catering Systems Market Size
Restaurant Catering Systems refer to software solutions designed for establishments in the catering and foodservice industry. These systems are used to manage a range of processes such as inventory management, menu planning, order management, delivery tracking, and billing. The market research report covers the Restaurant Catering Systems market segment based on type, application, region, and market players. The market is segmented into Cloud-based and On-premises solutions based on the type of deployment. On the basis of applications, the market is segmented into Small and Medium Enterprises (SMEs) and Large Enterprises. The report also covers the geographical segmentation and key players within the market, including Event Temple, GoFrugal Technologies, PeachWorks, Pxier, Aptus Systems, Optimo, Oryx Digital, MonkeyMedia Software, ResortSuite, CaterXpress, AeroChef, The CBORD Group, Naxtech, Plateful, and Kott Software. The report also analyzes the market based on regulatory and legal factors specific to market conditions, such as food safety regulations and labor laws. The report provides insights about the market size, growth rate, market share, and future trends.
Restaurant Catering Systems Market Key Player
Event Temple
GoFrugal Technologies
PeachWorks
Pxier
Aptus Systems
Buy Now & Get Exclusive Discount on this https://www.reportprime.com/enquiry/request-discount/11112
Restaurant Catering Systems Market Segment Analysis
The target market for Restaurant Catering Systems includes restaurants of various sizes, catering companies, and event planners. The demand for these systems is driven by the need for efficient management of catering operations, including menu planning, inventory management, billing, and staff scheduling. The use of technology such as online ordering, mobile apps, and automated inventory tracking has become increasingly popular in the restaurant industry, making Restaurant Catering Systems a compelling choice for businesses looking to streamline their operations and boost profitability.
Recent trends in the Restaurant Catering Systems market include the integration of artificial intelligence and machine learning to enhance menu recommendations and optimize operations. The use of data analytics to predict demand and manage inventory has also become prevalent. In addition, there has been a significant increase in the use of mobile devices and cloud-based solutions to access and manage catering systems remotely.
Some of the major challenges facing the Restaurant Catering Systems market include the high initial costs associated with implementing these systems, as well as the need for ongoing maintenance and upgrades. The complexity of integrating these systems with existing infrastructure and staff training can also pose challenges for businesses.
According to the report, the Restaurant Catering Systems market is expected to experience significant growth in the coming years, driven by the increasing demand for efficient and streamlined catering operations. The report recommends that businesses invest in scalable solutions that can grow and evolve alongside their operations, while also prioritizing staff training and integration with existing infrastructure.
Overall, the Restaurant Catering Systems market presents a compelling opportunity for businesses looking to boost profitability and streamline their catering operations. By leveraging the latest technology and trends, businesses can optimize their processes and improve customer satisfaction, ultimately driving revenue growth and success in a competitive marketplace.
This report covers impact on COVID-19 and Russia-Ukraine wars in detail.
Purchase This Report: https://www.reportprime.com/checkout?id=11112&price=3590
Market Segmentation (by Application):
Small and Medium Enterprises (SMEs)
Large Enterprises
Information is sourced from www.reportprime.com
0 notes
Text
At the end of March this year, Entain PLC (LON: ENT) bounced off its support level of £1,164 and started rising. This bullish rally continued until early May this year when the stock price reached a new high of £1,516. Fast forward two months, the mighty has fallen to its all-time low after the half-yearly report arrived in August.
What caused the bulls to run away?
Entain PLC has shown impressive growth in its revenue, which has increased by 13% to £2.38B as compared to the previous year. The Gross profit has also seen a growth of 4.26% and is currently reported to be £1.21bn. The gross margins of Entain PLC are impressive at 51%, which indicates the company is making money after paying direct costs. Coming down to the indirect costs or selling and general expenses, it is important to note that the company is currently facing an operating loss of £370M.
Moreover, The P.E. ratio of the firm is currently negative, which can be attributed to the company’s net profit loss. While the net margin has been declining for the past two years and currently stands at -20%. Furthermore, the company’s debt-to-equity ratio of 1.20 indicates that it is high on debt as compared to its retained earnings
The first thought
Being a small-cap company, Entains’ management is focused on revenue growth by reinvesting heavily into the business after paying off the cost of goods and by looking at the consistent revenue growth, this strategy is working.
Technical analysis and prediction of ENT stock price
As of this writing, the ENT stock price is trading at the level of £948 after coming back from its all-time low of £897. The bullish candles are being made, and the bullish investors will likely test the immediate resistance level of £1036.
The Bulls will try to break over the resistance level if the momentum is strong enough. If the breakout occurs, the stock will reach its 2nd resistance level of £1145. One of the significant things to notice is that “the RSI line is below its oversold zone of 30”. It means the bulls will have enough room to push the price above till the RSI reaches its overbought level of 70.
Conclusion
The ENT stock price was rising until August of this year. The primary reason for the fall was the half-yearly report, where the company made positive growth but negative operating income. This stock is near its all-time low, but the bulls are trying to overcome the immediate resistance. The current price actions reveal that the Bulls might succeed in their mission.
Technical Levels
Support:£898
Resistance: £1036, and £1145
Source
0 notes
Text
Booming Growth: The Expanding Market of Antibiotic Manufacturers in India

The global antibiotic market was worth a whopping $48.73 billion in 2022. Experts predict that it will keep growing, about 4.26% each year from 2023 to 2030. Why is this happening? Well, it's because more and more people are getting bacterial infections, and we need new antibiotics to fight them. People are looking for better medicines to deal with these diseases. This also creates numerous opportunities for antibiotic manufacturers.
Read more: https://healthzen.vimaexports.com/blog/booming-growth-the-expanding-market-of-antibiotic-manufacturers-in-india
#Antibiotic Manufacturers in India#Best Antibiotic Manufacturers in India#Top Antibiotic Manufacturers in India#Antibiotic Manufacturers Company in India
0 notes
Text
Alternative data is non-conventional data that can offer an indicator of a firm's future performance other than typical sources such as corporate filings, broker predictions, and management guidance.,
#Alternative Data Market#Alternative Data Market analysis#Alternative Data Market growth#Alternative Data Market demand
0 notes
Link
Underwater Lighting Market is set to grow at a 4.26% CAGR over the Predicted Years, Global Underwater Lighting Market Research Report by Light Source, Mounting Type, Application, Region | Underwater Lighting Industry
0 notes
Text
Bank Exam New Pattern Model Questions ( Predicted Question Bank ) – 2023
Data Interpretation – 22
instagram
Best for Banking, SSC, RAILWAY, State Govt Job & other Competitive Exams preparation)
Bank Exam New Pattern Model Questions ( Predicted Question Bank ) – 2023
Data Interpretation – 22
(Predicted Question Bank)
https://theplanetvidya.org/wp-content/uploads/2023/05/
Data-Interpretation-22-PLANET-VIDYA-B.jpg
Q
What is the sum of the profit earned by Ericsson Company on 5G phones and that by Casio Company on 4G phones?
1) Rs. 224.8 lakh 2) Rs. 248.4 lakh 3) Rs. 262.4 lakh 4) Rs. 287.5 lakh 5) Rs. 320 lakh
What is the ratio of the profit earned on 4G phones to that on 5G phones by Black Berry Company ?
1) 5 : 7 2) 12 : 25 3) 3 : 7 4) 3 : 5 5) None of these
The profit earned by Dell Company on 5G phones is what per cent of the total production cost of Apple Company on 4G phones?
1) 7.5% 2) 10% 3) 12.5% 4) 15% 5) 17.5%
What is the total production cost of 5G phones by Apple Company and Dell Company together?
1) 12.4 crore 2) 12.8 crore 3) 13.2 crore 4) 13.6 crore 5) 14 crore
What is the total profit earned by Firefly Company for both 4G and 5G phones together?
1) Rs. 4.26 crore 2) Rs.4.64 crore 3) Rs.4.92 crore 4) Rs. 5.24 crore 5) Rs.5.84 crore
3) C3 4) E5 5) F6
.
--------‐------------------
PLANET VIDYA
for
Top Banking Coaching ,
Indian ( Central) / State Level (Odisha) Government Competitive Entrance Examination Training / Coaching Classes
( Planet Vidya Pariwar & M Power Group )
Banking, SSC, RAILWAY, OSSC, ASO, OSSSC
( Competitive Entrance Examination Training
Centre
: Offline/ Online or Hybrid Mode Coaching Classes )
( Planet Vidya Pariwar & M Power Group )
0 notes
Link
0 notes
Text
Global Copper Wire and Cable Market Size, Report, and Forecast 2021-2027
The Global Copper Wire and Cable Market is expected to grow from US$ 187.11 Billion in 2021 to US$ 240.34 Billion by 2027; it is estimated to grow at a CAGR of 4.26% from 2021 to 2027.
The best electrical conductor is copper wire, which is superior to all other materials. Copper wire enables quick and secure connections. They have a high melting point and are easy to bend. A copper wire can withstand significant overloads or current surges without suffering harm. Different varieties of copper wire all have the ability to conduct electricity with nominal resistance and low voltage. The fact that copper is malleable is among its most significant qualities. Copper can be fabricated into thin sheets thanks to its property. In order to create alloys, copper combines with other metals quite well. Without being stressed or broken, it might become distorted.
Get Sample Copy of this Report @ https://qualiketresearch.com/request-sample/Copper-Wire-and-Cable-Market/request-sample
Drivers: The growth of copper wire for grounding in the nation and the area as a whole is being driven by the expansion of the building industry. Notably, the improvements consist of upkeep and repairs as well as substantial replacements, modifications, and expansions. With regard to electrical maintenance and other uses, these trends are predicted to increase demand for a variety of grounding works using both insulated and non-insulated copper cables.The market for copper wire and cable is expanding primarily as a result of factors like rising energy demand and substantial investments in building development. Additionally, the growth in expenditures in smart upgrades to the power transmission and distribution systems, together with the development of smart grids, increase demand for copper wire and cable.
Restraints: For instance, as the requirement for grid interconnections has grown, smart grid technology has been able to meet it, leading to a boom in expenditures in new underground and submarine cables. However, it is anticipated that raw material price instability may impede market expansion.
Opportunities: On the other hand, it is projected that throughout the forecast period, growing urbanisation together with an increase in investments across the industrial sector will generate attractive growth prospects for the market.
Impact of Covid-19
The outbreak of COVID-19 has had a substantial effect on the global Copper Wire & Cable business. Because of the global labour shortage and slowdown, production of electrical, electronic, and semiconductor products has been put on hold. The Covid-19 outbreak has significantly and persistently reduced factory utilisation, and travel restrictions and facility closures kept workers away from their workplaces, which slowed the growth of the copper wire & cable industry.
Due to the closure of the region's manufacturing facilities, the Asian and European nations that are currently under lockdown have seen significant losses in trade and revenue. The spread of the COVID-19 infections has had a significant influence on the production and manufacturing industries' operations. resulting in a slowdown in the market's expansion for copper wire & cable in 2020.
Get discount on this Report @ https://qualiketresearch.com/request-sample/Copper-Wire-and-Cable-Market/ask-for-discount
Segmentation By Type: Copper Wire and Cable Market is classified on the basis of Type into Wire and Cable.
Segmentation By Voltage: Copper Wire and Cable Market is classified on the basis of Voltage into Low, Medium, and High.
Segmentation By Application: Copper Wire and Cable Market is classified on the basis of Application into Building Wire, Communication, Power Distribution, Others.
Segmentation By Region: Copper Wire and Cable Market is classified on the basis of Region into North America, Europe, Asia Pacific, Latin America, and Middle East & Africa.
Competitive Landscape: The key players of Copper Wire and Cable Market are Aviva Metals (NBM Metals), Belden Inc., Prysmian Group, Altas Holdings, CommScope Holding Company Inc., Elcowire Group AB (Liljedahl Group AB), Hitachi Metals Ltd., Nexans S.A., Ningbo Jintian Copper (Group) CO. Ltd., Schneider Electric SE and Tongling Jingda Special Magnet Wire Co. Ltd.
Industrial Development
The largest cable supplier in the world, The Prysmian Group, is expanding its product line in June 2019 with the network Draka UC400 23 Cat, which is incredibly portable and adaptable. This is primarily utilised for business and public sector buildings.
Market Taxonomy
By Type
Wire
Cable
By Voltage
Low
Medium
High
By Application
Building Wire
Communication
Power Distribution
Others
By Region
North America
Europe
Asia Pacific
Latin America
Middle East & Africa
Key Questions Addressed by the Report
What are the Key Opportunities in Copper Wire and Cable Market?
What will be the growth rate from 2020 to 2027?
Which segment/region will have highest growth?
What are the factors that will impact/drive the Market?
What is the competitive Landscape in the Industry?
What is the role of key players in the value chain?
Browse Full Report https://qualiketresearch.com/reports-details/Copper-Wire-and-Cable-Market
0 notes
Text
Social media marketing trends for Businesses in 2023
Did you know that there are over 4.26 billion social media users across the globe? That figure alone is enough to prove the enormous reach of social media and its power to influence. Digital marketers are known to invest a major portion of their funds in social media marketing as they understand the need to harness the power of social media and utilize it when designing advertising campaigns.
Social media is constantly evolving with newer trends catching on in the blink of an eye. From new platforms popping up to new features being added to existing ones, social media has become a massive change machine. There is no option for digital marketers but to keep up with the trends in order to create successful campaigns for businesses.
Here are a few social media marketing trends 2023 that are sure to help you rake in the profits.
CategoriesAutomation BUSINESS ARCHITECTURE Content Marketing CREATIVITY & DESIGN DATA ANALYTICS Digital Marketing eCommerce Business EMAIL MARKETING Infrastructure MANAGEMENT CONSULTING MANAGEMENT CONSULTING & INFRASTRUCTURE Marketing ONLINE REPUTATION MANAGEMENT Search Engine Optimization Social Media Social Media Marketing SOFTWARE & ANALYTICS Software Application Software Development Software Testing SYSTEM INTEGRATION Technology TESTING & QA WEB DESIGN WEB DESIGN & DIGITAL MARKETING WEB DEVELOPMENT Website Design & Development
Table Of Content
Table Of Content Use of Social Media Platforms to Target Specific Audiences Faster Social Media Responses Short Form Video Content User Generated Content or UGC Social Media as a Shopping Portal
A recent survey by Joy Ventures and getWizer tracked the social media habits of males and females between the ages of 15 to 25 (Gen Z).
According to the survey, it was found that YouTube ranked the highest on their list of preferences followed by Instagram, Snapchat and TikTok.
In another prediction by eMarketer (April, 2022) it is estimated that Facebook will see a drop in users below the age of 25 in 2023.
It was found that Gen Z preferred to visit TikToks to check for new brands and products more than any other social media platforms.
Why is this data important? This data tells you where your target audience resides in terms of social media and where to take your marketing pitch. The biggest challenge for digital marketers is find a way to make the consumer meet the product. Unless you can identify and locate your target audience, you will not be able to advertise your products or business to them.
Remember, the consumer today is sophisticated and loves to experiment – which is what users do with social media platforms. There is a constant influx of users in and out of a platform based on preferences, newly introduced features, gender, age and more.
As a digital marketer, you must stay alert and collect relevant data on social media audiences and their usage in a systematic way and then incorporate the data in your marketing campaigns. This is the most important social media marketing trends 2023 and onwards that you need to put efforts in if you are not doing it already.
Anything related to a business on social media is a marketing opportunity. Most businesses today are on Facebook, and on other social media platforms. In this regard, for instance, a Facebook page of a business is a way to not just market its products or services but also to interact with users.
What really works here is the ‘time to respond’ – the quicker you are in replying to a comment or feedback, the better it is. Because the consumer is impatient and wants an “immediate” answer – they do not want to wait for a reply for more than 10 minutes. And that is a statistical fact.
According to a HubSpot research, 46% of consumers in the marketing phases prefer to have an answer to their query in less than 10 minutes while 62% of consumers in the sales phase expect an answer within the next 10 minutes. When it comes to support, 60% of consumers are willing to wait for no more than 10 minutes for a resolution.
The exchanges you have on social media goes a long way into building your reputation and the last thing you would want is an irate customer highlighting your service issues to the rest of the world. It is therefore important that you have a support team strategically placed to respond immediately to the comments and feedback received through social media.
Today the consumer believes more in the reviews that they see from existing customers regarding a product. If the reviews are not favorable, you may end up losing sales opportunities. Therefore, always bring a positive conclusion to your interactions with every customer or user.
Faster social media responses is going to be social media marketing trend 2023 and forever. If you have a planned strategy for the same, great! You might want to fine tune it further, and if you haven’t gotten around to do it yet, its high time you plan and execute a strategy to offer faster responses on social media.
Short video content has become extremely popular in the last few years. It is estimated that nearly 82% of all content with be short video content.
In the year 2020, TikTok experienced massive amounts of downloads to the tune of about 315 million in a year.
Every social media platform has a feature or is in the process of adding a feature to enable users to shoot and upload short videos. For instance, Instagram reels that was launched in the year 2020 as was YouTube Shorts.
Short video content has higher entertainment value and is more engaging to the user. That is why, short video reels can garner up to twice the amount of views than regular videos. Influencers often release short videos to interest viewers and then direct them to the actual full video.
The trend for short form video content is here to stay. As a digital marketer, you might want to create short form video content instead of static photos for your social media posts for better performance. This is going to be one of the biggest social media marketing trends 2023 that you must watch out for.
User Generated Content or UGC
User Generated Content or UGC
As a business, you have to build trust. You can create marketing campaigns for your business to entice the consumer and influencing them to make a buying decision. Or you can simply take advantage of user generated content to sway consumers your way.
According to statistics, UGC can help increase the conversion rate by about 82%. In fact, 77% of shopper look for UGC before hitting on the “Buy” button. There are mainly three types of UGC that have the maximum power to influence the consumer:
The question and answer: These comprise of answers to actual questions put forth on the site by users.
The Reviews: This section is dedicated to reviews that are posted by users who have purchased the product. Users write about their experience with the product and how satisfied or unhappy they are with the services or the product.
The actual Images/actual videos: This consists of actual user images and videos posted by the user of the product. Consumers often rely on these pictures more than the professional images you post of your product.
One of the best ways that UGC works for you is by the way of reviews. Positive reviews are good for your business, but negative reviews do not work as badly for you as you would expect them to. People often do not go with a negative review as they may believe that their experience of the product may be different. And they may still go for the product.
The Covid 19 pandemic saw a spur of online shopping. Businesses scrambled to create processes and infrastructure to cater to the huge demands of virtual buying. Social media platforms have now become an extremely popular shopping outlet with the number of buyers on social media platforms slated to exceed over 100 million in the year 2023.
Not only that, consumers are using social media platforms to look for products to buy. it is estimated that nearly 70 percent of the users like to shop and look for products on Instagram.
According to a survey by eMarketer, 7 out of 10 adults have not yet bought products from a social media marketplace. Therefore, the potential for purchasing through social media is immense.
Marketplaces in social media will only become more sophisticated and is an important social media marketing trends 2023 and beyond.
Social media is a powerful tool for businesses to promote their products. Social Media enjoys tremendous influence and businesses need to harness the power for their own good. As the marketplace becomes more competitive, social media platforms use technological advances to add features and lure the consumers. As a business, you must stay on top of the technological advances and trends to make the most out of social media marketing.
0 notes
Text
Election 2022 Governor Prediction Map October 13, 2022
My Twitter: https://twitter.com/StatesPoll/
This Map Created with www.Mapchart.net
* My analysis is neutral, not biased.
Based on
1) Presidential Election 2020 Fox New Voter Analysis
https://www.foxnews.com/elections/2020/general-results/voter-analysis
2) Latest Poll(adjustment)
3) Voter registration statistics Trend + VBM
4) Oppostion Party’s Advantage on the Midterm
(more Rep % / less Dem % than Presidential Year)

* My Party ID % By States speculation post:
https://statespoll.com/post/696993333852110848 (October, 2022)
Last Updated: October 18 (MI/MN/NY/OK)
I. BattleGround States
1. Pennsylvania
1) My Party ID speculation, PA
with leaner: REP 47% / DEM 46% / IND 7%
2) Latest Poll
(1) Trafalgar, 10/8-10/11. 1,078 LV.
https://www.thetrafalgargroup.org/wp-content/uploads/2022/10/TRF-PA-General-1013-Full-Report.pdf
Poll results: Shapiro 52.8% / Mastriano 43.5% D +9.3%
(2) Marist, 9/19-9/22. 1,242 RV.
https://maristpoll.marist.edu/wp-content/uploads/2022/09/Marist-Poll_PA-NOS-and-Tables_202209260846.pdf
Poll results: Shapiro 53% / Mastriano 40%
Adjusted %: Shapiro 50.68% / Mastriano 44.28%. D +6.4%
Shapiro: REP(47%)x9%+DEM(46%)x92%+IND(7%)x59%= 50.68%
Mastriano: REP(47%)x85%+DEM(46%)x5%+IND(7%)x29%= 44.28%
3) Pennsylvania Gov Race 2022 Forecast: Lean D~Likely D
2. Wisconsin
1) My Party ID speculation, WI
with leaner: REP 50% / DEM 41% / IND 9%
2) Latest Poll
(1) CBS/YouGov 10/3-10/6. 1,137 LV
https://drive.google.com/file/d/1uclbIibNNAyy4EeQwzW_vo8J8ZihJ5IB/view
Poll results: Michels 50% / Evers 50% tied
My adjusted %: Michels 51.37% / Evers 48.5% R +2.83%
Michels: R(50)x93+D(41)x2+I(9)x45=51.37
Evers: R(50)x7+D(41)x98+I(9)x54=48.54
(2) Trafalgar 9/15-9/19, 1,087 LV
https://www.thetrafalgargroup.org/news/wi-gov-0923/
Poll samples: R 45.4% D 43.2% IND 11.4%
Poll results: Michels 47.7% / Evers 47.0% R +.0.7%
3) Wisconsin 2022 Gov Race Forecast: Lean R
3. Arizona
1) My Party ID speculation, AZ
with leaner: REP 50% / DEM 42% / IND 8%
2) Latest Poll
(1) CBS/YouGov 9/30-10/4. 1,164 LV
https://www.cbsnews.com/news/mark-kelly-opinion-poll-arizona-senate-economy-abortion-immigration-2022-10-05/
Poll results: Lake 49% / Hobbs 49%
My adjusted %: Lake 52.1% / Hobbs 47.7%. R +4.4%
Lake: R(50)x93+D(42)x4+I(8)x49=52.1
Hobbs: R(50)x7+D(42)x96+I(8)x49=47.74
(2) Data for Progress(D) 9/15-9/19, 768 LV
https://t.co/lMMwMoub3y
Poll samples:
Poll results: Lake 51% / Hobbs 47%
Adjusted %: Lake 54.3% / Hobbs 44.4% Lake +9.9%
Lake: 50%(REP)x95% + 42%(DEM)x7% + IND(8%)x48%= 54.28%
Kelly: 50%(REP)x4% + 42%(D)x92% + IND(8%)x47%= 44.4%
3) Arizona Party ID % Statistics
(1) August 2022
REP: 34.52% DEM: 30.97% R +3.55%
https://azsos.gov/elections/voter-registration-historical-election-data
(2) November 6, 2018: Total 3,712,500
Rep: 35.24% DEM: 32.2% R +3.04%
https://azsos.gov/elections/voter-registration-historical-election-data/voter-registration-counts
about +0.51% shift for Rep.
4) Arizona 2022 Forecast: Lean R~Likely R
4. Nevada
1) My Party ID speculation, NV
with leaner: REP 48% / DEM 43% / IND 9%,
2018 NVGov Fox Voter Analysis: DEM 44% / REP 42% / IND 14%
2020 NV Pres Fox Voter Analysis: REP 48% / DEM 47% / IND 6%
2) Latest Poll
(1) USA Today/Suffolk 10/4-10/7, 500 LV
https://www.suffolk.edu/academics/research-at-suffolk/political-research-center/polls/other-states
https://www.suffolk.edu/-/media/suffolk/documents/academics/research-at-suffolk/suprc/polls/other-states/2022/10_12_2022_nevada_tables.pdf?la=en&hash=30E09572ABF7B9C5E29F2548DC907D6F6456C1AE
Poll samples:
Poll results: Lombardo 44% / Sisolak 43%. R +1%
Adjusted %: Lombardo 47.7% / Sisolak 43.0%. R +4.7%
Lombardo: 48%(REP)x88% + 43%(D)x5% + IND(9%)x37%= 47.72%
Sisolak: 48%(REP)x7% + 43%(D)x86% + IND(9%)x30%= 43.04%
(2) Data for Progress(D) 9/14-9/19, 874 LV
https://t.co/duId6igIwS
Poll samples:
Poll results: Lombardo 45% / Sisolak 45% / Davis(L) 4%
Adjusted %: Lombardo 49.99% / Sisolak 45.73% / Davis(L) 0.6% R +4.26%
Lombardo: 48%(REP)x91% + 45%(D)x6% + IND(6%)x45%= 49.99%
Masto: 48%(REP)x4% + 45%(D)x93% + IND(6%)x32%= 45.73%
Davis: 48%(REP)x0% + 45%(D)x0% + IND(6%)x10%= 0.6%
3) Nevada Party ID % Statistics
(1) September 6, 2022: Active Voters. Total 1,779,484
DEM 586,475(32.96%) REP 538,077(30.24%) D +2.72%
https://www.nvsos.gov/sos/elections/voters/voter-registration-statistics/2022
(2) November 2, 2020: Active Voters. Total 1,821,356
DEM 679,332(37.3%) REP 591,916(32.5%) D +4.8%
https://www.nvsos.gov/sos/elections/voters/2020-statistics/-fsiteid-1
(2) October 18, 2018: Active Voters. Total 1,560,928
DEM 598,174(38.32%) REP 523,251 (33.52%) D +4.69%
https://www.nvsos.gov/sos/elections/voters/2020-statistics/-fsiteid-1
Since november 2020 about +2.08% shift for Rep.
4) Nevada 2022 Forecast: Lean D
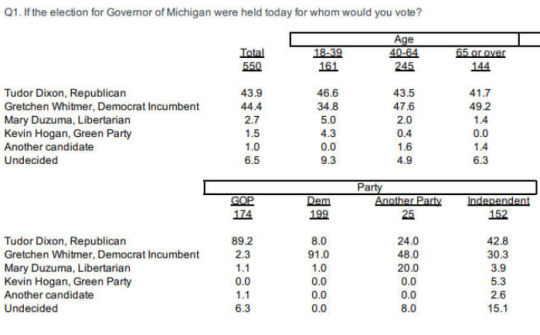
5. Michigan
1) My Party ID speculation, MI
with Leaner: REP 47% / DEM 42% / IND 11%
2) Latest Poll
(1) Emerson 10/12-10/14. 580 LV
https://emersoncollegepolling.com/michigan-2022-gov-whitmer-holds-five-point-lead-over-tudor-dixon-majority-plan-to-vote-yes-for-proposal-3-on-abortion/
Poll results: Whitmer 49.2% / Dixon 43.9%
My adjusted %: Dixon 47.2% / Whitmer 46.9%. R +0.3%
Dixon: R(47)x88.7+D(42)x3.1+IND/Other(11)x38.6=47.237%
Whitmer: R(47)x3.6+D(42)x95.6+IND/Other(11)x46.2= 46.926
Emerson MI Poll
among REP undecided 5.4% / DEM undecided 0.9% / IND undecided 8.3%
Race
White: Dixon 48.9% / Whitmer 44.8%
Black: Dixon 12.7% / Whitmer 76.1%
Hispanic: Dixon 41.4% / Whitmer 58.6%
(2) InsiderAdvantage 10/12. 550 LV
https://amgreatness.com/2022/10/13/insider-advantage-whitmer-and-dixon-tied-in-michigan-governors-race-joe-bidens-approval-down-to-37-percent/
Poll results: Whitmer 44.4% / Dixon 43.9%
My adjusted %: Dixon 49.7% / Whitmer 42.9%. R +6.8%
Dixon: R(47)x89.2+D(42)x8+IND/Other(11)x40.1= 49.695%
Whitmer: R(47)x2.3+D(42)x91+IND/Other(11)x32.8= 42.909%
(3) CBS/YouGov 10/3-10/6. 1,285 LV
https://drive.google.com/file/d/1s04p69otLd2J3DYMm21g9DLmAz6DhSlq/view
Poll results: Whtimer 53% / Dixon 47%. D +6%
My adjusted %: Whitmer 51.9 / Dixon 48.05. D +3.85%
Whitmer: R(50)x12+D(45)x97+I(5)x45=51.9
Dixon: R(50)x88+D(45)x3+I(5)x54=48.05
3) Michigan 2022 Gov Race Forecast: Toss up~Tilt R
6. Minnesota
1) Election 2020 Fox News Voter Analysis
MN: 3,583 Respondents(Voters)
https://www.foxnews.com/elections/2020/general-results/voter-analysis?state=MN
(1) Party ID%, Minnesota with leaner: DEM 47% / REP 46% / IND 6%
Trends could be similar like PA R +1% D -1% from 2020
(voter regd in Iowa is also trending R)
My Speculation(September, 2022). Minnesota
with leaner: REP 47% / DEM 45% / IND 8%
2) Latest Poll
(1) MinnPost 10/10-10/14, 1,585 LV
https://docs.google.com/spreadsheets/d/1YvHqJVoiDCp5NEWzuQHfhoCt9uxuin8keKdZ5iCl5Q0/edit#gid=0
Poll results: Walz 47% / Jensen 42%
My adjusted %: Jensen 44.9% / Walz 44.74%. R +0.16%
Jensen: R(47)x88+D(45)x2+IND(8)x33= 44.9%
Walz: R(47)x2+D(45)x92+IND(8)x30= 44.74%
undecided/would not vote: REP 6% / DEM 2% / IND 23%
3) Minnesota 2022 Forecast: Toss up
Cosindered of 3rd parties factor(two weeds parties which are generally takes the more vote away from Dem than Rep.)
7. Oregon
2) Latest Poll
(1) Emerson 9/29-10/1. 796 LV
https://emersoncollegepolling.com/oregon-2022-republican-christine-drazan-with-two-point-lead-over-democrat-tina-kotek-for-governorship-sen-wyden-holds-19-point-lead-in-re-election-bid/
Poll samples: D 35.9% / R 26.25% / IND 37.8%
Poll results: Drazan(REP) 35.9% / Kotek(DEM) 33.7% / Johnson(IND) 19.2%
3) Oregon 2022 Gov Race Forecast:Tilt R
8. Maine
1) My Party ID speculation, ME
with leaner: REP 47% / DEM 45% / IND 8%
2) Latest Poll
(1) Emerson 9/19-9/20. 1,164 LV
https://emersoncollegepolling.com/maine-poll-mills-leads-lepage-by-12-majority-of-voters-concerned-over-lobsters-on-unsustainable-seafood-red-list/
Poll samples: DEM 37.8% / REP 30.3% / IND 31.9%
Poll results: Mills 52.6% / LePage 41.3% / Hunkler 1.3%
Adjusted % : Mills 48.14% / LePage 45.15% D +2.99%
Mills: REP(47%)x8.2%+DEM(45%)x89.3%+IND(8%)x51.2%= 48.135%
LePage: REP(47%)x83.9%+DEM(45%)x5.9%+IND(8%)x42.9%= 45.152%
3) Maine Governor 2022 Forecast: Tilt~Lean D
9. New Mexico
1) My Party ID speculation, NM
with leaner: DEM 49% / REP 45% / IND 6%
2) Latest Poll
(1) PPP(D) 10/6-10/7, 806 RV
https://nmpoliticalreport.com/2022/10/10/lujan-grisham-leads-governors-race-by-8-points/
1) Poll results
Results: Grisham(DEM) 48% / Ronchetti(REP) 40%. D +8%
3) New Mexico Governor 2022 Forecast: Lean D
10. Colorado
1) My Party ID speculation, CO
with leaner: DEM 48% / REP 45% / IND 8%
2) Latest Poll
(1) Emerson 9/18-9/19. 1,000 LV
https://emersoncollegepolling.com/colorado-2022-democratic-senator-bennet-and-governor-polis-hold-double-digit-leads-in-re-election-campaigns/
Poll results: Jared Polis(DEM) 52.8% / Heidi Ganahl(REP) 35.9%. D +16.9%
Adjusted %:Similar as Poll results
3) Colorado Governor 2022 Forecast: Likely~Solid D
11. Kansas
1) My Party ID speculation, KS
with leaner: REP 59% DEM 37% IND 4%
2020 Fox voter analysis KSSen: REP 59% DEM 37% IND 4%
https://www.foxnews.com/elections/2020/general-results/voter-analysis?race=S&state=KS
2018 KSGov it was REP 54% / DEM 35% / IND 11%
https://www.foxnews.com/midterms-2018/voter-analysis?filter=KS&type=G
2) Latest Poll
(1) Emerson 9/15-9/18 1,000 LV
https://emersoncollegepolling.com/kansas-2022-democratic-governor-laura-kelly-in-tight-race-with-a-g-derek-schmidt-in-gubernatorial-election/
Poll results: Kelly(DEM) 44.6% / Schmidt 43.1%
Adjusted %:
Schmidt: R(59%)x74% +D(37%)x5.9%+IND(4%)x29.6%=47.027%
Kelly: R(59%)x19.4% +D(37%)x89.6%+IND(4%)x52.7%= 46.706%
3) Kansas Party ID % Statistics
https://sos.ks.gov/elections/elections-statistics-data.html#voter-registration
Aug,2022 Total 1,951,099
REP 858,429 (44.0%) DEM 503,746 (25.82%) R +18.18%
Jan, 2021 Total 1,942,156
REP 874,555 (45.03%) DEM 509,955 (26.26%) R +18.77%
4) Kansas Governor 2022 Forecast: Toss up
12. Connecticut
1) My Party ID speculation, CT
with leaner: DEM 53% / REP 41% / IND 6%
2) Latest Poll
(1) Emerson 9/7-9/9. 1,000 LV
https://emersoncollegepolling.com/connecticut-2022-democratic-governor-lamont-holds-double-digit-leads-over-republican-stefanowski/
Poll samples: DEM 37.3% / REP 21.7% / IND 41.0%
Poll results: Lamont 48.5% / Stefanowski 38.4%
Adjusted: Lamont 49.9% / Stefanowski 40.7%. D +9.2%
Lamont: DEM(53%)x78%+REP(41%)x15.2%+IND(6%)x39.4%=49.936%
Stefanowski: DEM(53%)x13.4%+REP(41%)x75.9%+IND(6%)x41.2%=40.693%
3) Connecticut Governor 2022 Forecast: Solid D
FYI) 2018 CO Gov race results: Lamont 49.4% / Stefanowski 46.2%. D +3.2%
The race for governor is heating up with a 2018 rematch of
Ned Lamont vs. Bob Stefanowski.
13. Illinois
1) My Party ID speculation, IL
with leaner: DEM 51% / REP 41% / IND 8%
2) Latest Poll
(1) Victory Research ®
https://projects.fivethirtyeight.com/polls/20220722_IL_VictoryResearch.pdf
Poll results: Pritzker(DEM) 49% / Bailey(REP) 39%. D +10%
Adjusted %: Pritzker(DEM) 48.36% / Bailey(REP) 40.27%. D +8.09%
[1] Pritzker(DEM) Total 48.363%
DEM(51% Share) x 82.4% = 42.024
REP (41% Share) x 8.3% = 3.403
IND/Other (8% Share) x 36.7% = 2.936
[2] Bailey(REP) Total 40.268%
DEM(51% Share) x 6.1% = 3.111
REP (41% Share) x 81.3% = 33.333
IND/Other (8% Share) x 47.8% = 3.824
3) Illinois Governor 2022 Forecast: Solid D
14. New York
1) My Party ID speculation, New York
with leaner: DEM 57% / REP 38% / IND 5%
without leaner: DEM 48% / REP 26% / IND 26%
2018 NYGov Fox voter analysis
2) Latest Poll
(1) Siena 10/12-10/14 707 LV
https://www.realclearpolitics.com/docs/2022/601168109-Siena-College-poll.pdf
Poll results: Hochul(DEM) 52% / Zeldin(REP) 41%
My adjusted %: Hochul 54.4% / Zeldin 38.9% D +15.5%
Hochul: D(57)x84+R(38)x12+I(5)x40=54.44%
Zeldin: D(57)x10+R(38)X81+I(5)x49=38.93%
(2) Data For Progess, 9/9-9/13, 931 LV.
details: https://statespoll.com/post/695504296082554880
Poll results: Hochul 52% / Zeldin 39%
Adjusted: Hochul 55.15% / Zeldin 38.12%. D +17.03%
Crosstabs detail: https://twitter.com/StatesPoll/status/1569273484425199616/photo/1
3) New York Governor 2022 Forecast: Solid D
15. Oklahoma
1) My Party ID speculation, Oklahoma
https://www.foxnews.com/elections/2020/general-results/voter-analysis?state=OK
with leaner: REP 68% / DEM 29% / IND 3% (2020 Fox )
2018 OKGov it was REP 65% / DEM 26% / IND 10%
https://www.foxnews.com/midterms-2018/voter-analysis?filter=OK&type=G
2) Latest Poll
(1) Ascend Action (R)/Fox25 10/10-10/12, 638 LV
https://okcfox.com/news/local/oklahoma-governor-election-midterm-2022-joy-hofmeister-kevin-stitt-democrat-republican-independent-vote-poll-ascend-action-joe-biden
Poll results: Hofmeister (DEM) 49 % / Stitt (REP-INC) 42%
Adjusted: Stitt 48.7% / Hofmeister 41.5% R +7.2%
Stitt: REP(68%)x69%+DEM(29%)x4%+IND(3%)x22%=48.74%
Hofmeister: REP(68%)x20%+DEM(29%)x89%+IND(3%)x69%=41.48%
3) Oklahoma Governor 2022 Forecast: Likely R
0 notes
Text
GUYS IF U USE 3D TOUCH ON TAYLOR'S WEBSITE AN ALBUM COVER POPS UP IM!!!!!!

Edit——
THERE ARE 8 BAR CODES ON THE LEFT TOP COULD IT BE TRACK 8??? IDK SIS U TELL ME @taylorswift

AND CORDINATES OF BEVERLY HILLS HOTEL


THIS IS THE HOTEL IN GOOGLE STREET VIEW AND IDK ABOUT U ALL BUT I SEE A LOT OF PALM TREES, IM SURE U GUYS CAN SEE THE LINK


ALSO IF YOU DONT KNOW HOW TO ACCESS 3D TOUCH, THE ALBUM ART CAN BE SEEN THROUGH julythirteen.com AS WELL, AFTER YOU CLICK ON THIS PIC

2K notes
·
View notes
Text
Story of Us Theory
Okay, so if you don't know the full and latest SOU theory then dive in.
1. As soon as @taylorswift started showing up with OG Taylor hairstyles, I started feeling nostalgic. There were a lot of Swifties with the same feels. Is she going back to her roots? Is she writing an album solo like Speak Now?
Back during BAFTA I posted this because it really stood out to me.

2. We already know she hinted the next chapter. A hook we can never forget. From a tweet by @aquariusswift


3. And if you look at Speak Now era there are hearts. She has been flashing a lot of those lately. These are from @aquariusswift on Twitter.


4. It has been observed that SOU is 4:26 long which correlates to 4.26. And it's also the only song on Spotify without the TS7 era backdrop.
5. Let's also remeber that the Speak Now era was never killed off in the LWYMMD video.

Here are my predictions:
☁️linked to Story of Us
🎅tied to Christmas
🌴palm trees
🦋butterflies
💖hearts
☁️perhaps written entirely by TS
😱a collaboration
😱we will snap
💅highlight of her career
🌈Tour, merch, music, narrative are going to be amazing. I'm living it.💖
#taylorswift#taylor swift#taylornation#ts7 era#ts7 theories#ts7 predictions#ts7#ts7iscoming#4.26 predictions#4.26.2019#4.26.19#4.26 countdown#4.26#taylurking
656 notes
·
View notes
Last Seen Blogs

thisonerandomgirl
Just Ranting

captaineyayah
Too Many Thoughts


indiavisaa
Untitled

hansecancbdshop
Untitled