#zorder
Text
Tras ver Yamato por tercera vez, era necesario.
13 notes
·
View notes
Text
Ren'Py Tutorial: Simple Inventory
Hello friends! In this tutorial, I'm going to show you how to make an easy inventory system for Ren'Py 8.1.3.
This inventory system will allow you to:
Create an icon, like a purse, to open and close the inventory.
Add inventory items, like coins, to the inventory.
Click on the inventory item to see a bigger version of the item.
Click on the item again to close the bigger version.
Let's get started!
Images Needed (save these in the "images" folder of your game):
inv_icon_closed.png - Inventory icon when closed
inv__icon_open.png - Inventory icon when open
inv_item1.png - Inventory item
inv_item2.png - Add inventory items as needed
inv_item1_big.png - A bigger version of inventory item 1
inv_item2_big.png - Add bigger versions as needed
inv_background.png - Inventory bar background
inv_overlay.png - Prevents the screen from being clickable while larger item is displayed (so the story does not continue)
Copy & paste into your script.rpy file:
# Add an init block to set up the initial state of the inventory
init:
$ hovered_item = None # Nothing is hovered on
$ inventory_open = False # The inventory is closed
$ inventory = [] # The inventory is empty
# Controls what happens when you click on the inventory icon and when the icon is clicked, what appears (First Click: inventory bar, overlay, and items if there are any; Second Click: closes inventory)
label click_inv_icon:
if not inventory_open:
show screen inventory_overlay
show screen inventory_bar
show screen inventory_items
$ inventory_open = True
$ renpy.pause(hard=True)
else:
hide screen inventory_overlay
hide screen inventory_bar
hide screen inventory_items
$ inventory_open = False
$ renpy.pause(hard=False)
# Start label to start the game
label start:
show screen inv_icon # Shows the inventory icon
"This is a game." # Dialogue
"With an inventory."
"Here, have an item."
$ inventory.append({
"name": "item1",
"image": "inv_item1.png",
"display_image": "inv_item1_big.png",
"description": "Description of item."
}) # Adds the item to inventory within the game flow. You will have to copy this code and change the item information every time an item is acquired for the inventory.
"Thanks."
Copy & paste into your screens.rpy file:
# Define the screen for displaying the larger image
screen large_item_display():
zorder 15 # Set a higher zorder to ensure it's above other screens
hbox:
xalign 0.5
yalign 0.5
if hovered_item is not None:
vbox:
add hovered_item["display_image"] xalign 0.5 yalign 0.5
text hovered_item["description"] # Display the description
# Define the screen for the inventory overlay
screen inventory_overlay():
zorder 4
modal True
add "inv_overlay.png" # Adjust the image and size as needed
# Define the screen for the inventory bar that displays when the inventory is open
screen inventory_bar():
zorder 5
hbox:
spacing 10
xalign 0.0 # Adjust the X-alignment as needed
yalign 0.0 # Adjust the Y-alignment as needed
add "inv_background.png" size (1280, 100)
# Define the screen for the inventory items
screen inventory_items():
zorder 10 # Set a higher zorder to ensure it's above other screens
vbox:
xpos 100 ypos 10
for item in inventory:
imagebutton:
idle item["image"]
action If(hovered_item != item, [SetVariable("hovered_item", item), Show("large_item_display")],
[Hide("large_item_display"), SetVariable("hovered_item", None)])
text item["name"]
# Define the screen for the inventory icon
screen inv_icon():
zorder 7
hbox:
xalign 0.0 # Adjust the X-alignment as needed
yalign 0.0 # Adjust the Y-alignment as needed
imagebutton idle "inv_icon_closed.png" hover "inv_icon_open.png" action Call("click_inv_icon")
And there you go! This is a simple and customizable way to create an inventory for your Ren'Py game!
Drop a note if you run into any problems. :)
11 notes
·
View notes
Text
How to show a screen on the master layer without the dialogue box in Ren’Py
How to show a screen on the master layer without the dialogue box in Ren’Py If you are working on a Ren’Py project, you may have encountered a situation where you want to show a screen on the master layer, but the dialogue box is still visible on top of it. This can be annoying if you want to create a full-screen effect or hide the dialogue box temporarily. In this blog post, I will show you how to fix this problem with a simple solution that I found.
The problem
Here is an example of the problem that I faced. I am developing a QuestManager 4 game quest. My Quest Manager screen shows all available quests so the player can accept or complete them. I want to show this screen on the master layer so that it covers the entire screen and hides any other displayables. However, when I use the show screen QuestManager function to show the screen, the dialogue box is still visible on top of it, as shown in the screenshot below:

This is not what I want, because it ruins the immersion and makes the screen look cluttered. I tried to use different arguments for the renpy.show_screen() function, such as _layer and _zorder, but none of them worked. I also searched online for a solution, but I could not find any immediate results.
The solution
After some trial and error, I finally found a simple solution that works for me. All I have to do is add the zorder argument with the screen name when I show it and call it inside the script.rpy file. For example:
show screen QuestManager zorder 10
This will show the screen QuestManager on the master layer, and make sure it is in front of any other displayables on the same layer, including the dialogue box. The zorder argument specifies the relative order of displayables within a layer. The higher the zorder value, the closer the displayable is to the front. You can also use negative values for zorder to push displayables further back.
Here is how my screen looks like after using this solution:

As you can see, the dialogue box is no longer visible, and the screen covers the entire screen as I wanted. This solution is super simple and effective and does not require complicated code or changes.
Conclusion
I hope this blog post helps you with your Ren’Py project. If you have faced the same problem as me, or if you have any questions or feedback, feel free to leave a comment below.
Happy coding!
7 notes
·
View notes
Text
Devlog #76
Hi-ho, Wudge here. First of all,
BACK UP YOUR FILES!!!
I’m personally a little past due and am gonna do my back-ups tonight. Y’all, cloud storage and program autosave functions are doing their best to protect our work but failures do happen and in that case, you’ll wanna have your work safely copied and stored away. My work is copied on an SSD card and on google drive, and I try to do it monthly.
Now that that’s over with...
I’ve been very interested in code this past week. For example, I saw a game that had a lower right animation queued with every player click in addition to the textbox CTC, so I spent a few hours looking into how to replicate the effect. I’m pleased to say that it didn’t give me too much trouble, and I recorded a small video of the results. ... Tumblr doesn’t seem to want me to upload the video directly though, so I might have to show that off in a subsequent post.
I also researched ren’py’s use of layers, and determined I was better off sticking with zorder - which I used to move Jade in front of the elevator, so it no longer shuts in her face. I tidied up some of the code and writing within that scene while I was at it, and brainstormed how I wanted the player to feel while they’re getting the tour of Orion - which gave me some good direction in how I wanted the scene to pan out as a whole.
I also spent some time on codeacademy learning how to use dictionaries (still not sure I understand, but getting the hang of it), sketched a bird sprite, added social media placeholder icons to my title screen--

--tadah. And I added a document to my writing portfolio and learned how to make a CG gallery. I was really expecting the CG gallery to put up more of a fight, but there’s a really great template on itch I highly recommend. While I was at it, I tested my “hide default MC CGs” code (it works!) and got started on designing a custom gallery UI. More on that next week, probably.
On a personal note... I’ve been all right. Improving, I suppose, slowly and steadily. Writing about it was a sobering experience that helped me feel less like I’d imagined it all - and self-invalidation is a troubling mindset to have!
@crescencestudio you were very kind, thank you. I am taking my time as best as I can, yes, and I have Alaris downloaded and queued up for when I get a minute. >:)
@hummingbird-games big hugs right back to you, love. I’m so excited for high school daze’s release. <3 <3
Ah... That’s all I can think of for now. Hope I can get that video to work.
... Back up your files.
I hope you’re all staying safe and keeping warm.
Much love,
Wudge.
20 notes
·
View notes
Text
xzoom and yzoom are probably some of the most helpful functions because you can do a lot with them and when you get good at them you can make some lively sprite animations. A slight yzoom increase and decrease essentially mimics the function of a selected character "talking" during a line, then shrinking back down to allow the next character to speak.
I considered using the function zorder in order to establish sprite priority when a character talks (so as to prevent annoying clipping), but seeing as I don't fully understand how it interacts with other functions, I decided to skip it. Admittedly, though, zorder looks a lot smoother than xzoom and yzoom, but how do you use it is the real question. RenPy documentation explain urself
2 notes
·
View notes
Text
6 python libraries to make beautiful maps
At some point any Data Scientist faces the need to analyze or model geo spatial data, and it can’t be done without the crucial visual part. As I’m a huge map-lover, I’m glad to share with you these 6 great libraries for making informative and stylish maps. Some of the libraries I shared here are more suitable for static visualizations, others for interactive ones, so the range of problems they can tackle is wide.
1. Cartopy
Cartopy is a powerful well-known library perfect for plotting static maps with scalar or polygon data. It provides many built-in layers for land, water and administrative borders. It’s really easy-to-use and has an intuitive set of commands.
As an example, let’s try to visualize MODIS data.If you want to follow along, you can find the code here.
To install the package, you can use regular expression with pip:!pip install cartopy
Now let’s load the data:import numpy as np
import matplotlib.pyplot as plt
lats = np.load('lats.npy')
lons = np.load('lons.npy')
data = np.load('data.npy')
After this we can plot the data right away:proj = ccrs.PlateCarree() #let's set the map's projection
fig, ax = plt.subplots(subplot_kw=dict(projection=proj), figsize=(10, 20))#now we need to create a figure with the pre-set projection and a size
ax.set_extent([-160, -105, 40 ,70], crs=ccrs.PlateCarree())#let's limit the coordinates to have only the region of MODIS product
plt.contourf(lons, lats, data,
transform=ccrs.PlateCarree(), cmap = 'summer') #let's add a countor of the data using matplotlib
'''Adding nice cartopy features'''
ax.add_feature(cfeature.BORDERS, edgecolor='black', linewidth=1)
ax.add_feature(cfeature.LAKES, alpha=0.5)
ax.add_feature(cfeature.LAND)
ax.add_feature(cfeature.COASTLINE, edgecolor='black', linewidth=1)
ax.add_feature(cartopy.feature.RIVERS, edgecolor='blue', linewidth=0.5)
states_provinces = cfeature.NaturalEarthFeature(
category='cultural', name='admin_1_states_provinces',
scale='10m', facecolor='none')
ax.add_feature(states_provinces, edgecolor='black', zorder=10, linestyle = '-', linewidth=0.5)
ax.gridlines(draw_labels=True)#formating the grid
As you can judge from the result, cartopy provides a great abundance of ways to customize your map, as you can manually set colors, linewidth, density and other parameters of your layers. Additionally, the code itself is really intuitive and easy to understand.
Cartopy is one of the tools I regularly use in my work, and I hope that you’ll find it extremely helpful as well!
2. Folium
Now let’s add the world’s countries. To do that I’ll use the defualt geopandas dataframe:import geopandas as gpd
df = gpd.read_file(gpd.datasets.get_path('naturalearth_lowres'))
map = folium.Map(zoom_start=4, tiles="Cartodb Positron")
gdf_json = df.to_json()
3. Plotly
Plotly is another famous library known for its beautiful interactive charts. Among many features, it has several functions to plot maps, such as px.choropleth, px.choropleth_mapbox, px.scatter_mapbox, px.scatter_geo and some others. You can find more details here.
As a demonstration let’s plot the same geo pandas dataset, but this time visualizing gdp_md_est variable. It can be done very easily within the following lines:import plotly.express as px
4. ipyleaflet
The fourth library I want to show you is ipyleaflet.It’s another great JS-based library for interactive mapping. One of my favorite things about this package is the amount of tiles it has. So let’s start with the basic one:from ipyleaflet import Map
You can play around with other options, there are literally dozens of them!
Now let’s plot some real world data. One of the most impressive features of the library I found is Velocity visualization. For this purpose, we can use NCEP(WMC) forecast data, which has 1° resolution. The dataset is acquired for 2016–04–30 06:00 and was provided in the docs of the ipyleaflet library. To read it we will use xarray, which is perfect to read netCDF4 files.from ipyleaflet.velocity import Velocity
import xarray as xr
import os
import requests
if not os.path.exists('wind-global.nc'):
url = 'https://github.com/benbovy/xvelmap/raw/master/notebooks/wind-global.nc'
r = requests.get(url)
wind_data = r.content
with open('wind-global.nc', 'wb') as f:
f.write(wind_data)
m = Map(center=(45, 2), zoom=4, interpolation='nearest', basemap=basemaps.CartoDB.DarkMatter)
ds = xr.open_dataset('wind-global.nc')
wind = Velocity(data=ds,
zonal_speed='u_wind',
meridional_speed='v_wind',
latitude_dimension='lat',
longitude_dimension='lon',
velocity_scale=0.01,
max_velocity=20)
m.add(wind)
As you can see the output is not simply an interactive map, it’s an animated one. So it definitely enhances data representativeness and makes your data speak!
5. geemap
Geemap is a package for interactive mapping integrated with Google Earth Engine. So obviously it’s really convenient when your’re working with python ee library, which is python GEE package.
As a demonstration, let’s collect land cover data from Dynamic World product for an island in the Northern Europe:import ee
radius = 1250
point=ee.Geometry.Point([19.9, 60.2])
roi = point.buffer(radius) #setting a circle around the point of interest
DW = ee.ImageCollection("GOOGLE/DYNAMICWORLD/V1")\
.filterDate(start = '2022-07-08', end='2022-08-30')\
.filterBounds(roi) #getting the data
DW_list = DW.toList(DW.size()) #converting the data to GEE List
Now we can do the plotting:m = geemap.Map(center=[60.2, 19.9], zoom=14)
I’d say that geemap is a really great tool to work with GEE. It has tons of different function, which can solve a solid range of tasks. The main and only disadvantage is it’s not super user-friendly. You need to know ee library syntaxis and have a general understanding of how GEE works before using geemap.
6. ridgemap
This library is the last and truly my favorite one, since it allows to make truly unique plots, which are pieces of art.
Before plotting, let’s install two libs:!pip install ridge_map mplcyberpunk
Now let’s create a map:import matplotlib.pyplot as plt
from ridge_map import FontManager, RidgeMap
import ridge_map as rm
import mplcyberpunk
import matplotlib.font_manager as fm
plt.style.use("cyberpunk")
plt.rcParams["figure.figsize"] = (16,9)
fm = FontManager('https://github.com/google/fonts/blob/main/ofl/arbutusslab/ArbutusSlab-Regular.ttf?raw=true')
r = RidgeMap(bbox=(-15, 32, 45,90), font=fm.prop) #creating a map
values =r.get_elevation_data(num_lines=200) #getting elevation data
values = r.preprocess(values=values, #setting hypoparameters
water_ntile=70,
vertical_ratio=40,
lake_flatness=3)
From my point of view, this is awesome! You can check out the library, find a plenty of other visualizations and post your own:)
Hopefully you’ll find these libraries helpful and worth including in your toolbox.
0 notes
Text
Sort Illustrator layers alphabetically
target "Illustrator"
/**
*sort layers (with sublayer)
*/
var doc = app.documents[0];
var lay = doc.layers;
var array_primary = [];
for (var i=0, iL=lay.length; i < iL ; i++) { if (lay[i].layers.length === 0) { array_primary.push( lay[i].name ); } else { array_primary.push( lay[i].name ); var array_secondary = []; for (var j=0, jL=lay[i].layers.length; j < jL ; j++) { array_secondary.push(lay[i].layers[j].name); }; var result2 = array_secondary.sort( function (a,b) { return a > b });
// sort sublayers
sort_layer (lay[i], result2);
}
};
var result1 = array_primary.sort( function(a,b) { return a > b } );
// sort layers
sort_layer (doc, result1);
function sort_layer (obj, array) {
for (var ri=0, riL=array.length; ri < riL ; ri++) {
obj.layers.getByName(array[ri]).zOrder( ZOrderMethod.SENDTOBACK );
};
}
#javascript#illustrator#illustrator scripts#scripts#script#adobe scripts#illustrator javascript#java#alphabetically#sort layer#sort layers#layers illustrator#layers#sort#order
0 notes
Photo

I have finally understood the concepts of ZDepth Sorting in Construct. These are the steps to follow to make a functioning ZDepth prototype.
1. Create a bunch of objects that needs to have ZDepth. They should all be on the same layer, else this wont work. In the animated gif above, the trees, and the car are the objects that will have ZDepth
2. Create a Family of those object you want to have ZDepth.
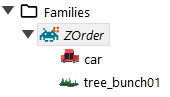
3. Assign a instance variable to the family.
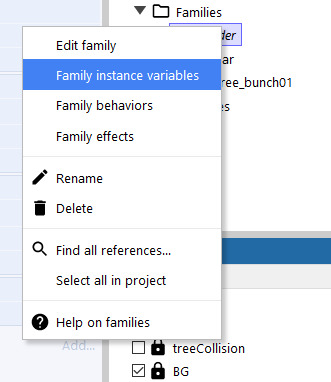
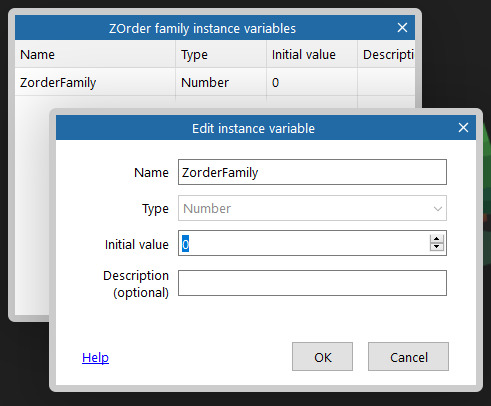
This variable has a value of 0. In the example above- the instance variable is called ZorderFamily.
4. Instruct the game system to check if the objects from that family are on-screen. If they are on-screen, assign their current Y value o the their instant variable.

5. If they are still on-screen, tell the game system to sort all objects in that family, that are on-screen by their new Y value.

----------------------------------------------------------------------------------------------
Refer: https://devilsworkshop.tumblr.com/post/176223060971/with-some-unconditional-help-from-a-construct3
#construct3#gameprototype#game project#Game Assets#low poly#car#tree#programming#prototype#zdepth#zorder#events#behavior#itchio#itch.io#side scrolling#sidescroller#gamedev#indiedev#scirra#construct 3#madeinconstruct#Visual Programming
2 notes
·
View notes
Photo

#zorder#silver sabara#sabara#space battleship yamato 2202#white comet empire#gatlantis#fanart#not by me#space battleship yamato
17 notes
·
View notes
Photo

#jerri blank#jerriblank#geraldine antonia blank#strangerswithcandy#strangers with candy#dr. zorders#finding a vein#diabetes#diabetic#jerrisburningissue
29 notes
·
View notes
Text
Ren'Py: Cleaned up the glossary code for Your Dry Delight
Events
We have several activities planned for this week!
First community event of the year, happening on Friday! The event takes place in Discord, and more information will be released throughout the week in #events. Just know that the activity will be a collaborative artwork created over the course of 24 hours!
Saturday @ 0730PST/1030EST we have our weekly dev stream
Saturday @ 1700PST/2000EST we will have a game stream. We’ll be posting a list of games to play, and you can cast votes for what order to play them in.
Your Dry Delight glossary
The YDD glossary code was initially an ugly hack that used different screens for when you clicked on a word from the dialogue and when you looked it up in the glossary. While it worked, it was not pretty.
It was especially bad when we went to get YDD translated. To get that working, we had to append _language to every screen, make sure the translator knows how to add the _language to the translations, and duplicate the screen. If the translator wanted to add or remove words, then that would require adding extra conditionals to the sidebar with the list of words to ensure the wrong words in the wrong languages didn’t get all mixed up. The end result was 2 large glossary files per language that was difficult to debug for typos or strange behavior.
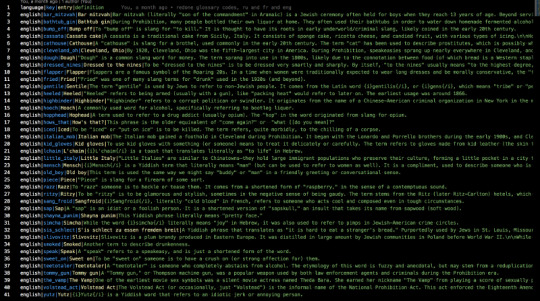
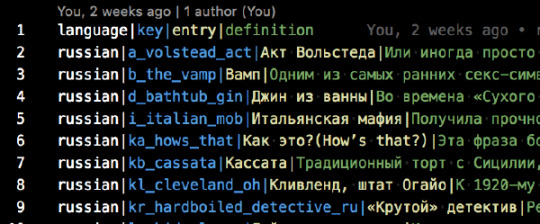
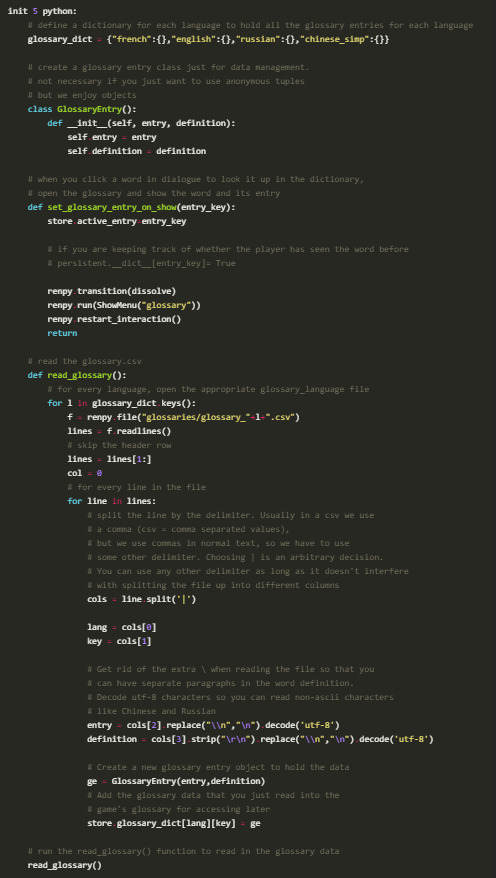
With the most recent language update, we decided to redo the glossary code to make it easier for future translations and just generally adding entries to a glossary (DMR’s glossary will be updated too). The glossary data is all stored in an external csv-like file, and then at the start of the game, we read the file and dynaimcally generate the glossary. For each language, we create a glossary.csv file. It has columns: language, key, entry, and definition. Language is unnecessary now, but it was originally created to have all the glossaries for every language combined into a single file. The key is for programming purposes; spaces are one of the greatest evils for coding, so we need a version of the word without any spaces (e.g. kid_gloves for “Kid gloves”). The key is also used to determine the order of the entries in-game. The word list is alphabetically ordered, so if there is a particular order that another language wants their words in, they can easily adjust that. The entry is the word to look up in the glossary, and the definition is the word’s (or phrase’s) meaning.
The code for reading in the glossary:
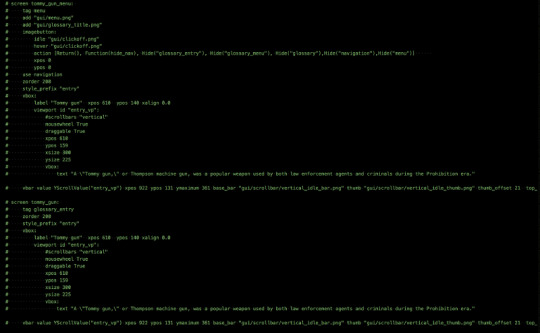
The Ren’Py screen code for actually accessing the glossary in-game:
screen glossary():
# This is the glossary that is accessible via the side menu
zorder 199
modal True
tag menu
if main_menu:
add "gui/mainmenu.jpg"
# this is the definition of the word once selected
use glossary_single
# this is the navigation containing all the words that you can open
use glossary_menu
# set the glossary scrollbar so that when you switch between words, the scrollbar
# resets to the top of the definition
default glosssary_scroll_value = ui.adjustment()
screen glossary_single():
# the screen with the info after someone clicks a word to show the definition
add "gui/menu.png"
add "gui/glossary_title.png"
imagebutton:
idle "gui/clickoff.png"
hover "gui/clickoff.png"
action [Return(), Function(hide_nav), Hide("glossary_single"), Hide("glossary_menu"), Hide("glossary"),Hide("navigation"),Hide("menu")] xpos 0
ypos 0
modal False
# if the glossary has just been opened, then we don't want to display an entry's information
if store.entry_data is None:
$ store.entry_data = ""
if store.entry_definition is None:
$ store.entry_definition = ""
tag menu
zorder 200
style_prefix "entry"
vbox:
ysize 320
# the entry that was clicked on
label store.entry_data xpos 610 ypos 140 xalign 0.0 xsize 300
viewport id "entry_vp":
mousewheel True
draggable True
xpos 610
ypos 159
xsize 300
yadjustment glosssary_scroll_value
# the definition of the entry that was clicked text store.entry_definition
vbar value YScrollValue("entry_vp") xpos 922 ypos 131 ymaximum 361 base_bar "gui/scrollbar/vertical_idle_bar.png" thumb "gui/scrollbar/vertical_idle_thumb.png" thumb_offset 21 top_gutter 25 bottom_gutter 15 right_gutter 20 left_gutter 10 xsize 42 use navigation
screen glossary_menu():
zorder 205
# when we first open up the glossary, we don't want an entry to already be showing
$ store.active_entry = None
# make sure we open the english dictionary entries if we are in english
if _preferences.language is None: $ entry_lang = "english"
else:
$ entry_lang = _preferences.language
# if the player has selected an entry, then we should update the screen
# to display the information for the selected entry if store.active_entry is not None:
$ store.entry_data = glossary_dict[entry_lang][store.active_entry].entry
$ store.entry_definition = glossary_dict[entry_lang][store.active_entry].definition $ glossary_keys_sorted = sorted(glossary_dict[entry_lang].keys())
$ lang_dict = glossary_dict[entry_lang]
vbox:
xpos 318
ypos 140
xsize 210
ysize 346
spacing 23
viewport id "g_list":
mousewheel True
draggable True
vbox:
style "list_text"
spacing 13
# dynamically create the list of words in the glossary
for k in glossary_keys_sorted:
$ v = lang_dict[k]
textbutton v.entry action [SetVariable("store.active_entry",k),\ SetVariable("store.entry_definition",v.definition),\ SetVariable("store.entry_data",v.entry),\ Function(glosssary_scroll_value.change,0)] text_color "#262118" text_size 24 text_hover_underline True text_selected_idle_underline True text_idle_underline False # textbutton glossary_dict[key].name action [SetVariable("store.active_entry",key),SetScreenVariable("entry_definition",glossary_dict[key].name),SetScreenVariable("entry_data",glossary_dict[key].entry)] text_idle_color "#1d1818" text_selected_idle_color "#818181" text_hover_color "#818181"
Questions or Comments?
Feel free to send in any AG-related questions! Our Ask Box is always open.
Q: This may be too early to ask but for the potential new VN competition idea, would you all consider only people with experience and with a finished script or would it be open to people with a concept and at least an outline as well?
A: If you have a concept and an outline, and you can provide evidence that you are able to see the project through and complete the script, then you would be a good fit for applying to the competition. There will be more information on the specifics and details required from outlines, as well as general specs for designs (max number of characters, backgrounds, etc.)!
Thanks so much for all of your amazing support, and stay safe out there!
JOIN ARGENT GAMES ON:
AG Twitter | Discord | Patreon
17 notes
·
View notes
Text
Dashboard is Broken
good job you bitch idiot shmucks @staff the dash now opens reblog by hiding them under the zorder of the dashboard and you can’t write anything or not reblog the post
jfc nobody who has become a webdev in the last ten years has done anything except shove increasingly stupid gimmicks onto web pages in a desperate attempt to protect their job. you useless fuckers realized that once all media could be displayed in browser there would never be a need to develop further, so you created a bunch of bullshit standards and styles etc to justify your existence.
“My new application for the-”
you made a fucking website; it’s not an application, it’s an information display. treating web pages like apps is why this website is broken as fuck, why all of them are bloated messes of HTML5 doodads and bullshit
1 note
·
View note
Video
Elevation is coming along really well! I think all that’s left is tile art, waterfalls, and getting the Zorder to sort correctly. Art will probably be my first task as I’ve been wanting to draw for a while. That means yet another new grass tile!!!! (hopefully my last for a while). If im being honest, I havent given much thought as to the best way to add waterfalls, but I think it should be pretty simple given my new terrain editor. Zorder on the other hand should be no issue at all as I think ive solved this issue before, I just need to figure out where the solution is buried.
1 note
·
View note
Text
lasso regression

import math
import matplotlib.pyplot as plt
import pandas as pd
import numpy as np
from sklearn.linear_model import Lasso
from sklearn.linear_model import LinearRegression
from sklearn.datasets import load_breast_cancer
from sklearn.cross_validation import train_test_split
cancer = load_breast_cancer()
#print cancer.keys()
cancer_df = pd.DataFrame(cancer.data, columns=cancer.feature_names)
#print cancer_df.head(3)
X = cancer.data
Y = cancer.target
X_train,X_test,y_train,y_test=train_test_split(X,Y, test_size=0.3, random_state=31)
lasso = Lasso()
lasso.fit(X_train,y_train)
train_score=lasso.score(X_train,y_train)
test_score=lasso.score(X_test,y_test)
coeff_used = np.sum(lasso.coef_!=0)
print ("training score:", train_score )
print ("test score: ", test_score)
print ("number of features used: ", coeff_used)
lasso001 = Lasso(alpha=0.01, max_iter=10e5)
lasso001.fit(X_train,y_train)
train_score001=lasso001.score(X_train,y_train)
test_score001=lasso001.score(X_test,y_test)
coeff_used001 = np.sum(lasso001.coef_!=0)
print ("training score for alpha=0.01:", train_score001)
print ("test score for alpha =0.01: ", test_score001)
print ("number of features used: for alpha =0.01:", coeff_used001)
lasso00001 = Lasso(alpha=0.0001, max_iter=10e5)
lasso00001.fit(X_train,y_train)
train_score00001=lasso00001.score(X_train,y_train)
test_score00001=lasso00001.score(X_test,y_test)
coeff_used00001 = np.sum(lasso00001.coef_!=0)
print ("training score for alpha=0.0001:", train_score00001 )
print ("test score for alpha =0.0001: ", test_score00001)
print ("number of features used: for alpha =0.0001:", coeff_used00001)
plt.subplot(1,2,1)
plt.plot(lasso.coef_,alpha=0.7,linestyle='none',marker='*',markersize=5,color='red',label=r'Lasso; $\alpha = 1$',zorder=7) # alpha here is for transparency
plt.plot(lasso001.coef_,alpha=0.5,linestyle='none',marker='d',markersize=6,color='blue',label=r'Lasso; $\alpha = 0.01$') # alpha here is for transparency
plt.xlabel('Coefficient Index',fontsize=16)
plt.ylabel('Coefficient Magnitude',fontsize=16)
plt.legend(fontsize=13,loc=4)
plt.subplot(1,2,2)
plt.plot(lasso.coef_,alpha=0.7,linestyle='none',marker='*',markersize=5,color='red',label=r'Lasso; $\alpha = 1$',zorder=7) # alpha here is for transparency
plt.plot(lasso001.coef_,alpha=0.5,linestyle='none',marker='d',markersize=6,color='blue',label=r'Lasso; $\alpha = 0.01$') # alpha here is for transparency
plt.plot(lasso00001.coef_,alpha=0.8,linestyle='none',marker='v',markersize=6,color='black',label=r'Lasso; $\alpha = 0.00001$') # alpha here is for transparency
plt.xlabel('Coefficient Index',fontsize=16)
plt.ylabel('Coefficient Magnitude',fontsize=16)
plt.legend(fontsize=13,loc=4)
plt.tight_layout()
plt.show()
OUTPUT
Python 3.7.0 (default, Jun 28 2018, 08:04:48) [MSC v.1912 64 bit (AMD64)]
Type "copyright", "credits" or "license" for more information.
IPython 6.5.0 -- An enhanced Interactive Python.
C:\Users\lenovo\Anaconda3\lib\site-packages\sklearn\cross_validation.py:41: DeprecationWarning: This module was deprecated in version 0.18 in favor of the model_selection module into which all the refactored classes and functions are moved. Also note that the interface of the new CV iterators are different from that of this module. This module will be removed in 0.20.
runfile('C:/Users/lenovo/lasso.py', wdir='C:/Users/lenovo')
Reloaded modules: __mp_main__
training score: 0.5600974529893081
test score: 0.5832244618818156
number of features used: 4
training score for alpha=0.01: 0.7037865778498826
test score for alpha =0.01: 0.6641831577726227
number of features used: for alpha =0.01: 10
training score for alpha=0.0001: 0.7754092006936699
test score for alpha =0.0001: 0.7318608210757909
number of features used: for alpha =0.0001: 22
0 notes
Text


When did the Martians declare war on humans? 😱
⠀
In the 1950s, astronomers discovered a strange mark on Mars, resembling a giant letter M.
⠀
Opinions of scientists split into 2 camps:
1. We thought that the Martians give a signal, they are ready for contact, and the letter M means Mars.
2. Predicted war! In fact, M is an inverted W, which means War in English.
Even then, the popularity of the English language reached the Martians and they changed their native dialect to the speech of foggy Albion.
⠀
But the earthlings did not manage to arm themselves in the galactic slaughter, the letter mysteriously disappeared.
The sandstorm on Mars created an illusion. They circled on the surface around the tops of 4 volcanoes, the peaks of which formed in the likeness of a letter.
⠀
In the photo, see the mysterious signs on the surface of Mars
⠀
And in 2018, the supreme ruler of the red planet Zoog Zorder started a war for real. He did not warn about his plans. The earth was in danger ... ⚔️🌍
⠀
Do you think the Martians know English? 😉
0 notes
Text
New power Rangers Reboot is not bad but it is not that great either.
now I do like the beginning of the film with zorder as the Red Ranger and i do like the idea of the groups that has flaw in their personality but the fact that film didn't trying hard enough make Jason's Teams seem more human-ism ....well least to me its bug me little bit and they mess up rita badly and i really don't like that make her former green ranger that betrayed zorder & his teams and i hated they played whole she man-eating and an obsessive with Gold stuff (even she ate one from the store!) And I will add more it later tonight.
1 note
·
View note
Last Seen Blogs
shvggot
shaggy (IGNACIO's Husband fr)

larry-the-guy11
Bi And 25

freekicks
fucking yikes.

malwen-sosialaidd
Change will not come from above

nightshades-deadly-heart
Nightshade