#…relative to where they think it should be; those are two different assessments polled in one question
Text
a post about the Democratic primary, which I did not enjoy writing
I haven’t talked about the Democratic primary here for a couple of reasons. I think that wrapping our minds about what Trump is doing in power – and what he and his backers did to get him that power – is a lot more important than any campaign tactic his eventual Democratic opponent can use, or even who the Democratic candidate is. I don’t even know who I’ll be voting for myself.
What I do know is that above all other issues, I’ll be voting on democratic values. That includes more conventional voting rights and election integrity issues that we’re used to discussing in American politics. It’s also about pounding the brakes on democratic backsliding at home, and giving institutional and moral support to people around the world who want the same. If we make enough progress on this issue, we can make enormous strides on other progressive priorities. If we don’t turn back this authoritarian tide, we will lose on everything else.
And on my #1 issue, I’ve developed serious concerns about Senator Bernie Sanders.
This is a long post because it’s an attempt to articulate an uncomfortable pattern which requires a lot of context, but I hope you’ll take the time to read it, so let me assure you of a few things it’s not:
Concerns about Sanders seem to be collapsed into “is he as extreme and irrational a leftist as Trump is a right-winger” or “is he too kooky to win an election.” I’m not doing either of those. There is an argument out there that Sanders is too far to the left on policy. I’m … really not the person to do that argument justice. There’s an argument that, whether or not you like his policies, he would have a harder time winning a national election in a year that Democrats cannot afford any more disadvantages. I think this election really is going to be won or lost by the voters choosing to accept or reject Trumpistani autocracy, but it’s entirely responsible to consider that kind of thing. I have a substantive concern about Bernie Sanders, not because I oppose progressives but because I am a progressive, and I don’t pretend to have any insight into how it might affect his chances of winning a general election.
I don’t care a whole lot about what Senator Sanders feels in his heart or whatever. I tend to think this is more about being misguided than malicious, but that’s not make or break for the pattern I’m trying to describe.
I’m not trying to endorse someone else by process of elimination; like I said, I haven’t decided yet who I’m voting for myself.
I’m old enough to remember four years ago when only a few nerds had ever heard of superdelegates. Superdelegates, or unpledged delegates, are party activists and officials who get to vote at the convention along with the pledged delegates who are assigned in the state primary contests. They’re the backup plan put in place after the clusterfuck of 1968. We also got better at avoiding clusterfucks after 1968, so they weren’t an issue. Until 2016, when Sanders decided they were an issue for him because he was going to lose the old-fashioned way, and “superdelegates” were a convenient boogeyman he could use to turn progressives against the Democratic party. Then his campaign successfully talked itself into believing that this conspiracy theory about superdelegates going against the voters, so they started arguing that the superdelegates should take the nomination away from the winner and give it to him. This was always a pipe dream, but it did inspire Sanders supporters to dox a bunch of counterrevolutionary elected officials and progressive activists. Remember, he’s a member of the Senate Democratic caucus, so he’s talking all this shit as a superdelegate.

The sore losering only helped Donald Trump and his Russian backers, but it was delegitimizing enough that the Democratic National Committee felt pressured to revamp the presidential nomination process. Thus, a “unity” committee was formed to placate the feelings of those who were implacably infuriated that the person with the most votes had won the nomination. (The Republicans, whose party processes had allowed an unqualified, unstable, ideologically unreliable foreign asset to take over, made no such alterations.) The big concession on superdelegates is that they don’t vote on the first ballot. If someone wins a majority, then they win the nomination. If nobody gets a majority, then there’s a second vote where the pledged delegates are released and the superdelegates also get a say.
Presumably because pro-Sanders activists were so instrumental in drafting the new rules, they were all set to start gaming those rules before voting began. In early January, when it was assumed that former Vice President Biden would win more delegates than anyone else but come up short of a majority, groups supporting Sanders floated the idea that Warren’s delegates should be ready to join Sanders, or vice versa. The reasoning was that a vote for Warren or Sanders should be considered a vote for what they considered the relatively progressive wing of the Democratic party, and therefore pooling the two candidate’s votes together would represent the will of the electorate. Six weeks later, with Sanders having eked out a plurality in a few early states – more delegates than anyone else, but nowhere near a majority, and losing the popular vote – he’s out here warning that it would be very, very bad for everybody if the person who wins the plurality isn’t guaranteed to win the nomination. If 66% of voters split between two “establishment” candidates, well, that 34% who voted for the “anti-establishment” Sanders better get their way, or the party gets it!1
Sanders representatives also insisted states be allowed to keep holding undemocratic caucuses – until he was outplayed in the Iowa delegate count, at which point they realized the establishment $hills had been right about voter suppression being bad.
Look, real talk, small-d democracy is about trying to do what the voters want. If Sanders stays exactly where he is in the polls – winning a plurality of delegates with only about 1/3 of the voters – he will be getting a lot less support than he did in 2016. When he lost by a whopping 12-point margin, despite being propped up by the Kremlin, the Koch brothers, and thousands of years of patriarchy. If these trends hold (and they might not!) Democratic voters, who are the voters most likely to support his policies, do not want him. So – and I’m editorializing a little bit in this final assessment – spare me.
America is a big country and the Democratic Party is a broad coalition. There are going to be good arguments for and against a lot of different ways to pick a presidential nominee, but a key part of doing it as fairly as possible is to choose the rules beforehand and then stick to them. Campaigns making the best case for their candidate isn’t a bad thing, and a politician being able to change their mind is a good thing. But Sanders whips his supporters up with sweeping claims about the legitimacy of the process – until the opposite claim looks like it might be advantageous to him, at which point his campaign completely reverses itself on whether or not the rules of the election are fair. This is not acceptable. We cannot be playing this game when we are trying to defend the legitimacy of democracy itself against the most powerful person in the world.
On its own, I’d find that frustrating. But once a frustration starts overlapping with a genuine national security issue, it stops being a frustration and starts being a serious concern.
Senator Sanders was informed a month before the Nevada caucuses that the Russian government was supporting his campaign. Again. We still don’t know what kind of support they were giving him, though it’s probably more or less what they were doing in 2016 – pushing propaganda and making it harder for people to have productive discussions about the primary. He didn’t say anything about it, except to obliquely reference Russian trolls when he was challenged on the debate stage about some of his supporters being abusive online. (We’ll come back to that one.)
When this story broke, as it clearly would, Sanders reacted by attacking the newspaper. He claimed that the briefing his campaign received was classified, which a) it is unlikely to have been properly classified, which he would’ve known if he’d tried to work out a way to go public and b) didn’t stop him from using some of that information to his advantage during a debate. His campaign went around crowing about these great victories where he squeaked out pluralities knowing that those victories were tainted by a foreign government helping him and/or sabotaging his competitors. (Meanwhile, these competitors were not even told that they were at risk.)
He responded similarly to the Russian support he received in 2016. He failed to educate his supporters about the seriousness of the attack as it was happening. When asked later, he begrudgingly admitted to having known about it, falsely claimed to have tried to alert the Clinton campaign, and attempted to deflect criticism by literally blaming the victim. Admitting that he lost despite benefiting from the criminal sabotage of his opponent, rather than because he was the victim of some nefarious party establishment conspiracy, would have damaged the story he tells voters and been a blow to his ego.
Because he chose to deflect rather than face the issue, he has never dealt with the ways that the ways that the Russian attack probably did poison his movement. Nobody else has really wanted to deal with it either, so I’ll stipulate that this is my opinion, but I think it makes sense.
There is a qualitative difference between what Sanders tries to communicate to people and what his supporters do in response. I do not believe that Sanders wanted his supporters to vote for Trump, stay home, or discourage others from voting in 2016. I do not believe he wanted progressive organizers to be inundated with death threats. I do not think he wants people like anti-racist filmmaker Ava DuVernay or Parkland parent Fred Guttenberg to be swarmed with abuse online. I sincerely believe that if you hooked Sanders up to a lie detector, he would say that’s bad stuff and he doesn’t want any of it, and I am not inclined to be overly generous to Senator Sanders.
And yet it keeps happening, and it can’t just be blamed on Russian bots. Real people physically showed up in Philadelphia to heckle speakers at the convention in 2016. Abusive phone calls to perceived establishment enemies of Sanders really do slow down after he explicitly says he doesn’t want people to do that – which means that he dissuaded real people, who started down that ugly path because they thought it was what he wanted. There is an observable mismatch between what is being said and what is being heard. Something is jamming the signal.
Jamming the signal, incidentally, requires exactly the kind of stuff that troll farms do best. Post “edgy” guillotine memes and see who bites. Flood brutal criticism of mainstream Democrats with applause. When ostensible leftists use their independent platforms to spread disinformation or even just nastiness, toss a few coins in their Patreon – they don’t have to know they’re working for you, they just have to learn that pushing the envelope is profitable. Shout down even mild criticism by spamming it with garbage, so that skeptics withdraw or become defensive, while supporters internalize the idea that abuse is an acceptable response to dissent. Work hard enough to desensitize a campaign to that kind of behavior, and you might even get it to put a bunch of spiteful trolls in charge.
This is a theory, but I think it is the most likely theory. I certainly think it’s more persuasive than the alternatives, which are “those intelligence and disinformation professionals have spent the last few years shouting into the void and having no discernible effects on target populations, and also, all these people who say they’ve been hit with the exact type of toxicity that disinformation effort seems designed to provoke are actually all hallucinating and/or lying because the unbelievers of The Establishment(TM) are all conspiring to take Bernie down” and “this Russia thing is a fake news Democrat deep state witch hunt.”
I’m not saying I think Bernie Sanders is a Russian asset. I’m saying that the Russians seem to think he’s an asset to them.
The Sanders campaign has a complicated problem on its hands, and I don’t know what they should do about it. But it isn’t enough for Sanders to say “I don’t care who Putin is supporting.” It is his job as a United States senator who swore an oath to protect and defend the constitution to care about who Putin is supporting. It is his job as a presidential candidate to care enough to ask why Putin is supporting him. Even if he doesn’t care morally, he has to care politically, because plenty of voters care, and if he can’t give us an explanation we’re going to start trying to figure it out for ourselves.
Which makes it time to stop ducking the ugly question: why is Senator Sanders useful to people who are against everything he stands for?
Maybe, as the press and the Bloomberg campaign seem to think, whoever’s designing this strategy thinks Sanders is the most likely to lose to Trump, so of course they prefer him over the stronger competition. I hope they’re right. It would certainly be comforting to think that Trump’s Russian backers think we’re going to have a free and fair election based on how voters feel about the nominees, because it would mean they’re not relying on their ability to hack state boards of elections. And it would be comforting because the other possibilities get pretty depressing. Unfortunately, the Kremlin whisperers putting out this comforting explanation were also quite certain that the Russian government was just trying to cause chaos and didn’t have a preferred candidate in 2016 (they did), the Russian government only supported Trump because they hated Hillary Clinton (she’s not running and they’re still at it), that the propaganda campaign couldn’t have had an impact (it did), that the Russian government would never have attacked actual voting infrastructure because norms or whatever (lol) …. the mind-readers turn out to be big on the wishful thinking, is what I’m saying here.
Maybe it’s just a narrow convergence of policy. Sanders was one of only a small handful of legislators who voted against the Magnitsky sanctions that the Russian government is desperate to overturn. He failed to support further sanctions on Russia for the 2016 election interference – again, interference which helped his campaign. He’s called for neutralizing NATO against Russian aggression by letting Russia join. From the Russian government’s perspective, that’s as good as destroying it like Trump has been trying to help them do. Maybe those things are enough. I think those are bad positions and he should have to explain them. But he seems less committed to those things than Trump, who’s spent three years failing to deliver.
If four years of the Trump show have taught us anything, it’s that you can’t just write off the tinfoil hat conspiracy stuff; you have to acknowledge it and explain why it’s unlikely. So yes, it is theoretically possible that Russian intelligence believes they have some leverage over Sanders, either to manipulate him or to kneecap him at a moment they think is most advantageous to Trump. That doesn’t mean Senator Sanders has done anything wrong. It just means that there’s a bit of footage from when he visited the Soviet Union back in the day, and they might think they can use it to make a damaging deep fake. Personally, I think that’s pretty unlikely to be the motive here, because the cost-benefit analysis seems pretty thin, but we’re just trying to take a clear-eyed inventory about what’s possible.
A few hours after the Post broke the news about the Russian efforts to help him, his official Twitter account posted this:

I've got news for the Republican establishment. I've got news for the Democratic establishment. They can't stop us.
If you’ve been paying a bit of attention to Sanders you’re probably not too startled by that comment, which is exactly the problem. In a few short words, it boosts some of the most insidious narratives that pro-Trump propagandists have also been pushing over the past few years. It’s framed as a belligerent defiance of “party establishments” - AKA, those same American institutions that we know our adversaries want to destroy. It sets up a nihilistic false equivalence between the Democratic and Republican parties. In this little story, it’s Sanders up against shadowy forces and their conspiracy against him – he’s the real victim here, but also the center of the universe. (Sound like anyone else the Russian troll farms like?)
This tweet may or may not have been in direct response to the Washington Post’s breaking the story about Russian intelligence helping his campaign again, but the timing sure looks like a great American newspaper was being lumped in with the big, spooky “establishment” trying to “stop” Sanders. (A week and a half later, he’s still sore at the Post about something.) That, too, would fit a disturbing pattern of Sanders world’s relationship with critical press, or even with criticism in general. While all this was going on, there was a Daily Beast story about the kind of alarming behavior that seems to keep happening in pro-Sanders circles. A low-level staffer was running a gross Twitter feed that reflected badly on the campaign. The campaign responded to the story by taking out the trash, but supporters responded to the story by swarming the reporter and sharing pictures of his home address. This wasn’t surprising. If you dip into Democratic-leaning podcasts or cable news shows, it’s really common to hear people preface any criticism of Sanders with a semi-jokey “don’t yell at me on Twitter, guys!” or respond to someone else’s criticism with a rueful “RIP your menchies [Twitter inbox].” Journalists and political commentators know to expect disproportionate retribution when they criticize the Dear Leader. (Sound like anyone else the Russian troll farms like?)
Maybe you’re the kind of person who likes to give the benefit of the doubt. Couldn’t all that be #ActuallyAboutEthicsInJournalism? I suppose a good test would be: what’s the response to negative feedback from a group of people, not just an individual who can be intimidated? And the answer is: conspiracy! Paid Protesters! Fake news, folks! That is not progressive, it is not healthy for our politics, and it’s exactly the kind of behavior that autocratic regimes around the world are always trying to normalize. Democrats, and all other small-d democrats, cannot start rewarding it.
That’s the context for this: Sanders has a long track record of defending authoritarian governments which call themselves socialist, communist, or otherwise leftist. Of course, authoritarian governments are more like gangster kleptocracies than “socialism” as Sanders sees it, but he just keeps rejecting opportunities to walk it back.
Too many progressive commentators with platforms have shrugged this off as some kooky Cold War thing that the media is blowing out of proportion, but it’s not just uptight Wall Street Journal opinion writers pushing back. A lot of Americans are Americans because their families ran for their lives from exactly these regimes. Five years of Latin American immigrants being Donald Trump’s favorite target, now we’re going to make people who fled Castro’s Cuba or Chavez’s Venezuela eat this shit sandwich? Mayor Pete Buttigieg was the first openly gay person running for the US presidency; was he supposed to add a bit in his stump speech about whether a dubious “literacy program” would help him in a concentration camp? The world is a complicated place where American leaders have to make hard decisions and don’t always get to work with nice people. That’s no excuse to be casual about rubbing salt in raw wounds.
I haven’t spent the past three years angry that Donald Trump fluffs up dictators because I’m looking for excuses to hate Donald Trump. Really, I’m good there. I’m angry about it because democracies are good and dictatorships are bad. When the American president is clear on that point, it really can make the lift just a little bit lighter for activists and freedom fighters and oppressed people doing the hard work of citizenship all over the world; when the American president fails to speak that truth, their work gets a little bit harder. I think their work is hard enough already.
You know that cliché about “Mussolini made the trains run on time”? It’s fascist propaganda. “Sure he locked up dissidents and inspired Hitler, but Infrastructure Week was a real success!” And he fucking didn’t even, because of course he didn’t, he was busy murdering everyone who could burst his narcissistic bubble. The Italian fascist regime polished up a few tourist-friendly routes and boasted to privileged visitors about how the trains were running on time. Then those visitors would go home with an innocuous sound bite to sanitize a brutal regime. Look, Prince Mohammad is letting women drive [and imprisoning the activists who made that a winning issue for him]! Sure, Putin is a heavy-handed old KGB guy, but he’s cracking down on corruption [as an excuse to imprison critics]. I’m not defending Castro, but hey, literacy program. Look, I’ve been to the Soviet Union, the bread lines didn’t look too bad on my guided tour!
Maybe the big money donors behind this Russian intelligence super PAC think Sanders will be susceptible to manipulation by their authoritarian regime because he keeps saying that he’s susceptible to manipulation by authoritarian regimes.
When someone seeking the United States presidency says that? Believe them.
I’m not saying Sanders is an aspiring dictator like Trump. I mean, I could be wrong, but that’s not my concern. A lot of politics is made up of civic habits. If we validate these tactics, we make bad habits that soften us up for a smart, focused Trump to come along in four or eight years. We can’t afford leadership that doesn’t understand, on a gut level, why those bad habits are dangerous.2
I’m not saying he’s the only flawed candidate on this issue, but he troubles me more than any candidate with even a slim path to the nomination. Representative Tulsi Gabbard is an exponentially more dangerous character – or at least she would be, if she somehow pulled ahead of “none of the above.” I have serious issues with former NYC mayor Mike Bloomberg; I’m less concerned about those issues because people can criticize Bloomberg without anyone mocking them for having been raped.
Because I think democracy is the most important issue on the ballot, I’m not going to mislead you with false equivalence. Sanders would not be as bad on Trump on these issues. He would not be stacking the courts with right-wing judges who are overtly hostile to voting rights, he doesn’t stand to rake in cash by cozying up to autocratic regimes, and an administration which pays lip service to democratic values is preferable to an administration which is overtly hostile to them. A vote to reduce harm can be cast with a clear conscience. It’s still the primary, though, so we have the chance to cast a general election vote for real improvement rather than damage control.
If I haven’t convinced you of anything, fair enough. If I have convinced you that this pattern is serious enough to consider as you’re voting in this primary … this isn’t one of those posts where I try to wrap up with a concrete suggestion about something you can do, for obvious reasons. I have a suggestion about voting tactically, though. Primary delegates are awarded proportionately to every candidate who makes it over what’s called a viability threshold. Basically, a candidate who gets 15% of the vote wins something like 15% of the state’s delegates, while a candidate who gets 14% gets zero. A vote for someone with 3% support is a vote for whoever wins the state, whether you like that person or not. Check FiveThirtyEight to see which candidates are polling above 15% (preferably above 20% to get outside the margin of error) and then choose your favorite of those candidates.
1A good argument for this particular system is that it gives candidates two chances to prove that they can build a coalition, because that is something Democratic presidents need to do. You can win an outright majority going into the convention, which requires satisfying a lot of diverse groups of people. If nobody can do that, then the convention gives you another shot to show you can win people over. If you have a plurality then you have a head start. If you can’t get from a plurality to a majority, you probably shouldn’t be nominated, because you would be a shitty president.
2The topic of this post is democracy, not politics, so I don’t want to go too far into it, but I do want to shoot down the bullshit counterargument: “oh, blah blah, knife to a gun fight, Democrats are wimpy little girly-men who always play by the rules, Republicans are big strong daddies who understand power, blah blah.” Guys? Guys. You’re not going to out-shitpost the Republicans; they have unlimited money flowing into sophisticated propaganda machines. You’re not going to out-bully the fascists as a means to an end; bullying is the end for them and they have a lot more practice at it than we do. You don’t get into a pissing match with a drunk. IDGAF about sinking to their level, it’s about refusing to fight on their turf. We’re not going to win their game on their terms.
23 notes
·
View notes
Quote
Productivity is a hot-button issue for just about every business. If your organization isn’t productive, how can you realistically expect to grow?
But determining the best way to evaluate productivity and make positive changes is, by no means, simple. In fact, the factors that contribute to productivity are often varied and spread across disparate parts of a business and the world, for that matter.
A 2017 report by Gallup found that only 15 percent of adults with full-time jobs in 155 countries are highly involved in and enthusiastic about their work and their workplace. Two-thirds of working adults with full-time jobs reported that they were putting time into their jobs but not energy or passion because they weren’t engaged.
As the Gallup report pointed out, this consistent disengagement among full-time workers worldwide “is a barrier to creating high-performing cultures” and generally “implies a stunning amount of wasted potential.”
This is particularly evident when comparing divisions, departments, or teams with the highest levels of employee engagement against those with the lowest levels in an organization.
Among the companies Gallup analyzed, the businesses units that scored in the top 25 percent for employee engagement generally saw a number of improvements when compared to their counterparts at the opposite end of the spectrum:
21 percent higher profitability
17 percent higher productivity
20 percent higher sales
10 percent higher customer metrics
41 percent lower absenteeism
59 percent lower turnover in companies with low turnover
24 percent lower turnover in companies with high turnover
70 percent fewer employee safety incidents
58 percent fewer patient safety incidents
Though the percentage of engaged full-time workers varied by region — 6 percent in East Asia, 10 percent in Western Europe, and 33 percent in the United States — the Gallup report identified some common barriers and challenges across the world:
Businesses won’t tap into the full potential of their employees unless performance evaluation systems account for the human need for psychological engagement, such as positive workplace relationships, recognition, personal growth opportunities, and regular, constructive talks about performance.
Business can “dramatically improve workforce productivity” if they have strategies in place that allow employees to develop their innate talents, use these talents on the job, and eventually transform those talents into strengths.
Businesses should have talented managers who can build strong, positive relationships with employees, as well as tap into the talents and goals that keep each person focused.
If businesses want to maximize the strengths of their workers, employers must provide their employees with more input and autonomy to use those strengths.
The potential for increased productivity is often contingent on a business’s ability — or willingness — to tackle existing obstacles and adapt to changes.
Rather than working to achieve higher employee engagement rates, businesses should focus more on carrying out initiatives that will eventually yield the results they want.
On a deeper level, the Gallup report also identified a common yet fundamental issue for companies around the world: an underlying aversion to change.
“In particular, organizations and institutions have often been slow to adapt to the rapid changes produced by the spread of information technology, the globalization of markets for products and labor, the rise of the gig economy, and younger workers’ unique expectations.”
The big-picture path to productivity is fairly straightforward. Improve operations, position employees to work at their best, and leverage modern technologies to eliminate long-standing productivity pain points and automate repetitive tasks.
But the specific pathways toward productivity are much more complicated.
In this guide, we dig into major ideas about productivity and provide tips to help you become more productive. From there, we explore major productivity apps and software to help you get a sense of the technologies that can help your teams get more done.
Improving productivity can help you scale your business and sustain growth over time. But productivity gains are never simple. They require a blend of new ideas, habits, and technologies that come together to change how workers function and help them be more productive.
What is productivity?
In its most basic form, productivity is simply a measurement of a business’s output. This varies from one organization to another as different companies produce different types of assets.
Some companies produce real goods. Others measure productivity by the number of clients they support with their services. Because productivity is a highly varied concept depending on what a business creates, small business owners have to seriously assess their core value points.
In many cases, the final value may just be revenue. In that case, you should measure metrics like revenue generated per employee per hour. Total the number of employees for a given period of time, such as a month. Then add up how many hours they put in during that month and compare it to the revenue generated. By tracking this metric on a month-to-month or quarter-to-quarter basis, you can measure productivity in a consistent, empirical way.
But when considering the question, “What is productivity?” you may have to think about more measurements than hours worked and assets generated. An employee’s ability to produce can be impacted by the following:
Level of focus while working
Time spent on non-productive tasks, such as clerical work done by an employee with a production-focused job
Breaks, travel (even within a large business campus), or natural social interactions within the work environment
Expected productivity during the time worked
Uncontrollable factors — emergencies, client-related interruptions, equipment failure, etc. — that can derail productivity
In theory, all of these factors can be measured. Businesses can use modern digital tools to track operations data, employee time spent on different tasks, and similar types of information to get a more nuanced perspective on productivity.
As you explore more sophisticated ways to look at productivity, here are a few options to consider, all of which are highlighted in an Investopedia report:
360-degree feedback. This productivity measurement tool uses direct feedback from an employee’s coworkers to evaluate that person’s productivity. While this is commonly used as an employee assessment strategy, it can also provide vital insights into productivity by providing you with peer-based analyses of workers that enable you to understand the factors that may influence a person’s productivity.
Sales-focused analysis. Though revenue is most commonly used to assess feedback, you can also use net sales relative to hours worked to evaluate productivity. This can be a great option for organizations with a heavy emphasis on sales as a path to growth.
Time tracking. Tools that track user activity, such as visiting social media sites or using a specific business application, can be extremely informative in helping you understand productivity. They can provide clear measurements of what your workers are spending their time doing over the course of the day, making it easier to not only understand the big picture of how much you produce as a business, but also the details that contribute to variance in productivity between workers.
These productivity measurement tools can play a key role in deepening your understanding of productivity, something that’s especially critical in today’s workplace.
The growing focus on productivity
Developing a strategy to measure productivity in your business is critical. If you can’t keep up with your competitors, you run the risk of not only falling behind, but ending up in a situation where catching up feels impossible because you’re consistently outproduced by others in the marketplace.
In a HubSpot survey, nearly 74 percent of respondents said they believe productivity has a direct relationship to an organization’s growth, impacting both scaling and revenue creation. Furthermore, 75 percent of those polled said they intend to increase their use of productivity tools over the course of the next year.
This data points to a growing emphasis on productivity as a key growth enabler for businesses. But using productivity to scale your organization often depends on distinguishing between productivity and efficiency, as each delivers value in its own way.
Productivity vs efficiency
The debate of productivity vs efficiency is often an ongoing point of discussion for businesses. Productivity refers to generating more of whatever your business creates. You need to be productive in order to create revenue.
Efficiency measures the resources you use to create that productivity. In many cases, improving efficiency is a path to sustaining — and sometimes improving — productivity while using fewer resources. Technologies and operational strategies that improve efficiency can fuel productivity gains, but they may not always do so.
In some business processes, an organization can run into an efficiency wall, meaning that they’ve optimized a task to such a degree that there’s no more room to make significant improvements in how they get the work done. However, their productivity may remain low because many of the systems surrounding that process aren’t equipped to keep up with productivity demands. Efficiency is important, but productivity often needs to be the point of emphasis as businesses try to grow.
This isn’t to say that efficiency isn’t important. Instead, it’s vital to understand that there’s a ceiling on any efficiency-related investment, and that ceiling is your level of productivity. If you can’t produce more, then getting more efficient doesn’t matter. If getting more efficient helps unlock resources that you can use to produce more, then the efforts can pay off by helping you scale your organization.
Of course, for any small business owner, expanding the business often means taking on a greater personal burden of leadership and work to keep up with everyday operational demands. It isn’t just your business that needs to get more productive; you may need to ramp up your capabilities as an individual. With this in mind, here’s a look at top productivity tips that can not only apply to you but also your employees.
Top productivity tips to achieve more
Improving business productivity starts at the individual level. Finding ways to produce more yourself can help you model positive behaviors for your employees. It also lets you try different productivity strategies that you can then pass on to workers through training programs. Whether you need to get organized through better scheduling or simply declutter your space, following these productivity tips can help you gain an edge.
Here’s a look at some common productivity strategies and guidance on how you can take full advantage of them.
Use planners to boost productivity
You can do more than optimize your schedule with a planner. You can personalize your planner based on your needs and use it to
Jot down reminders about things you meant to do
Log times for meetings, events within your day, or milestones you need to think about
Take notes about plans and expectations for your day, essentially treating the planner as a miniature, low-maintenance journal where you reflect on your schedule and plan ahead
Record key bits of information that may help you remember an important detail heading into a meeting or start your day in a positive way
Paper planners can help boost productivity by helping you mentally declutter. Stepping away from screens and manually writing details down can help you remember those key points. This, in turn, can help you focus on the most important parts of your day, letting you prioritize what matters and get more done.
Alternatively, digital planners can be incredible organizational tools, integrating with your email application or similar solution so you can get notifications when you need to do something. Plan your day in most digital calendar apps, and the solution will send you alerts in advance of meetings. This means you don’t have to worry about scheduling details, which makes it easier for you to focus on the task at hand and be more productive.
As you use these tools, you may find it helpful to scale them for your business. For example, the G Suite software that we’ll talk about later in this guide lets you create a calendar for your work email account and share it with colleagues. You can then see one another’s events and get alerts about each other’s schedules. These types of tools extend personal productivity benefits to the organizational level.
Create block schedules to eliminate distractions
Have you ever felt like your days are so filled with distractions that you can never actually sit down and get things done? You’re not alone. Business leaders with this problem often borrow an idea from academia — block scheduling — to help them get rid of distractions that limit productivity.
Block scheduling eliminates many frequent activities and replaces them with a fewer tasks that you spend longer on. In schools, this might mean moving away from students taking each course for an hour every day and instead rotating courses throughout the week, each with multihour sessions, to balance things out.
Giving individuals a large block of time to work on a single task or set of related tasks can make it easier for them to focus and get more done. It not only reduces the distraction and waste of constantly switching between tasks, but it also empowers you to focus on one thing.
Finding ways to control your focus in the workplace is critical. Small business owners wear many hats, and they can’t afford to jump between tasks over and over again in a day, constantly reorienting themselves each time. Block scheduling addresses this problem.
While you probably won’t get to a point where you can block out entire days for specific tasks, you can cordon off parts of your day — such as a block of three hours every Tuesday and Thursday for future planning — for a distinct purpose, helping you to be more productive during those times.
Leverage voice-to-text to simplify your day
Stopping to take note of an idea or remind yourself to do something later in the day is not only annoying, but it can also break your chain of thought and impede your productivity. What’s more, if you’re preoccupied with a bunch of disconnected ideas, this will limit your focus because you’re thinking about everything else you have to get done that day.
Voice-to-text software and apps let you take a quick note, update your calendar, or even send a message to a coworker without having to stop, find a pen, get a piece of paper, log the note, and hope you don’t lose track of it before you get to use it.
With voice-to-text apps, you can speak into your mobile phone’s microphone, and your phone will convert it into text. Simple voice-to-text solutions are great if you need to take a quick note. However, digital assistants, such as Apple’s Siri or Google’s Alexa, take this functionality to another level. These applications integrate with your calendars, contacts, internet search engines, and similar tools to let you interact with data in various ways, all with your voice.
If you run into a business contact and want to remind yourself to set up a meeting, you don’t have to write down their name or hope you remember to do it later. Just tell your phone to remind you. You can even specify a time when you’d like to receive the message or have the alert trigger based on your location. This kind of voice-to-text functionality can increase your productivity simply by reducing the amount of time you spend trying to remember things or write them down so you can spend more time getting work done.
Listen to music to create calm
A sense of urgency, and even haste, can help you complete certain tasks. Imagine that mindless task that you dread and try to power through at the end of the day, using the chance to go home afterward to motivate you. Since the task doesn’t require thought, you can just focus on doing it quickly. Music can help energize you for this type of mindless work. Turn on your favorite high-energy playlist and let the beat push you through the work.
But what happens when you need to slow down, take your time, and really think about what you’re doing? Certain types of music, particularly instrumental songs, can help the brain to focus. This makes them a natural fit when you’re trying to zero in on an abstract task that requires thought and creativity. The music can slip into the background, providing a degree of white noise while also stoking creativity.
Ultimately, music has a huge impact on how we think. It can calm us, help us focus, give us an energy boost, and distract us from negative thoughts. Strategically incorporating music into your routine — ensuring that what you listen to matches your personal tendencies — is a great way to bolster productivity in a fun, intuitive way.
Consider monotasking to drive efficiency
There’s a fundamental flaw with multitasking: It’s almost impossible for one person to do multiple things at the same time and do them well. There are times where the half effort that comes with splitting attention between multiple things is fine — such as when you’re completing mindless paperwork. But as a small business owner, chances are you aren’t just busy, you’re constantly facing important decisions that require careful thought and focus. Enter monotasking.
Monotasking, like block scheduling, is designed to help remove clutter so you can focus on the task at hand. The practice involves homing in on a single task you need to complete, handling that process, then moving onto the next thing. Sometimes, blocking off times in your schedule for monotasking is necessary to can save you from constant interruptions that force you to multitask.
The idea here is fairly straightforward: Focusing on a specific task, doing it well, and moving on ensures that you do the work well because your mind is clear. Instead of jumping around frantically between multiple tasks, you focus on the issue in front of you. This can bring out the best results, helping you work well enough that you make fewer mistakes and end up more productive in the long run.
Focus on important tasks to strengthen production
We’ve all had the kind of day when it seems like we can’t get anything done due to constant distractions. You try to get a good workout in, but a minor crisis at home cuts your gym time in half, and you scramble into work, stressed and running late. Then you try to finish a key report but keep getting phone calls from a colleague who needs help on a less important task that happens to be urgent.
Over the course of the day, it seems like everything important gets pushed aside for something trivial, and you leave work feeling strained and behind schedule.
This kind of productivity problem is common for many businesses, and the person in charge has to model prioritization for the culture to trickle down across the business. Identify the most important tasks for your day and give them the attention they deserve. Don’t let urgency create a false sense of importance. By setting clear goals and boundaries, you can more easily prioritize what’s most valuable and know when you can adjust.
As you master prioritization, start employing it across the business, helping employees focus on the most vital operations. This drives productivity, in large part by ensuring your employees spend most of their time on the most valuable operations, positioning them to generate more for your business.
Set goals to get ahead
Prioritization is a natural entry point into setting goals. You can’t prioritize effectively if you don’t have a clear sense of your goals as an individual and as a business. Taking time each morning to set goals — maybe in your planner — can help you prepare for the day ahead and ensure you stay laser-focused on what needs to get done.
Monthly, quarterly, and annual goals can provide more of a big-picture focus, giving you consistency so you can prioritize effectively each day without getting bogged down trying to figure out what’s most important. If you have clear goals in place, they can serve as measuring sticks for other tasks. You can use your goals to assess whether something is worth your time, which helps maximize productivity.
Doing this on a personal level can help you avoid stagnation and power through your days more smoothly. Employing the practice across your business can strengthen culture, bring employees together toward common ideas, and help everybody get more of the most important tasks done on a day-to-day basis.
Prevent burnout
Burnout is the enemy of productivity. People experience burnout when extended periods of overwork — or work on tasks that don’t seem valuable — create significant fatigue. Tiredness, whether physical, emotional, or intellectual, can derail productivity. It doesn’t just slow people down; it also leaves them more prone to mistakes. Taking time to identify mistakes, correct them, and return to normal work can have significant negative effects on productivity.
Preventing burnout is much more effective than trying to deal with it. Some strategies you can take to prevent burnout, either for yourself or for your employees, include
Creating clear boundaries around work so you and your employees don’t feel the need to be constantly connected and available. Having to continually keep work in the back of your mind can quickly lead to burnout as fixating on work can limit your ability to get meaningful rest.
Organizing job roles — or your personal work schedule — in such a way that a variety of tasks are completed over the course of a day or two. While blocking out chunks of time for specific processes or areas of operations is great, trying to do the same thing over and over again creates monotony. This, in turn, promotes burnout as fatigue builds, and employees can feel disconnected from what they’re doing due to repetition.
Taking extended vacations when possible. Have you ever dreaded going back to the office after taking a week off, but after a two-week break, found yourself thinking creatively about work and excited to get back? You aren’t alone. Burnout rises when you don’t take significant breaks, because fatigue can build slowly over time. Getting away for a meaningful amount of time helps you break habits and thought patterns that fuel burnout and hold you, or your employees, back. You don’t even need to go away. Devoting time to hobbies or rest can be key in providing the variety you need. Besides taking time off yourself, ensuring employees receive sufficient paid time off and feel like they can use it is important to limiting burnout.
These are just a few tips to help you tackle burnout, but the themes are common across most advice. Keeping burnout at bay is a matter of variety and rest.
Avoid productivity killers
Just about every working professional has done it. You hop onto a non-work website to quickly check on something, then go down a rabbit hole and next thing you know an hour has passed, you’re late for a meeting, and you’re distracted by the great things you’ve been looking at. The internet is a productivity killer, but it’s also a productivity enabler.
Tools like social media, online media sites, and internal employee communication tools can all be great places to get key information that supports work and helps you be more productive. They can also be places where you start looking at work-related information and get distracted by a chain of content that leaves you wasting time.
Finding ways to avoid these productivity killers is key. Here are some tips to help you stay focused:
Create a personal set of boundaries for how and when you’ll use online tools for nonwork purposes, and enforce them strictly.
Don’t even have communication apps open unless you actively need to engage a colleague or customer. Most apps can run in the background and notify you if an important message comes in.
Establish a work environment that makes it difficult to get distracted. For example, keeping office toys off your desk can eliminate the temptation to go astray when you need a mental break.
There are plenty of distractions that can kill productivity, and everybody responds to different activities in their own ways. Take the time to identify what you find particularly distracting and focus on blocking those things out whenever possible.
Declutter your desk
Those office toys that help you destress when you need to think are great within those boundaries. Decorative items that help you personalize your space can make you comfortable so you can feel at ease and focus. Office supplies — staplers, rolls of tape, your phone, paper, trays, pens, etc. — put tools you need at your disposal. Used in the right way, all of these things can help you be more productive.
The problem is that the line between a useful, productive work space and a cluttered, distracting desk can be very thin. It’s also a very personal boundary. Give one person a minimalist desk with an all-in-one PC and everything else neatly in drawers, and they’ll be comforted by the empty space. Give that same desk to another worker, and he or she may find it stark, institutional, and intimidating. What works for you?
Experimenting with your desk space to find the right balance is key, but regardless of your personal taste, it’s important to declutter your space to eliminate wasteful stuff. Every item that you don’t benefit from is just an object to catch your eye and distract you. Constant stimulus is stressful. Find the right blend of cozy clutter and organized peace for your needs, so you can boost productivity.
Of course, this is much easier if you have a dedicated office space. You may need to set some boundaries for employees in an open office or semi-open cubicle setup. One person’s comfortable mess may be a colleague’s organizational nightmare.
Think about your company’s culture around employee expression and personalization in the workplace and use that as a starting point to create some guidelines around how much freedom employees have. This will allow them to do what they want with their desks while maintaining an appropriate degree of cleanliness and organization.
Take practical steps to increase productivity
These tips may be simple, straightforward ways to adjust your habits to improve productivity. But, taken together, they can transform how you approach work each day. Taking strides toward greater productivity is often about removing many small barriers that hold you back.
Following these tips can help you increase your own productivity and promote stronger practices across your business. They’re a starting point. Read on to learn about tools that can help you and your organization be even more productive.
The best productivity apps
Improving productivity is easier when you have the right tools. Imagine trying to sweep a large kitchen floor with a dustpan and brush. You can get the job done, but it would take twice as long than if you had a vacuum.
With a good vacuum cleaner, you’ll work more efficiently. That efficiency can be turned into productivity if you use the time you saved to get more work done in another part of your home. Use a robot-vacuum to automatically clean the floor, and your productivity can double as you use all of the time you save for other tasks.
This is what modern digital apps can do for your business. They give you better tools for key tasks that often serve as productivity roadblocks. Here’s a look at a few major productivity apps that can help you and your employees get more done:
Trello
Trello is a project management and collaboration app that gives users the ability to organize their work in more intuitive ways and easily share updates with one another.
The solution is so user-friendly that you could just as easily use it to plan your next vacation as you can a complex, multimonth project that requires input from a dozen stakeholders within your business.
Trello has a board, list, and card structure. A board displays the project name and serves as a central dashboard for KPIs and key updates that apply to all team members. The board is essentially a hub that tracks all the items that need to get done, tasks that are in progress, and issues that have been taken care of.
A tier below the board is a list. The list compiles a group of related items that need to be completed, allowing you to easily view what needs to happen within a specific category. You can use a list to describe a complex process that needs to be completed, for example, or to document materials that need to be purchased, sorted by date. This kind of flexibility lets you create an easily scannable group of related tasks that users can access and get updates on within the platform.
Cards are even more specific, acting as individual items in a list. Cards describe the specific task that needs to be completed and provide relevant metadata or project information impacting that task.
A Trello user can log in and quickly view a board describing the primary work that needs to be done, whether it’s in progress or is complete. From there, you can jump into specific project lists to learn more about progress and prioritize what needs to be completed. The actual cards within the list provide the details necessary to handle a specific task.
Trello makes it easier to maintain productivity by helping you get and stay organized, both as an individual and as a team. JotForm’s Trello integration increases your productivity even more. You can use our custom form creation tools to gather and manage key project data, and set up form submissions to automatically send the info to lists or cards within Trello.
Zapier
How much time do you typically spend each day moving a piece of information from one application to another? Imagine a client sends you an attachment with an update to an ongoing project. You have to download the attachment, move it into your file sharing application, open your file sharing app, and use that to send it to a user’s account in the app where they actually get the work done.
Doing this every once in a while isn’t really a problem. But performing these tasks at the scale that many businesses have to in order to communicate relevant data to different stakeholders across a variety of apps is a huge time waster. You’ll also get more done when you spend less time on these types of clerical tasks and more time and energy on the work that actually creates value for your business. Zapier solves this problem.
Zapier lets you set triggers for automated workflows that “Zap” information between apps. In the example mentioned above, Zapier would recognize a new email with an attachment as a trigger, copy the attachment to a file sharing app, and alert you of the process in a collaboration app. This moves the data to the right place while keeping you in the loop and helping you avoid unnecessary clerical work.
Automation doesn’t always have to be a complex, technically overwhelming process. Zapier gives you the tools to create simple, streamlined automation workflows that don’t require development expertise and let you automate a task in just a few minutes. The solution integrates with more than 1,500 apps, including JotForm.
When working alongside JotForm, Zapier can automatically move data from forms to the applications your users leverage. For example, if you’re running a major customer survey to get a better understanding of how end users perceive one of your products, you can use Zapier to grab data updates from JotForm and automatically move that data into the spreadsheet or reporting tool you’re using to track results.
Today, productivity is often a matter of giving people access to the right data at the right time. When users have to log data manually, re-enter information in multiple places, or switch between apps to get the information they need, they end up working more slowly and getting distracted more easily. Accuracy and data quality issues can also arise in this situation.
Tools like Zapier help you eliminate these concerns through straightforward automation that allows you to share data with ease.
Slack
If getting data to the right people at the right time is an essential part of bolstering productivity, then developing strategies for clearer communication and information-sharing across a wide range of process and file types is similarly critical.
You can’t automate everything. Employees often need to have conversations about the work they’re doing. But in the old days of entry-level digital tools, people would often use an app to get on a conference call, open their own version of the file, and talk about edits while trying to keep up with one another. Everybody would be making changes in their version of the file — or have one note-taker handle that — and scramble to keep up with a natural conversation.
Disparate data and file management systems make it difficult to connect different files to specific projects and tasks, adding complexity to collaboration and damaging productivity. Slack takes aim at this problem, giving businesses a centralized social hub where employees can
Engage in text chats to discuss key issues or provide updates on projects
Create internal forums to discuss what’s going on in the workplace (from a forum that discusses the best snacks for the office to a serious place to discuss ideas for product development, forums can provide intuitive and fully searchable places to communicate)
Attach files to projects, conversations, or forum entries to ensure people get the data they need to collaborate
Control authorizations and access to conversations, shared files, and even parts of forums to ensure only authorized employees can access the data being shared, while making it easy for those with access to get information
Move between various communications methods — text chat, forums, voice call, video call, screen share, etc. — all within the same app
Collaboration gaps are often productivity roadblocks. When your employees can’t share information effectively or connect with one another, they’ll work on their own. This can lead to poor information sharing and create operational silos that leave people working on the same tasks but in different ways. This wasted time and effort can result in financial losses or worse.
Modern collaboration apps are designed to make it easier for people to communicate in ways that align with their day-to-day workflows. Instead of having to open separate apps or jump between interfaces, everything is in the same place, simplifying collaboration and driving productivity gains.
The idea of “working smarter, not harder” is often about improving efficiency. But it also impacts your ability to produce, as employees who avoid easy mistakes caused by lack of communication can get more done because they spend less time troubleshooting and trying to figure out how to prevent mistakes down the line.
Doist
In many cases, productivity is about simplification. Block scheduling simplifies work by helping you focus on specific areas of work during an extended period of your time. Decluttering your desk eliminates unnecessary stuff, allowing you to focus and keeping you from getting distracted by messes or gadgets. Data integration between apps lets you simplify operations by ensuring information gets to users where they are so they don’t have to move between a bunch of different services.
Simplicity is often a path to productivity because it helps users focus on the task at hand and get it done quickly. Doist is a brand devoted to simplicity, and it helps businesses simplify work primarily through two solutions:
Todoist
In its simplest form, Todoist is a digital to-do list. It builds on that functionality through messaging, project management, and file sharing tools, ensuring that you can track what you need to do and simplify planning, task assignments, and progress tracking, all in real time.
Twist
If Todoist takes the idea of a to-do list and simplifies it so you can focus on primary tasks, then Twist brings that same philosophy to communication. Many enterprise collaboration tools make it easier for colleagues to get together in one place and work on a common project. But that scale of operations can often lead to a degree of chaos as everybody tries to keep up with all the tasks happening at the same time.
Twist provides a streamlined, minimalist collaboration platform that lets you put conversations in one place, organized by topic or subject, to keep everything coordinated and cohesive.
While Doist focuses on simplicity, they don’t do so to the detriment of sophistication and functionality.
Doist’s focus on productivity isn’t just about their solutions either. They work to model digital productivity in their own operations, and they’ve used a combination of JotForm and Zapier to help streamline the application process for their nonprofit discount program. Check it out to see how mixing and matching productivity apps can help you solve key operational pain points and promote better operations at your business.
Using apps to take real productivity strides
There’s only so much you can do to improve productivity through process optimization, scheduling, and similar strategies. At some point, your employees will run into a situation where they could get more done faster, but your technologies limit them. Whether your employees can’t share data easily or have to deal with cumbersome legacy apps for key tasks, the result is diminished productivity.
Investing strategically in new productivity apps can help you make real progress toward sustainable productivity gains. The right solutions can bring data to users in more intuitive ways and equip them to work in a more flexible, natural manner. This creates a greater sense of freedom for employees, further helping them become more productive.
The best productivity software
Productivity apps are great for solving specific problems. They give users tools they can pick up and put away as their daily needs shift.
Productivity software presents a different opportunity. It often serves as a central hub for work. Email platforms provide communications, messaging, and collaboration tools. Word processors, spreadsheets, and database tools enable users to create, edit, and manage information within the business.
Productivity software is instrumental to helping your employees get more done, and finding the right solution for your price point and needs is key. The good news is that cloud technologies are making powerful tools more accessible than ever, bringing enterprise-class functionality to small businesses. Here are some of the most noteworthy tools that deliver on this promise:
Office 365
Just about every professional has worked with Microsoft Office. Many used Word and PowerPoint in school, and Excel was their first major exposure to spreadsheets. In the past, businesses had to purchase an expensive software license for each user, in many cases paying for access to specific Office-based productivity apps that their employees may not have even needed.
The cost of Office for Business led many organizations to seek alternative options, even different packages of Office, that provided key functionality at a lower cost. But in the old days of individual Office installations on end-user machines, businesses also needed solutions like Sharepoint to help them share files and collaborate. The result was a complex, technologically specialized productivity ecosystem that many small businesses simply couldn’t justify.
Office 365 changed all of this. It’s delivered as a subscription service. You don’t need to purchase office licenses in bulk. Instead, you can pay a small monthly fee for each user on the system. This lets you keep entry costs low while accessing some of the best productivity solutions on the market. Office 365 for Business includes
Outlook: a powerful email application with robust collaboration and schedule management features
OneDrive: an industry-leading file sharing solution
Word: perhaps the definitive mainstream word processing application
Excel: a powerful, sophisticated spreadsheet solution
PowerPoint: a presentation creation tool that has become so prominent that digital presentations are often referred to as “PowerPoints” by default, even if they aren’t built in PowerPoint
Publisher: an advanced publishing platform that builds on Word with specialized publishing capabilities for businesses seeking to create visually striking print or digital assets
Access: a database solution that can be used to easily create custom databases without coding
These apps form the foundation of Microsoft Office 365 for business, but more solutions are available at higher subscription levels. The flexible subscription option lets businesses use powerful tools in a more accessible way. Microsoft also offers one-time purchase options for those who prefer to get Office that way.
All of these details aside, Office 365 can be a great productivity solution in large part because it provides the power, functionality, and interface of Microsoft’s tools while allowing for easier data sharing and integration with modern collaboration tools. Office 365 enables users to
Access apps and files across multiple devices without having to manually share files; work is associated with the user, not the device
Share information easily within application interfaces, as all of Office 365 is integrated, and apps within the platform let teams view and access shared files with ease
Take advantage of robust security tools in the backend to manage and share data without having to worry about onerous security protocols
Microsoft Office has long been an industry leader in driving productivity in the workplace. While emerging solutions are starting to challenge this industry giant, the growing prominence of Office 365 highlights how the company has successfully moved into the cloud age and remained a powerful player in today’s productivity space.
G Suite
G Suite is Google’s answer to Microsoft Office 365. It emerged in the early days of the cloud as a simple way for businesses to access productivity apps through a central web interface. It made word processing, spreadsheets, calendars, email, and presentation solutions available in one place. Google Drive provides a central data and file storage hub, while apps like Google Docs, Google Slides, Gmail, and Google Sheets provide tools comparable to Office 365.
We won’t dive into the subtle feature differences between G Suite and Office 365, as the apps are often similar and the distinctions, while sometimes significant, are frequently a matter of preference. Ultimately, both solutions can boost productivity through access to intuitive, user-friendly productivity apps that let your employees create content efficiently.
Whereas Office 365 stands out because of its legacy — users are familiar with its interface, and it offers a wide range of particularly powerful tools due, in part, to its longstanding role as the industry leader — G Suite is noteworthy because it’s built from the ground up for today’s cloud-focused world.
In some cases, this results in more streamlined feature sets in G Suite apps, where some solutions sacrifice more sophisticated capabilities in favor of making the most important functions easier for users to access. But the most prominent result of Google’s cloud-first approach to G Suite is its integration within the larger Google Cloud Platform.
Google provides a wide range of solutions for everything from specialized mapping applications to big data and artificial intelligence tools. These technologies rely on access to accurate data from all parts of a business in a centralized platform. The Google Cloud Platform fully integrates with G Suite — any Google apps you use in one part of your business can typically share data, at least in some format, with another app. This makes it much easier to share information across lines of business.
The Google Cloud Platform is emerging as a powerful productivity tool because of how easy it makes data sharing, including allowing multiple users to interact with files in real time.
Productivity often depends on digital transformation. The easier it is for your employees to share information and collaborate, the more productive they will be. G Suite is built to support this kind of end-to-end digital innovation.
Airtable
Many traditional software systems left a lot to be desired when it came to flexibility. If you’ve been running a business for a while, you can probably remember the days of purchasing software, spending time installing it on machines, training your users to use it, and then aligning your business processes with what the software let you do.
Many professionals have been in situations where they know they can improve a process or ramp up productivity, but their technology prevents them from getting the right data to the right people or slows them down because they can’t collaborate effectively. Working within the confines of prebuilt software that may be tailored to your industry, but not to your business, can put a ceiling on your productivity. Airtable helps businesses break through that ceiling by blending the capabilities of common productivity solutions into a fully customizable productivity and project management solution.
Airtable brings together spreadsheet and database capabilities to help users organize their operations in a way that aligns with how they work. At the business level, you can create custom processes and workflows and document them in the software. Airtable houses relevant data, files, and tools to help users interact with the process. From there, team members can create new tasks and projects in a variety of formats, including
Grids that show work based on project status
Calendars that detail project time lines and provide immediate visibility into progress
Kanban boards that organize projects into various stages and make it easier to quickly identify tasks that need to be completed or issues that must be resolved
Forms that provide essential data and give users tools to update projects and share information with others
Airtable provides flexibility and customization so your teams can organize projects and data in the way that’s most efficient for their needs. This, in turn, drives productivity.
JotForm can add even more to your Airtable project, as you can integrate our forms to send data to different components of Airtable’s interface. This eliminates the need for manual data entry and pulls information directly from digital form submissions — such as surveys or field service inspections — into Airtable.
Data keeps us operating at full capacity when we have access to it. But when the data we need isn’t available, our work slows to a crawl. With JotForm and Airtable working together, you can get users the data they need in a format that fits the projects they’re working on.
Asana
Like Airtable, Asana is a project management tool that helps users track the progress of key tasks and share data in real time. But where Airtable is built around the philosophy of promoting flexibility and customization, Asana focuses on teamwork.
The old saying, “Teamwork makes the dream work,” is a cliche for a reason — and not just because it’s incredibly corny. Businesses increasingly depend on processes that are too complex and specialized for any individual to handle on their own. A single production run in a small manufacturing plant may require individuals with expertise in materials sourcing, warehouse management, production scheduling, machine programming, quality assurance testing, and packaging and shipping. And that only covers the actual creation of a good, not the market research, sales, marketing, and branding work behind it.
Complexity puts a major strain on productivity because teams, by their nature, are less efficient than individuals. A single person can put their head down, tune out distractions, and power through a task. A team needs to listen to input from stakeholders, coordinate activities to avoid duplicate work, share updates on progress, and pass tasks between multiple users.
Software that focuses on project management functionality can help teams be more productive, in turn helping your business get more done. Asana is a prime example of this trend, as the software is built explicitly for teams handling complex projects with multiple stakeholders.
Asana’s interface is highly visual. Its design makes it easy to see the way different tasks relate to one another and how those relationships impact deadlines. Managers can easily view progress at any given time, identify which employees are holding a project back, and troubleshoot any issues before they escalate.
Asana is particularly well suited for creative teams or work environments with similar demands — sharing large amounts of information and relying on multiple stakeholders to perform various portions of projects to create a final product or campaign. Asana also features
Built-in automation tools to eliminate tedious tasks
Calendar-based interface displays to keep everybody on schedule
Objective tracking solutions that make it easier to prioritize work and oversee operations at a high level
Real-time data reporting to stay on top of workloads and ensure employees are properly equipped to get the job done
Integrations with a variety of solutions, including tools from Microsoft, Google, and JotForm
The JotForm integration with Asana automatically sends information from form submissions to team members as either a task, project, or conversation within the app, depending on which format is the best fit. JotForm lets you gather data from employees, contractors, or customers in a wide range of formats, including both templates and custom forms. The integration with Asana lets you take the data created in these forms and deliver it to users in an intuitive way that helps them work together by ensuring nobody is left in the dark.
Teamwork is essential to doing quality work in today’s complex business world. But bringing together individuals with specialized skills to collaborate is rarely easy. Tools like Asana help your teams to work together, eliminating key pain points that limit productivity.
monday.com
Like Airtable and Asana, monday.com is a project management solution that gives employees and managers insight into day-to-day work. The solution has a fairly minimalist interface, which makes it easier to quickly see projects across the business. By getting the most important information to the right team members, monday.com boosts productivity.
In many ways, improving productivity in the digital age is a matter of eliminating data clutter. Many people are bombarded with information, leaving them feeling overwhelmed and limiting their productivity. monday.com aims to ease this burden by making it easier to plan work, track it, and collaborate with team members without creating too much clutter.
You can customize the interface for your business. It features a wide range of reporting tools and integrates with common productivity apps, including solutions from Microsoft, Google, Slack, Trello, and Zapier.
Driving productivity in the era of digital transformation
Digital transformation is changing how businesses approach productivity. When widespread use of personal computers made digital technology accessible, businesses tended to use software and apps to meet specific operational demands, blending a variety of solutions. Since only certain parts of the business depended on digital tools, and many still relied on manual, paper-based processes, this worked. But widespread access to broadband, cloud computing, and mobile devices has changed how consumers interact with brands and how businesses engage one another.
In this new era of digital work, isolated technologies that don’t talk to one another become problematic from a productivity perspective. When users are constantly shifting between solutions to get the data they need for major work tasks, they’re often overwhelmed by the number of things they need to do and the systems they have to use to complete the work.
Digital transformation is about bringing solutions together, providing anytime, anywhere access to critical data. JotForm does this by capturing data through online forms. By integrating with various productivity apps and services, we make that data accessible. This same kind of data sharing is happening across the digital landscape, fueling productivity gains that help businesses get more done.
Of course, digital apps and software don’t solve all of your problems, but business leaders today need to blend tried-and-true personal organization strategies with digital technologies to maximize productivity. Whether you’re looking to get more done yourself or empower your teams to be more productive, you have lots of options at your disposal.
Ultimately, finding the key to productivity is a highly personal, organization-specific matter. Different teams in different industries all face unique challenges and work dynamics that impact their ability to complete work. By blending creative productivity strategies with apps and software, you can find a mix of solutions that will help you and your employees be as productive as possible.JotForm can help you on this journey, with customizable digital forms that help you collect data and share information. If you want to learn more about how we make this possible, we’d love to talk. Contact us today or check out our collection of prebuilt templates to get a better idea of how our digital forms work.
http://damianfallon.blogspot.com/2020/04/productivity-ultimate-guide.html
1 note
·
View note
Link
via Politics – FiveThirtyEight
Welcome to a special edition of Silver Bulletpoints, where today we’ll fire all three of our bulletpoints at one topic: the DNC’s decision to substantially tighten the qualifying criteria for the third presidential debate, which will take place on Sept. 12 and 13 on ABC News.1
For the third debate, candidates will need to meet both a polling threshold and a fundraising threshold to qualify — previously it was just one or the other. And those thresholds have been raised from what they were before:
Instead of needing 65,000 unique donors to qualify, candidates will need 130,000.
Instead of needing to achieve 1 percent in each of three polls, candidates need to hit 2 percent in each of four polls released between June 28 and August 28. The criteria for which polls qualify has also been amended slightly.
This is an important change, one that could serve to quickly winnow the field from 22 candidates to a dozen or fewer. Of course, candidates can still run their campaigns even if they can’t debate … but it will deprive them of a lot of oxygen.
Bulletpoint No. 1: 6-8 candidates look pretty safe for the third debate. Then it gets dicey.
Technically, no candidates have yet qualified for the third debate because only polls released beginning on June 28 count toward it. However, we can make some good guesses about who’s likely to make it. Five candidates — Bernie Sanders, Elizabeth Warren, Kamala Harris, Pete Buttigieg and Beto O’Rourke — already had at least 130,000 unique donors as of their first-quarter fundraising reports. Joe Biden had almost 97,000 donors in his first 24 hours, so it’s safe to assume he’ll hit 130,000 soon if he hasn’t already. (The Biden campaign did not respond to a request for an updated donor count.) Andew Yang said on Wednesday that he had only about 20,000 more donors to go, which should also be no problem.
The polling criterion might be harder for some candidates, including Yang. Only eight candidates — Biden, Sanders, Warren, Harris, Buttigieg, O’Rourke, Amy Klobuchar and Cory Booker — have routinely polled at 2 percent or higher. And the relatively narrow time frame from when polls are considered will make it harder for candidates to get lucky.
Here’s my overall assessment of everyone’s chances, keeping in mind again that the polling number in the chart reflects all polls since Jan. 12 and not yet the ones that will actually count toward the third debate.
Which candidates are good bets to make the third debate?
Candidate Qualifying polls* Unique donors Nate’s assessment Sanders 9 525,000 as of 3/31 Almost certain Warren 9 135,000 as of 3/31 Almost certain Harris 9 138,000 as of 3/31 Almost certain Biden 9 96,926 as of 4/26 Almost certain Buttigieg 8 158,550 as of 3/31 Almost certain O’Rourke 9 163,000 as of 3/31 Almost certain† Klobuchar 8 65,000+ as of 5/3 Probable Booker 8 65,000+ as of 5/3 Probable Yang 1 110,000 as of 5/29 Tossup Castro 2 65,000+ as of 5/3 Tossup Gabbard 1 65,000+ as of 4/10 Tossup at best Gillibrand 1 <65,000 Tossup at best Inslee 0 65,000+ as of 5/24 Tossup at best Hickenlooper 1 <65,000 Tossup at best Williamson 0 65,000+ as of 5/9 Leaning against Ryan 1 <65,000 Lots of work to do Bullock 0 <65,000 Lots of work to do Delaney 0 <65,000 Lots of work to do Swalwell 0 <65,000 Lots of work to do de Blasio 0 <65,000 Lots of work to do Bennet 0 <65,000 Lots of work to do Moulton 0 <65,000 Lots of work to do
* Qualifying polls at 2%+ since Jan. 1. Only polls released from June 28 to August 28 count toward the third debate. This column reflects how many polls released since Jan 1. would have qualified under the rules that will be used for the third debate.
† Barring further polling collapse
The eight candidates I mentioned in the previous sentence all look reasonably safe to qualify, although Klobuchar and Booker have some work to do on the fundraising side, and O’Rourke needs to avoid a further polling slump. After that, Yang and Julián Castro probably have the next-best chances, although they’re far from guaranteed of inclusion. If I were anyone else, I’d be feeling pretty nervous.
Bulletpoint No. 2: The change helps the sorts of candidates that the DNC probably likes
There’s nothing better than being the last person in line to make the roller coaster before the amusement park shuts down for the day. The debate equivalent is being one of the last candidates who safely meets the qualification threshold. That probably means O’Rourke, Booker and Klobucahar, who are behind frontrunners such as Biden and Sanders, but nonetheless reasonably safe bets for inclusion. Polling surges often begin in debates, and there are usually only one or two of them at a time. With fewer opponents on stage, folks like Klobuchar will have better odds of being the flavor-of-the-month.
It may not be entirely coincidental that it’s candidates like these who benefit from the DNC’s decision. Booker and Klobuchar are traditionally well-credentialed candidates who have compiled a fair number of endorsements, signaling party support. O’Rourke isn’t as well-credentialed, but his ability to raise money from grassroots donors is something the party probably wants to reward.
Yang and Castro are somewhere in between, both in terms of whether the rules change helps them and how “party elites” probably feel about them. I’d imagine Democrats probably do want Castro, the only Latino candidate, at the debate — but if not then maybe he could turn around and run for Senate. Yang may be unorthodox, but brings a lot of policy substance and a different kind of voter to the table.
Who’s hurt? Well, everyone below Yang and Castro, but also any candidates such as Stacey Abrams who might seek to enter the race later on. Sanders, who has a high floor but perhaps a low ceiling, would probably want the field to remain as fragmented as possible for as long as possible, so any move to encourage winnowing hurts him too.
Nate’s not-to-be-taken-too-seriously presidential tiers
For the Democratic nomination, as revised on May 30, 2019
Tier Sub-tier Candidates 1 a Biden b [this row intentionally left blank] c Harris, Warren, Sanders, Buttigieg 2 a O’Rourke b Booker, Klobuchar 3 a Yang, Castro, Abrams* ↓ b Inslee ↓, Gillibrand ↓, Gabbard c Bullock ↓, Hickenlooper ↓, Ryan ↓, de Blasio ↓, Bennet ↓, Williamson ↑
* Candidate is not yet officially running but may still do so.
Bulletpoint No. 3: Which of the third-tier candidates is most poised for a debate-related surge? Maybe Jay Inslee and Kirsten Gillibrand.
Of course, odds are that at least one of the candidates currently in what I think of as the third tier — that is, everyone behind O’Rourke, Klobuchar and Booker — will have surged by the time we get to September, most likely based on their performance in the first two debates. It’s probably a fool’s errand to guess at the most likely surgers, but I’m a fool so let’s run the errand. My wild guess is: Kirsten Gillibrand and Jay Inslee.
As discussed here, I tend to see debates as resetting the race toward the “fundamentals.” In particular, they tend to reset or reverse media narratives, which can often drive short-term surges or slumps in the polls. So one view on which candidates are most likely to be helped are those that have reasonably good credentials, but who have been underachieving so far because they’re ignored by the media or are getting largely negative coverage. My list of underachieving candidates — the ones where I really can’t figure out why they’re not doing better — is headlined by Gillibrand, Inslee and Castro.
Another answer is candidates who have relatively distinct messages or viewpoints. Candidates high on that list probably include Inslee again, with his focus on climate change, along with Yang and Tulsi Gabbard. Gillibrand, who has distinctive messaging around women’s issues, might qualify here as well.
FInally, although it’s a very rough prior, you might give a little bit of credit to candidates who have experience as lawyers, especially as prosecutors or litigators, and who therefore have had to do a lot of thinking on their feet in contentious settings. Inslee is a former prosecutor, and Gillibrand has an impressive legal resume. Harris and Klobuchar (although they’re not in the third tier) also come to mind, of course.
1 note
·
View note
Text
What Percent Of Republicans Are Religious
New Post has been published on https://www.patriotsnet.com/what-percent-of-republicans-are-religious/
What Percent Of Republicans Are Religious
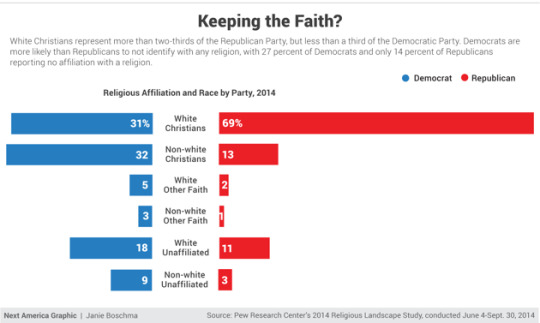
Making Christianity Our National Religion Would Be Terrible For Christianity
Poll On Religion: What Do Republicans, Democrats Think?
On Tuesday Public Policy Polling released a survey measuring Republicans attitudes toward the upcoming presidential election. The survey assessed Republicans opinions of various candidates and political figures, along with their positions on a few policy issues. One of the more curious policy questions presented to respondents was whether or not Christianity should be established as Americas national religion.
A 57 percent majority of Republicans surveyed agreed that Christianity should, in fact, be established as the United States national religion. Broken down into different subsets, the numbers differed somewhat. Younger Republicans in the 18 45 age group were more favorable to the idea, with 63 percent of that cohort affirming that Christianity should be our national faith. Majorities of the older age groups still agreed, but in slightly smaller proportions. Among self-proclaimed Tea Partiers, 58 percent wished to establish Christianity as a state faith; and among those favoring former Arkansas Governor Mike Huckabee in the Republican primary, 94 percent would support such a measure. Eighty-three percent of Rick Perry fans replied that they would prefer Christianity be made our national religion, along with 62 percent of Rand Paul advocates.
Religion: Pietistic Republicans Versus Liturgical Democrats
Religious lines were sharply drawn. Methodists, Congregationalists, Presbyterians, Scandinavian Lutherans and other pietists in the North were tightly linked to the Republicans. In sharp contrast, liturgical groups, especially the Catholics, Episcopalians, and German Lutherans, looked to the Democratic Party for protection from pietistic moralism, especially prohibition. While both parties cut across economic class structures, the Democrats were supported more heavily by its lower tiers.
Cultural issues, especially prohibition and foreign language schools, became important because of the sharp religious divisions in the electorate. In the North, about 50% of the voters were pietistic Protestants who believed the government should be used to reduce social sins, such as drinking. Liturgical churches constituted over a quarter of the vote and wanted the government to stay out of personal morality issues. Prohibition debates and referendums heated up politics in most states over a period of decades, and national prohibition was finally passed in 1918 , serving as a major issue between the wet Democrats and the dry Republicans.
Voting Behavior by Religion, Northern USA Late 19th century
The Third Electoral System 1853-1892 p. 182
Religion May Not Rule Democrats Vote Choice
If there remains an obvious opportunity for some version of the religious left to emerge, it would be among black and Hispanic4 Democratic primary voters, who were significantly more likely than white Democrats to say that religion is somewhat or very important in their lives in the 2016 CCES survey.
And black Protestants are already quite powerful in the party. As FiveThirtyEight editor-in-chief Nate Silver wrote earlier this year, black voters constitute about one-fifth of the Democratic electorate and have a long and deep alliance with the Democratic establishment, making them a key constituency in the primary. According to the CCES, the vast majority of black Protestants and nearly three-quarters of Hispanic Catholics voted for Hillary Clinton in 2016.
As the campaign continues, well learn more about the candidates approach to faith especially whether they prioritize outreach to religious voters in states like Iowa and South Carolina, where religion is likely to be a more important issue than in a relatively secular state like New Hampshire. But while mobilizing specific subgroups of religious Democrats will still be important, the dream of building a cohesive religious voting bloc on the left looks more distant by the year. Democrats may not have much to lose by talking about faith and values but it may not offer them much of a reward among primary voters either.
You May Like: Ne Patriots.com
Who Are More Religious Republicans Or Democrats
Religion has been a part of politics and campaigns since George Washington ran for the Presidency. No candidate has ever run as an atheist and many political pundits said Kennedy couldnt win the White House as a Catholic. And lets not forget Jewish candidates. None have run for President, but Joe Lieberman was the Democratic nominee for Vice-President with Al Gore. They lost.
But are the two partys rank and file different in their religious beliefs? Using the time-series surveys from the General Social Surveys , I have selected several religious beliefs, that I believe most folks would count as significant religious behaviors.
Those beliefs are pray once a day,life after death,fundamentalist,belief in God and attend religious services at least once a week. This is an arbitrary selection, and I dont know how you feel, but unless you become a monastic monk, I dont think you could get anymore religious than this. Lets start with attending services once a week as shown below.
In general, the Republicans have a significant edge on this measure, with a percent decline of weekly attendance over 44 years of only 4%. Democrats on the other hand, declined by 17% over the same time frame. Independents also declined in attendance by 12%.
In a belief of life after death, we have a slight increase among all partisans over time. Both Democrats and Independents had a consistent attitude over life after death, but at 10% lower level over recent years than Republicans.
Shifts In Attitudes By Demographic Groups


Shifts among subgroups from 2016 to 2019 appear most prominently among groups that have been most opposed to allowing religiously based service refusals of gay and lesbian people. These groups include Democrats , the religiously unaffiliated , young people ages 18-29 , Americans with postgraduate degrees , and white mainline Protestants . However, there are also notable declines in opposition among more divided groups such as Native Americans and Mormons .
Seven in ten Democrats and a majority of independents oppose religiously based refusals to serve gay and lesbian people. About four in ten Republicans oppose allowing small business owners to refuse service to gay and lesbian people based on their religious beliefs, compared to a majority who support such a policy. Opposition to religiously based service refusals has decreased slightly among Democrats and independents since 2016, when 77% of Democrats and 62% of independents opposed religiously based service refusals.
Women are likelier than men to oppose religiously based service refusals. Opposition to religiously based service refusals has declined by a similar amount among both genders since 2016 .
Younger Americans are more likely than seniors to oppose religiously based refusals to gay and lesbian people . Young people in 2019 have become less likely to oppose religiously based service refusals than in 2016 , while seniors have not undergone a major shift in opinion during that time.
Recommended Reading: Democrats News
The Stark Racial And Religious Divide Between Democrats And Republicans In One Chart
The Public Religion Research Institute released a massive new survey of American religious adherence today. Among other things it contained this stunning insight into the current state of our political parties:
Today, roughly three-quarters of the Republican Party is white Christian, but fewer than one-third of the Democratic Party identifies this way.
Among Republicans, 35 percent are white evangelical Christians, 18 percent are white members of other Protestant denominations, and 16 percent are white Catholics. Among Democrats those shares are 8 percent, 11 percent and 10 percent, respectively.
Just 7 percent of Republicans are black;Protestants, Hispanic Protestants or Hispanic Catholics.;By contrast those groups comprise nearly one-third of today’s Democratic Party.
From a demographic standpoint, the modern Republican Party looks much like the America of 40 years ago in 1976, for instance, 81 percent of Americans were white and Christian. Today white Christians account for just 43 percent of the population.
President Trump, who campaigned on a platform of making America great;again, capitalized on white Americans’ anxieties about these demographic changes in 2016. In September of that year he told Pat Robertson’s Christian Broadcasting Network if we dont win this election, youll never see another Republican and youll have a whole different church structure.
What Are The Strongest Predictors Of Opposing Religiously Based Service Refusals
A logistic regression model shows the strongest independent predictors of strongly opposing religiously based service refusals, while accounting for all other variables in the model.
Notably, religious affiliation serves as the largest independent predictor of strongly opposing a policy that allows small business owners to refuse service to gay and lesbian people because of their religious beliefs. Members of almost every religious group are significantly more likely than white evangelical Protestants to oppose this policy. Members of other religious groups stand out as 3 times more likely than white evangelical Protestants to hold this view, making this the largest effect in the entire model. Unitarian Universalists , Jews , the religiously unaffiliated , Buddhists , and Orthodox Christians are all at least twice as likely as white evangelical Protestants to strongly oppose religiously based service refusals. Members of nearly all Christian subgroups are also more likely than white evangelical Protestants to oppose religiously based service refusals, but the effects are smaller than those among non-Christian religious groups .
Read Also: How Many Americans Are Registered Republicans
Qanon Now As Popular In Us As Some Major Religions Poll Suggests
Fifteen percent of Americans believe that patriots may have to resort to violence to restore the countrys rightful order, the poll indicated.
By Giovanni Russonello
As hopes fade for a bipartisan inquiry into the Capitol riot on Jan. 6, its increasingly clear that the Republican base remains in thrall to the web of untruths spun by Donald J. Trump and perhaps even more outlandish lies, beyond those of the former presidents making.
A federal judge warned in an opinion yesterday that Mr. Trumps insistence on the big lie that the November election was stolen from him still posed a serious threat. Presiding over the case of a man accused of storming Congress on Jan. 6, Judge Amy Berman Jackson of the United States District Court in Washington wrote: The steady drumbeat that inspired defendant to take up arms has not faded away. Six months later, the canard that the election was stolen is being repeated daily on major news outlets and from the corridors of power in state and federal government, not to mention in the near-daily fulminations of the former president.
But its not just the notion that the election was stolen that has caught on with the former presidents supporters. QAnon, an outlandish and ever-evolving conspiracy theory spread by some of Mr. Trumps most ardent followers, has significant traction with a segment of the public particularly Republicans and Americans who consume news from far-right sources.
New York Times Podcasts
Religion And Political Affiliation
57% Of Republicans Want A Christian Theocracy
Catholics in AmericaView the full series
Politics
This, our fifth survey, took place six months after the House and Senate elections of 2010, in the midst of the confrontation over budget deficits, spending cuts, and tax reform. This essay begins with a demographic overview of political party alignments in 2011. The 2011 question allowed respondents to indicate if they were strong, not strong, or leaning Republican or Democratic; undecided/independent; or other. We have chosen to place those leaning either toward the Democratic or Republican Parties in their respective parties, reducing the independents to 3 percent of the total. These independents will not be included in this essay.
Overall, 57 percent of Catholics affiliate with the Democrats and 40 percent with the Republicans when those leaning toward one or the other party are included. The Democrats held a three-to-two lead before we included the leaners.
The within generation comparisons for 2011 show more Catholics affiliated with the Democrats than with the Republicans in all four generations.
Three beliefs drew minimum support as very important to Republicans and Democrats alike: the teaching authority claimed by the Vatican ; the churchs teaching opposing the death penalty ; and a celibate male clergy .
Large majorities of both Democrats and Republicans affirm their Catholic identity in phrases like Being a Catholic is a very important part of who I am.
Bishops positions
Summary
Don’t Miss: Who Raises Taxes More Democrats Or Republicans
Rise Of Conspiracies Reveals An Evangelical Divide In The Gop
Daniel A. Cox February 12, 2021
After the 2020 presidential election, much of the conversation about the future of the Republican Party has focused on the division between those who side with Donald Trump and those whose loyalties lie with the party. However, there is an emerging fissure among Republicans on the subject of political conspiracy theories between those who identify as white evangelical Christians and those who do not. White evangelical Republicans are far more inclined to believe in claims about the Deep State, QAnon, and that antifa was responsible for the violence at the US Capitol.
Fraud in the 2020 Election
The assertion that the 2020 presidential election was rife with voter frauda claim Trump has repeated consistently without evidenceis common among white evangelical Christian Republicans. But is less widely held among other Republicans. Seventy-four percent of white evangelical Republicans say the claim that there was widespread fraud in the 2020 election is either mostly or completely accurate. In contrast, Republicans who are not evangelical are far less likely to believe this claim is accurate54 percent say it is mostly or completely accurate.
Political Conspiracies
Why White Evangelical Republicans Might Embrace Conspiracies
For this analysis, self-identified Republicans and independents who report that they leaned towards the Republican Party were combined to ensure that the sample sizes for all the subgroups were sufficient.
Religion And Politics In The United States
Religion in the United States is remarkable in its high adherence level compared to other developed countries. The First Amendment to the country’s Constitution prevents the government from having any authority in religion, and guarantees the free exercise of religion. A majority of Americans report that religion plays a “very important” role in their lives, a proportion unusual among developed nations, though similar to other nations in the Americas. Many faiths have flourished in the United States, including imports spanning the country’s multicultural heritage as well as those founded within the country, and have led the United States to become the most religiously diverse country in the world.
Historically, in the 19th and early 20th centuries, the two major parties polarized along ethnic and religious grounds. In the North, most Protestants were Whigs or Republicans; most Catholics were Democrats. In the South, from the 1860s to the 1980s, most whites were Democrats and most blacks were Republicans. see Ethnocultural politics in the United States
The United States has more Christians than any other country in the world . Going forward from its foundation, the United States has been called a Protestant nation by a variety of sources.This is despite the fact that Protestants are no longer the majority in the United States .
Don’t Miss: Which Party Is Bigger Democrats Or Republicans
Sway: Is Jake Tapper For Sale
On todays episode, Kara Swisher spoke with Jake Tapper, the CNN anchor. They discussed how big tech might shape the future of broadcast journalism, his experience covering the Trump administration and its aftermath, whether CNN is a boys club, and how the real Washington is stranger than the fiction he writes.
Democrats And Democratic Leaners
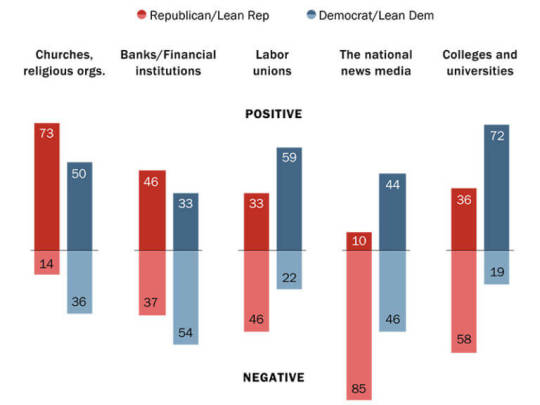
Missionary Baptist < 1%
Conservative Baptist Association of America< 1%
Free Will Baptist< 1%
General Association of Regular Baptist Churches< 1%
Other Baptist 1%
Methodist Family < 1%
Nondenominational Christian < 1%
Interdenominational < 1%
Community Church < 1%
Other Nondenominational 1%
Wisconsin Evangelical Lutheran Synod< 1%
Other Lutheran < 1%
Presbyterian Family 1%
Presbyterian Church in America< 1%
Other Presbyterian < 1%
Church of God < 1%
Foursquare Church< 1%
Pentecostal Church of God< 1%
Pentecostal Holiness Church< 1%
Apostolic Pentecostal < 1%
Nondenominational Pentecostal < 1%
Church of God of the Apostolic Faith< 1%
Other Pentecostal 1%
Episcopalian/Anglican Family < 1%
Christian Churches and Churches of Christ< 1%
Other Restorationist < 1%
Congregationalist Family < 1%
Conservative Congregational Christian Conference< 1%
Other Congregationalist < 1%
Holiness Family < 1%
Church of the Nazarene< 1%
Wesleyan Church< 1%
Christian and Missionary Alliance< 1%
Church of God < 1%
Other Holiness < 1%
Reformed Family < 1%
Christian Reformed Church< 1%
Other Reformed < 1%
Adventist Family 1%
Seventh-day Adventist1%
Other Adventist < 1%
Anabaptist Family < 1%
Pietist Family < 1%
Other evangelical/fundamentalist family < 1%
Nonspecific Protestant Family 1%
Other Episcopalian/Anglican < 1%
Restorationist Family < 1%
Disciples of Christ< 1%
Other Congregationalist < 1%
Reformed Family < 1%
Reformed Church in America< 1%
Other Reformed < 1%
Anabaptist Family < 1%
Recommended Reading: Are The Republicans Winning The Primaries
Shrinking Groups Tilt Toward Gop
The challenge for Democrats is that their potential gains from the growing groups are being muted by an increasing tilt toward the GOP among the groups that are shrinking, in this case whites who identify as Christian. The combined result has left the parties on something of a treadmill, as Republicans offset at least some of the demographic change that benefits Democrats with improved performance among the key groups of shrinking white voters.
Trump has accelerated the trends on both sides of that equation, consolidating the GOPs position among blue-collar, older, non-urban and evangelical whites at the price of sparking intense resistance among younger, white-collar, nonwhite and metropolitan voters.
For most of American history, white Christians represented a majority of the population; as recently as 1991, they still constituted about three-fourths of all adults, according to results in the annual General Social Survey from the National Opinion Research Center. But as America has grown more racially and religiously diverse, and more secular, white Christians fell below majority status of the population for the first time sometime between 2010 and 2012, according to the National Opinion Research Center data. White Christians compose just 41% of the adult population in the latest Pew data .
0 notes
Text
MA Fashion and Textile Practices Major Project Path - 9th September
As I draw my research to a close I feel it is important to look at society as a whole and try to determine who the Future Tribes are.
In the terms of political tribes - who, after all are the people who make up our societies and determine our governments - Europe is currently split into 6 distinct groups. These tribes were determined by means of a poll which was carried out by Chatham House - the home of The Royal Institute of International Affairs and Kantar Public between December 2016 and January 2017, which covered 10 European countries and involved more than 10,000 people. The 10,000 questioned were asked about their views on a range of political and social issues. The data that was collected gave an interesting insight into the minds of the people across the countries involved. The object of the poll was to assess how these people were thinking in regards to the EU because their future actions of could help shape the future of Europe. In the advent of Brexit it seems that the UK may no longer be counted as members of the EU, but it is interesting to see what the answers were and I am sure we can all feel an affiliation to one tribe or another from the list below.

Goodwin, M., Raines, T., & Cutts, D. (2017). Probaility that tribe members agree 'I feel proud to be European'. [Illustration]. Retrieved from https://www.bbc.co.uk/news/uk-politics-42108806.
Some of the main questions were whether the EU should have as much power as it currently holds, whether immigration has had a positive or negative impact on their societies and if some of the wealthier nations should be financially supportive of those nations with strained economies. In size order from largest to smallest are the political tribes which were determined from the poll:
Hesitant Europeans - 36%
This group tends to sit on the fence when it comes to any major issues, although may vote to the centre of to the right if required. They are irresolute about the EU and can waver on political agendas, or can be apathetic. Immigration is a concern and be more concerned about what’s happening on their home turf than in other countries.Their income tends to vary greatly and live in a wide range of European countries.
Contented Europeans - 23%
In this group they feel relatively happy to be part of the EU. They are often younger with positive views on immigration, and vote towards the liberal and left end of the political spectrum. They tend to be based in countries such as Poland and Hungary. They have faith in the EU ideology and tend to prefer to keep the status quo.
EU Rejecters - 14%
This group believes that the EU is undemocratic and wields too much power. They dismiss the idea that being in the EU holds any benefits and feels little camaraderie with other European countries. Many feel negative about immigration and are angered by the politics that comes with being part of the EU. People in this group are rural living and are mainly from Britain and Austria.
Frustrated Pro-Europeans - 9%
These guys are Pro-European. They believe that Europe will become more powerful through progressive values because at the moment they are not feeling the benefit of being part of the EU. They support the idea that a richer state should support a poorer one, but also feel mixed about immigration. they are a range of age groups and live mainly in France, Italy and Belgium.
Austerity Rebels - 9%
This group is dissatisfied with the way politics are conducted within the EU and a more relaxed view with more power being restored to member states. They think like the Pro-Europeans that the richer states should support the poorer ones and believe that each one should receive their fair share of immigrants. The level of unemployment is higher in this group and have experienced economic hardships. Their age tends to be middle aged or older and live in countries with a poor economic track record such as Greece and Italy.
Federalists - 8%
In this group they are committed supporters of EU and believe that the EU has benefited them greatly. They tend to be wealthier, older and disproportionately male who are very positive about immigration. They are the highest educated with a strong social network and most likely live in Southern Europe like Spain and Italy and reside in cities.
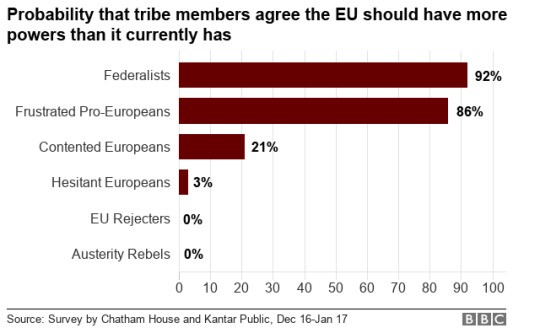
Goodwin, M., Raines, T., & Cutts, D. (2017). Probaility that tribe members agree the EU should have more powers than it currently has. [Illustration]. Retrieved from https://www.bbc.co.uk/news/uk-politics-42108806.
It is really interesting to see what conclusions were drawn from this poll. I can definitely see what political tribe I would be part of, or at least two that I would feel welcome in. The way we see society is really down to our own experiences and environment. We are the children of who have gone before us, and are defined by our experiences. It is then our responsibility to at least try and understand what we need to do to create a society we want to be part of. Unfortunately this was not a world poll where the opinions of the population could be taken into account, but it goes some way in identifying what we are thinking and how we are shaping our societies. Essentially we are all the Future Tribes to some extent, however long we have left on this earth we are shaping and molding it as we continue through life, and when we are gone the next tribes will carry the torch. The use of the T-shirt as a medium in identifying us as tribes, is really using the T-shirt as an extension of ourselves and the need to belong to something - something to make everything feel worthwhile.
Website:
BBC News. (2019). The six tribes that could shape Europe's future. Retrieved from https://www.bbc.co.uk/news/uk-politics-42108806.
Publication:
Talbot, S. (2013). Slogan T-shirts: Cult and Culture. London: Bloomsbury Publishing Plc.
The T-shirt as a reactionary item.
As I discussed in my previous post, the T-shirt seems to be a reactionary item that responds to the wealth of mixed media we see in our society. Glenn Adamson (2013) Head of Research at the V&A would go so far as to describe it as a postmodernist device:
“I think the slogan T-shirt seems to strategically respond to the condition of postmodernity in the sense that it is a personalised version of soundbite culture, and the slogan T-shirt is always both a visual presentation of style and language.”

Working Class Heroes, n.d. (n.d). Deus Ex Machina Sunbleached Postmodern T Shirt Beluga Rose. [Fashion]. Retrieved from https://www.workingclassheroes.co.uk/194238/products/deus-ex-machina-sunbleached-postmodern-t-shirt-beluga-rose.aspx.
Postmodernism was a movement that began around the 1970’s which challenged the purity and idealism of a 20th modernist aesthetic. Postmodernism embraced the mixing of media and art styles which not only effected the way we looked at the our society then, but still continues to do so. In the sense of how postmodernism can be applied to the T-shirt is that, primarily a modernist would look at it and assess its function to that of clothing and nothing more, a postmodernist view would be that form is adaptable regardless of function and can be manipulated to any means necessary.
The advantage of the graphic T-shirt is that it can display whatever we choose without having to say anything, because it does the work for us. Not unlike social media, where we can be the silent commentator. The slogan T-shirt could be the ultimate editor to our current quandaries. The Topshop “Save Your World” T-shirt says in three words what we have been discussing at length, - the slogan T-shirt could represent the ultimate soundbite, reaching far more than your Facebook friends or Twitter followers.
The T-shirt as a sub-cultural medium
Subculture by definition is a group of people within society with attributes which distinguish them from the larger group - so this term is often related to the younger generation who represent themselves differently through music choice, language, and clothing etc. Subcultures often emerge in reaction to political shifts, social changes and events which challenge the status quo. Subcultures have always existed in some form but became more prominent after the major wars, such as with the formation of street gangs in the 20’s and 30’s, and after the second world war in the 50’s and 60’s when the teenager came into their own with a more disposable income within stronger consumer society.
Punk was one of these subcultures as I have discussed in length in previous posts, but it was punk that really enabled us to see what a subculture was capable of. Their aesthetic and attitude is something which has had lasting effect, we often describe something which challenges society and goes against majority thinking as being so ‘punk’. Although it can be argued that the punk aesthetic wasn’t something which emerged organically, particularly in the UK, it could be said it was devised carefully by such Svengali characters as Malcolm McLaren, manipulating others from the background with a fashion savvy Vivienne Westwood as his sidekick. Dr Matthew Worley (2013) Reader in History from the University of Reading said of the punk aesthetic:
“I think to understand punk’s language you have to put the use of slogans into context of the imagery too. The language is very much mixed up into a broader imagery, which was consciously designed to provoke, upset and shock.”

Westwood, V. (1976). Vivienne Westwood’s ‘Cowboys’ hand screen printed t-shirt, 1976. [Fashion]. Retrieved from https://www.marieclaire.co.uk/fashion/a-brief-history-of-punk-fashion-79145.
I can imagine when Vivienne Westwood’s cowboys T-shirt first came out people struggled with the visual imagery of two well-endowed half naked cowboys on the front, until you read the text with it and the whole meaning becomes clear. Of course it’s not only punk which was the defining subculture, but it offers a prime example of societal changes and political discourse defining a group of people to such an extent that was so effecting.
The T-shirt as a symbol of protest
As punk really defined the way we looked at and reacted to what was going on in society, the ethos of punk has continued in various forms ever since. It seems that every reaction we have to what is going on in our world requires a graphic T-shirt to represent and reiterate our voice. The ability of the graphic T-shirt to give us a voice is incredibly powerful, we may feel marginalised by our standing as a women for example, or because we are disabled, or we may feel like we cannot speak for the fear of being ignored. The graphic T-shirt enables us to feel a sense of togetherness with others, offering a silent hand to each other, to recognise a fellow kindred spirit.
Using the T-shirt as a symbol of protest, has of late become more and more evident, we have much to protest about in our world and current events seem to warrant us to become walking placards for our indignance. According to Shehnaz Suterwalla (2013) a journalist and editor:
“The slogan T-shirt spells out on the body a feeling, thought or belief. It can act like a personal manifesto or an expression of desire, including resistance.”


I think the first protest T-shirts I remember seeing were those of Katherine Hamnett. In 1984 the Prime Minister was holding a reception for the designers involved in London Fashion Week and Katherine chose to wear her T-shirt ‘58% Don’t Want Pershing’ – in reference to a European opinion poll regarding the positioning of American cruise and Pershing nuclear missiles. It was a great opportunity for Hamnett to protest her discontent as the image was caught on camera and appeared in newspapers nationwide. A perfect resolution for her because her agenda was all about direct political statements. Since beginning this project I have noticed more and more the use of the T-shirt as a medium for protest. Whilst watching the news one evening, discussion was concerning the wearing of ‘Bollocks to Brexit’ T-shirts by Liberal Democrat MEP’s to the first day of European parliament, and of course the ensuing outrage at such a gesture. The use of the T-shirt as a platform for protest has never been more fitting.
The T-shirt as a lifestyle signifier
In the 80’s the use of branding on T-shirts was a big thing. I remember buying a Tag Heuer T-shirt with their logo emblazoned across the front just because I knew it was an expensive brand, I also purchased a Moschino T-shirt for the same reasons. I could never afford the main clothing line but the T-shirt was the ticket to a way in, you felt like you owned a smaller part of the whole. But this branding wasn’t necessarily about saying anything in particular apart from that you aspired to be someone else or possibly someone better. The lifestyle T-shirt has evolved somewhat over the years since, although it’s significance in today’s society may be in question. Shouldn’t we be more concerned with what’s happening in our world as opposed to flaunting the latest designer brand? Chris Sanderson (2013) co-director of The Future Laboratory and creative director of trend forecasting magazine Viewpoint said as such:
“As we move towards a society that is becoming more polarised, social action and political thought become more important. I believe that we are moving into a period where the frivolous and meaningless are no longer relevant or seen as fun, and I think we will see that clear demarcation of people who want to take a stand and wear something more meaningful.”

Moschino, n.d. (2019). MOSCHINO COUTURE JERSEY T-SHIRT. [Fashion]. Retrieved from https://www.moschino.com/gb_en/moschino/women/clothing/t-shirts/moschino-couture-jersey-t-shirt-46406.html.
How right he was! There will no doubt always be T-shirts that advocate a brand, but maybe today it’s the brands who need to look at themselves a little closer. If they were willing to risk association with the greater good maybe they would be perceived in a different way, but then that would be a risky strategy as they would be forever linked to that ideology.
The T-shirt as a marketing platform
Whilst studying at Uni we had a trip to the Tate Modern in Liverpool, and as a bit of a gift shop lover I was keen to see what was on offer there. I was struck by the amount of T-shirts that were available to promote the various artists that were exhibiting at the museum at that time, particularly the designs of Bridget Riley whose work was displayed on mugs, postcards and T-shirts. Clearly a marketing ploy by the museum so that the public may take away a piece of the exhibition with them. I shouldn’t have been surprised really as using the T-shirt as marketing ploy has been going on for many years. The term “Been there, done that, got the T-shirt” didn’t come from just anywhere, where it actually came from is a bit of a mystery but it means that no matter where you went there would inevitably be a T-shirt to suit the occasion. We all know that branding is a powerful medium but would we be willing to literally wear it on our chest? Julian Vogel (2013) at Modus PR seems to think we would:
“I suppose if you think of it in terms of Ralph Lauren’s Polo motif or Lacoste’s crocodile then why wouldn’t you have, for instance, your love of Coca-Cola on your chest? Corporate’s are always really excited about collaborations because it’s free advertising…and I still think the T-shirt is the garment to do that.”

Tate Shop, n.d. (2019). https://shop.tate.org.uk/vic-lee-black-t-shirt/g1020.html?cgid=t-shirts. [Fashion]. Retrieved from https://shop.tate.org.uk/vic-lee-black-t-shirt/g1020.html?cgid=t-shirts.
When we did our group presentation for our brand ‘Hud Pop’ we decided that to be more noticeable we needed to put our brand on a T-shirt. It made sense, we were talking about our brand and so displaying it on a T-shirt somehow strengthened the belief we had in it, as well as projecting a stronger message to our audience. The uniformity of that group collective made us feel more connected to what we were trying to portray.
The T-shirt as a campaigner’s medium
Sometimes a campaign can start by the means of a graphic T-shirt, not unlike the protest T-shirt, the campaigner’s T-shirt has been a powerful medium for many. Parallel’s can be drawn to the protest T-shirt however unlike the protest T-shirt - which tends to be concerning a particular point in time - the campaign T-shirt has longevity within the aim of the campaign itself. Not only does the wearer display their support and belief in the campaign but the proceeds from the sales of such go to the very cause it was created for, it’s a win win situation for all involved. Larissa Clark (2013) marketing director for the Environmental Justice Foundation says that the use of graphic T-shirts with campaigns helps push the campaign message:
“Campaigns don’t get dropped, the reality is that it is really hard to maintain the message in the media for a long period of time because the attention is all about ‘the latest’; everything has a shelf life, and so although issues are still urgent you have to reinvigorate the message and develop it and hopefully it becomes sufficiently retro that you can bring it back.”

TK Maxx, n.d. (2015). TK MAXX RED NOSE DAY 2015. [Fashion]. Retrieved from https://www.thestylerawr.com/2015/02/tk-maxx-red-nose-day-2015.html.
A little collaboration with an established designer can also go a long way in delivering a campaign message to a wider audience, such as Vivienne Westwood’s eagerness to support the charities she believes in by donating her graphic artwork to them as a means to cement the message further. Campaigns such as the yearly Red Nose day for Comic Relief employ the use of different designer collaborations each year as a marketing tool to garner interest, which they sell through high street outlets T K Maxx, Sainsbury’s and Asda. Past collaborations have included Karl Lagerfeld, Victoria Beckham, Matthew Williamson, Vivienne Westwood and more, as well as roping in the help of various Hollywood actors and homegrown stars. This collaborative strategy helps maintain the interest of the people and ensures the campaigns remains within the public’s psyche.
The T-shirt as a political platform
The rise of the political T-shirt has come from the need to facilitate our frustrations about the political climate, which has seen a lot of discourse of late. Although the use of a slogan T-shirt is not a new way of projecting our political opinions by any means, but I think since the election of President Trump in 2016 and the UK’s own farcical political endeavors have done much to aid the need to display our concerns on our chests. It is likely that our political concerns may not be heard or we may be ignored, but wearing a T-shirt which displays them surely doubles the sentiments we wish to share more than a mere placard alone. Shumon Basar (2013) art critic and editor at Tank Magazine says the slogan T-shirt can add weight to expressing our frustrations:
“I think there is something very interesting about the parallels in which capitalism proliferates through our lives throughout the world as a modern form of terrorism and for me the slogan T-shirt is the obligation to express your concerns, even is ultimately your expression is impotent. But what can you do? One of the only options is to manifest dissatisfaction and frustration and maybe for some that is through wearing the slogan T-shirt.”

Associated Press, n.d. (2018). Supporters of US President Donald Trump shouting to passing motorists as they held a ‘Make California Great Again’ rally on Saturday to support Los Angeles County Republican candidates in the California primary election. [Photograph]. Retrieved from https://www.scmp.com/news/world/united-states-canada/article/2149612/donald-trump-invokes-red-wave-us-midterm-elections.
Trumps political campaign tagline was “Make America Great Again”. For many America has always been great but he made the nation believe that there was something fundamentally wrong, and he was the only one to solve it. Of course much merchandise ensued - mainly in the form of caps and T-shirts. Through his faux pas in regards to comments on race and equality this merchandise has been adopted by far right supporters almost as battle gear for their insalubrious agendas. The political T-shirt is a great tactical item for passing on the agenda to others in a quick way. Many T-shirts are handed out at political rallies and then inevitably the T-shirt is worn back home, which then leads to more discourse - they become a voice in their own right.
0 notes
Text
Lit Review: Draft #2
I began my research with an observation of polarization within the United States’ political system. The U.S. has two political parties, Republicans and Democrats, that have historically been fiercely competitive and divided. The Encyclopedia Britannica defines the Republican Party by its belief in “laissez-faire capitalism, low taxes, and conservative social policies” (2019), and the Democratic Party by its support of “organized labour, the civil rights of minorities, and progressive reform” (2019). However, in the past few decades what once could be described as simply “disagreement” between the two has turned into a chasm, and the parties have experienced unprecedented polarization, or “concentration about opposing extremes of groups or interests formerly ranged on a continuum” (Merriam Webster Online). This led me to pose the question, What has recently caused an increase in polarization between Republicans and Democrats? I searched through scholarly articles and popular media outlets and found that most resources I encountered adhere to three main responses:
- the political system stays polarized due to fear and mistrust voters have of the opposing party (“the other”),
- extremist representatives are elected who do not advocate for the centrist views of their constituents,
- or citizens are less centrist than they are perceived to be, and they elect representatives who advocate for the extremist social and economic policies they believe should be enacted.
Fear and Mistrust
One group of research argues that political division in the U.S. has taken root due to psychological manipulation of voters through vilifying rhetoric used by Democratic and Republican candidates against the opposing party in local and national campaigns. In an article called “Political Polarization Is About Feelings, Not Facts” written by Robert B. Talisse for the National Interest, he claims that “political parties are driven to overstate their differences, stress ideological purity and vilify the opposition” (2019). He argues that politicians’ vernacular affects society and exemplifies constructivism — as they propagandize their values, ideas, and norms, citizens respond by assimilating those values, ideas, and norms into their lives and voting habits. The Annals of the American Academy of Political and Social Science (2019), also credits the rise of polarization to “polarizing political entrepreneurs [who] exploit existing grievances with Us vs. Them discourse to mobilize voters, and opposing political elites reciprocate the polarizing tactics” (Grover, 2019). Iyengar, Sood, and Lelkes (2012) agree — polarization in the U.S. has less to do with extremist policy preferences or misrepresentation of centrists by their representatives. Instead, they too fault the viciousness of campaigns for the reinforcement of negative opinions each side has of “the other.” They claim that negative opinions developed by voters of “the other” often begin in early childhood, are perpetuated by the media’s repetition of negative messages, are maintained as biases in adulthood, and cause voters and candidates alike to have strong hatred and distrust of the opposing group (Iyengar et. al., 2012).
A poll taken by U.S. adults complements this assessment and claims that at least 20% of those surveyed were willing to go so far as to label the opposition as “evil,” at least 40% labeled the opposition “spiteful,” and 50% labeled the opposition “ignorant” (Axios, 2018). These labels used to vilify “the other” are what Holland (2015) claims motivates voters to remain aligned with a particular political party. All of these scholars claim that voters may not necessarily agree with policy positions taken by “their party’s” candidates, but they will choose to align themselves against the group they find to be less trustworthy. Voters’ biases become entangled in their everyday decisions, and become a basis from which many unconsciously discriminate against “the other,” (Lyengar, Westwood, 2015) manifesting in their choice of a spouse, where they live, and who they interact with on a daily basis (Hersh, Ghitza, 2018). Each of these sources contribute to the argument that the U.S. political system remains polarized, not because of extremist representatives or division over social and economic issues, but because language and vicious campaigns have created an atmosphere of loyalizing fear.
Misrepresentation
In an interview hosted by MSNBC with former Representative Jason Altmire (D - PA), he says Americans are a people who ”find themselves waking up every day thinking about things other than politics. When they do think about it, they want a Congress that can work together, that can compromise and get things done.” In contrast to those who posit that citizens’ fear of “the other” is the country’s greatest cause of polarization, he claims that most Americans tend to be centrist and it is the representatives who are polarized. Altmire says we can see this most clearly in an uncompromising Congress, and the state of Congress exists because “we have a system where we elect people on the extremes…We’re electing people, because of our closed primary system, who are from the fringe of both political parties.” Altmire discusses the difficulties of trying to compromise with the other side during his time in office, because for the most part, those who are in leadership want representatives to “push the agenda” of their party, and representatives are willing to play along.
Altmire contributes an important perspective of first hand experience, and Poole and Rosenthal support his claim with research that shows that “at nearly every level of the political system, American politics has been polarized in ways that do not well represent the interests of middle-of-the-road voters” (pp. 1061). Their research falls in line with Altmire’s accusations against a divided congress and reiterate that “For better or for worse, constituencies are generally fought over by two opposing coalitions, liberal and conservative, each with relatively extreme views. The middle-of-the-road voter is thus not a member of a silent majority desiring some radical social change, but a moderate individual seeking to avoid the wide swings in policy engendered by our political system” (pp. 1061). Both of these sources contribute to the argument that polarization is not primarily caused by fear or by extremist citizens, but because elite representatives do not accurately represent the desires of their constituents.
Social and Economic
Another set of research claims that long-standing division over social and economic issues, intensified by the work of activists advocating for social change along party lines, is what has exacerbated polarization in recent years (Miller, Schofield, 2003). In the past century, candidates attempted to convert disaffected voters to their side by adopting social and economic issues that are important to these marginal groups and activists, regardless of whether that meant they were taking a stance typically taken by the opposing party (Miller et. al., 2003). This tactic is referred to as “flanking,” and though this caused the two parties to essentially “switch sides” over time, the chasm between them remains just as wide and keeps them from being able to reach agreements (Poole, Rosenthal, 1984). Abortion, marriage laws, mass incarceration laws, and the separation of church and state are among some of the most divisive issues that cause voters to remain loyal to their particular party rather than voting for third party candidates or along centrist lines (Robertson, 2010).
I noticed that those who place themselves in this camp also offer the most hope for decrease in polarization in the years to come. Journalist Michael Tomasky observes growth in the demographic of liberal Latino populations in swing states, namely Florida, where Republican candidates previously held more sway (2016). He claims that “opposition to immigration reform has been like glue on the far-right, helping hold factions together,” but as groups who were previously minorities begin to increase and subsequently cause a shift in the political atmosphere, this could force the Republican party to “open itself to immigration reform, specifically with a path to citizenship.” Once the “immigration reform glue” dissolves, the party could be forced to become less polarized on other issues as well in order to attract increasing numbers of minority voters (Tomasky, 2016). Others like Valerie Kaur, a “social justice activist, lawyer, filmmaker, innovator, mother and Sikh American” also offer hope for polarization caused by social and economic issues, but take a more poetic approach. At the TedWomen talk in 2017, she says that we must all use “revolutionary love” to combat division along partisan lines — we must be willing to see no stranger, tend to our opponents’ wound, and love ourselves, take deep breaths, and push through the fire of polarization. In her own experience, she has watched the impact that “tending to the wound” of the opposition can have. She is clear that tending to their wound is not “healing them,” only they can do that, but in “tending to it” through forgiveness, we are “able to see our opponents: the terrorist, the fanatic, the demagogue. They've been radicalized by cultures and policies that we together can change” (2017). Kaur emphasizes the importance of not fighting individuals across party lines, and choosing instead to “wield our swords and shields to battle bad systems, (because) that's when we (see) change” (2017).
This collection of researchers/experts/activists emphasizes the importance of disagreements about policy and how this has played a role in the polarization of the U.S. political system. In addition to giving origin explanations about the cause of polarization, this camp collectively offers the most hopeful approach to change in the future.
Conclusion
Based on research thus far, it is clear that there seems to be, at a minimum, three competing thoughts about the cause of political polarization in the U.S. There seems to be some overlap of these theories by experts, but for future research endeavors it would be beneficial to analyze the way these variables are interconnected.
Grover, J. D. (2019). How to Halt the Rise of Polarization That Imperils Our Republic. Foundation for Economic Education. Retrieved from https://fee.org/articles/how-to-halt-the-rise-of-polarization-that-imperils-our-republic/.
Hart, K. (2018, November 12). Poll: Majority of Democrats Think Republicans are "Racist," "Bigoted" or “Sexist". Axios. Retrieved from https://www.axios.com/poll-democrats-and-republicans-hate-each-other-racist-ignorant-evil-99ae7afc-5a51-42be-8ee2-3959e43ce320.html.
Hersh, E., & Ghitza, Y., (2018). Mixed Partisan Households and Electoral Participation in the United States. PLoS ONE, 13(10), E0203997.
Holland, R. (2015). Political Polarization: Why We All Can’t Just Get Along. Retrieved from https://www.forbes.com/sites/hbsworkingknowledge/2015/09/30/political-polarization-why-we-all-cant-just-get-along/.
Iyengar, S., Sood, G., & Lelkes, Y. (2012) Affect, Not Ideology: A Social Identity Perspective on Polarization, Public Opinion Quarterly, 76(3), 405–431.
Iyengar, S., & Westwood, S. (2015). Fear and Loathing across Party Lines: New Evidence on Group Polarization. American Journal of Political Science, 59(3), 690-707.
Kaur, V. (n.d.). Retrieved October 16, 2019, from https://www.ted.com/talks/valarie_kaur_3_lessons_of_revolutionary_love_in_a_time_of_rage/footnotes.
Mccoy, Jennifer & Somer, Murat. (2019). "Toward a Theory of Pernicious Polarization and How It Harms Democracies: Comparative Evidence and Possible Remedies" Forthcoming in a Special Issue of the Annals of the American Academy of Political and Social Sciences, guest editors Jennifer McCoy and Murat Somer, January 2019. The Annals of the American Academy of Political and Social Science.
Miller, G., & Schofield, N. (2003). Activists and Partisan Realignment in the United States. American Political Science Review, 97(2), 245-260. doi:10.1017/S0003055403000650.
Polarization [Def. 2b]. (n.d.) In Merriam Webster Online, Retrieved October 15, 2019, from https://www.merriam-webster.com/dictionary/polarization.
Poole, K., & Rosenthal, H. (1984). The Polarization of American Politics. The Journal of Politics, 46(4), 1061-1079.
Robertson, A. W. (2010). Political polarization. In Encyclopedia of U.S. Political History (pp. 2756-2756). Washington, DC: CQ Press doi: 10.4135/9781608712380.n740.
The Editors of Encyclopaedia Britannica. (2019, July 17). Democratic Party. Encyclopædia Britannica, inc. Retrieved from https://www.britannica.com/topic/Democratic-Party.
The Editors of Encyclopaedia Britannica. (2019). Republican Party. Encyclopædia Britannica, inc. Retrieved from https://www.britannica.com/topic/Republican-Party.
Tomasky, M. (2016, November 8). Yes, There's Hope for an End to Political Polarization in the US. Retrieved from https://ideas.ted.com/yes-theres-hope-for-an-end-to-political-polarization-in-the-us/.
(2017, December 28). Retrieved from http://www.msnbc.com/morning-joe/watch/how-the-country-became-polarized-and-what-to-do-1125279811713
0 notes
Link
UK telecoms regulator Ofcom has published a new joint report and stat-fest on Internet attitudes and usage with the national data protection watchdog, the ICO — a quantitative study to be published annually which they’re calling the Online Nation report.
The new structure hints at the direction of travel for online regulation in the UK, following government plans set out in a recent whitepaper to regulate online harms — which will include creating a new independent regulator to ensure Internet companies meet their responsibilities.
Ministers are still consulting on whether this should be a new or existing body. But both Ofcom and the ICO have relevant interests in being involved — so it’s fitting to see joint working going into this report.
“As most of us spend more time than ever online, we’re increasingly worried about harmful content — and also more likely to come across it,” writes Yih-Choung Teh, group director of strategy and research at Ofcom, in a statement. “ For most people, those risks are still outweighed by the huge benefits of the internet. And while most internet users favour tighter rules in some areas, particularly social media, people also recognise the importance of protecting free speech – which is one of the internet’s great strengths.”
While it’s not yet clear exactly what form the UK’s future Internet regulator will take, the Online Nation report does suggest a flavor of the planned focus.
The report, which is based on responses from 2,057 adult internet users and 1,001 children, flags as a top-line finding that eight in ten adults have concerns about some aspects of Internet use and further suggests the proportion of adults concerned about going online has risen from 59% to 78% since last year (though its small-print notes this result is not directly comparable with last year’s survey so “can only be interpreted as indicative”).
Another stat being highlighted is a finding that 61% of adults have had a potentially harmful online experience in the past year — rising to 79% among children (aged 12-15). (Albeit with the caveat that it’s using a “broad definition”, with experiences ranging from “mildly annoying to seriously harmful”.)
While a full 83% of polled adults are found to have expressed concern about harms to children on the Internet.
The UK government, meanwhile, has made child safety a key focus of its push to regulate online content.
At the same time the report found that most adults (59%) agree that the benefits of going online outweigh the risks, and 61% of children think the internet makes their lives better.
While Ofcom’s annual Internet reports of years past often had a fairly dry flavor, tracking usage such as time spent online on different devices and particular services, the new joint study puts more of an emphasis on attitudes to online content and how people understand (or don’t) the commercial workings of the Internet — delving into more nuanced questions, such as by asking web users whether they understand how and why their data is collected, and assessing their understanding of ad-supported business models, as well as registering relative trust in different online services’ use of personal data.
The report also assesses public support for Internet regulation — and on that front it suggests there is increased support for greater online regulation in a range of areas. Specifically it found that most adults favour tighter rules for social media sites (70% in 2019, up from 52% in 2018); video-sharing sites (64% v. 46%); and instant-messaging services (61% v. 40%).
At the same time it says nearly half (47%) of adult internet users expressed recognition that websites and social media platforms play an important role in supporting free speech — “even where some people might find content offensive”. So the subtext there is that future regulation of harmful Internet content needs to strike the right balance.
On managing personal data, the report found most Internet users (74%) say they feel confident to do so. A majority of UK adults are also happy for companies to collect their information under certain conditions — vs over a third (39%) saying they are not happy for companies to collect and use their personal information.
Those conditions look to be key, though — with only small minorities reporting they are happy for their personal data to be used to program content (17% of adult Internet users were okay with this); and to target them with ads (only 18% didn’t mind that, so most do).
Trust in online services to protect user data and/or use it responsibly also varies significantly, per the report findings — with social media definitely in the dog house on that front. “Among ten leading UK sites, trust among users of these services was highest for BBC News (67%) and Amazon (66%) and lowest for Facebook (31%) and YouTube (34%),” the report notes.
Despite low privacy trust in tech giants, more than a third (35%) of the total time spent online in the UK is on sites owned by Google or Facebook.
“This reflects the primacy of video and social media in people’s online consumption, particularly on smartphones,” it writes. “Around nine in ten internet users visit YouTube every month, spending an average of 27 minutes a day on the site. A similar number visit Facebook, spending an average of 23 minutes a day there.”
And while the report records relatively high awareness that personal data collection is happening online — finding that 71% of adults were aware of cookies being used to collect information through websites they’re browsing (falling to 60% for social media accounts; and 49% for smartphone apps) — most (69%) also reported accepting terms and conditions without reading them.
So, again, mainstream public awareness of how personal data is being used looks questionable.
The report also flags limited understanding of how search engines are funded — despite the bald fact that around half of UK online advertising revenue comes from paid-for search (£6.7BN in 2018). “[T]here is still widespread lack of understanding about how search engines are funded,” it writes. “Fifty-four per cent of adult internet users correctly said they are funded by advertising, with 18% giving an incorrect response and 28% saying they did not know.”
The report also highlights the disconnect between time spent online and digital ad revenue generated by the adtech duopoly, Google and Facebook — which it says together generated an estimated 61% of UK online advertising revenue in 2018; a share of revenue that it points out is far greater than time spent (35%) on their websites (even as those websites are the most visited by adults in the UK).
As in previous years of Ofcom ‘state of the Internet’ reports, the Online Nation study also found that Facebook use still dominates the social media landscape in the UK.
Though use of the eponymous service continues falling (from 95% of social media users in 2016 to 88% in 2018). Even as use of other Facebook-owned social properties — Instagram and WhatsApp — grew over the same period.
The report also recorded an increase in people using multiple social services — with just a fifth of social media users only using Facebook in 2018 (down from 32% in 2018). Though as noted above, Facebook still dominates time spent, clocking up way more time (~23 minutes) per user per day on average vs Snapchat (around nine minutes) and Instagram (five minutes).
A large majority (74%) of Facebook users also still check it at least once a day.
Overall, the report found that Brits have a varied online diet, though — on average spending a minute or more each day on 15 different internet sites and apps. Even as online ad revenues are not so equally distributed.
“Sites and apps that were not among the top 40 sites ranked by time spent accounted for 43% of average daily consumption,” the report notes. “Just over one in five internet users said that in the past month they had used ‘lots of websites or apps they’ve used before’ while a third (36%) said they ‘only use websites or apps they’ve used before’.”
There is also variety when it comes to how Brits search for stuff online, and while 97% of adult internet users still use search engines the report found a variety of other services also in the mix.
It found that nearly two-thirds of people (65%) go more often to specific sites to find specific things, such as a news site for news stories or a video site for videos; while 30% of respondents said they used to have a search engine as their home page but no longer do.
The high proportion of searches being registered on shopping websites/apps (61%) also looks interesting in light of the 2017 EU antitrust ruling against Google Shopping — when the European Commission found Google had demoted rival shopping comparison services in search results, while promoting its own, thereby undermining rivals’ ability to gain traffic and brand recognition.
The report findings also indicate that use of voice-based search interfaces remains relatively low in the UK, with just 10% using voice assistants on a mobile phone — and even smaller percentages tapping into smart speakers (7%) or voice AIs on connected TVs (3%).
In another finding, the report suggests recommendation engines play a major part in content discovery.
“Recommendation engines are a key way for platforms to help people discover content and products — 70% of viewing to YouTube is reportedly driven by recommendations, while 35% of what consumers purchase on Amazon comes from recommendations,” it writes.
In overarching aggregate, the report says UK adults now spend the equivalent of almost 50 days online per year.
While, each week, 44 million Brits use the internet to send or receive email; 29 million send instant messages; 30 million bank or pay bills via the internet; 27 million shop online; and 21 million people download information for work, school or university.
The full report can be found here.
from Social – TechCrunch https://tcrn.ch/2W3Yz4y
Original Content From: https://techcrunch.com
0 notes
Text
UK Internet attitudes study finds public support for social media regulation
UK telecoms regulator Ofcom has published a new joint report and stat-fest on Internet attitudes and usage with the national data protection watchdog, the ICO — a quantitative study to be published annually which they’re calling the Online Nation report.
The new structure hints at the direction of travel for online regulation in the UK, following government plans set out in a recent whitepaper to regulate online harms — which will include creating a new independent regulator to ensure Internet companies meet their responsibilities.
Ministers are still consulting on whether this should be a new or existing body. But both Ofcom and the ICO have relevant interests in being involved — so it’s fitting to see joint working going into this report.
“As most of us spend more time than ever online, we’re increasingly worried about harmful content — and also more likely to come across it,” writes Yih-Choung Teh, group director of strategy and research at Ofcom, in a statement. “ For most people, those risks are still outweighed by the huge benefits of the internet. And while most internet users favour tighter rules in some areas, particularly social media, people also recognise the importance of protecting free speech – which is one of the internet’s great strengths.”
While it’s not yet clear exactly what form the UK’s future Internet regulator will take, the Online Nation report does suggest a flavor of the planned focus.
The report, which is based on responses from 2,057 adult internet users and 1,001 children, flags as a top-line finding that eight in ten adults have concerns about some aspects of Internet use and further suggests the proportion of adults concerned about going online has risen from 59% to 78% since last year (though its small-print notes this result is not directly comparable with last year’s survey so “can only be interpreted as indicative”).
Another stat being highlighted is a finding that 61% of adults have had a potentially harmful online experience in the past year — rising to 79% among children (aged 12-15). (Albeit with the caveat that it’s using a “broad definition”, with experiences ranging from “mildly annoying to seriously harmful”.)
While a full 83% of polled adults are found to have expressed concern about harms to children on the Internet.
The UK government, meanwhile, has made child safety a key focus of its push to regulate online content.
At the same time the report found that most adults (59%) agree that the benefits of going online outweigh the risks, and 61% of children think the internet makes their lives better.
While Ofcom’s annual Internet reports of years past often had a fairly dry flavor, tracking usage such as time spent online on different devices and particular services, the new joint study puts more of an emphasis on attitudes to online content and how people understand (or don’t) the commercial workings of the Internet — delving into more nuanced questions, such as by asking web users whether they understand how and why their data is collected, and assessing their understanding of ad-supported business models, as well as registering relative trust in different online services’ use of personal data.
The report also assesses public support for Internet regulation — and on that front it suggests there is increased support for greater online regulation in a range of areas. Specifically it found that most adults favour tighter rules for social media sites (70% in 2019, up from 52% in 2018); video-sharing sites (64% v. 46%); and instant-messaging services (61% v. 40%).
At the same time it says nearly half (47%) of adult internet users expressed recognition that websites and social media platforms play an important role in supporting free speech — “even where some people might find content offensive”. So the subtext there is that future regulation of harmful Internet content needs to strike the right balance.
On managing personal data, the report found most Internet users (74%) say they feel confident to do so. A majority of UK adults are also happy for companies to collect their information under certain conditions — vs over a third (39%) saying they are not happy for companies to collect and use their personal information.
Those conditions look to be key, though — with only small minorities reporting they are happy for their personal data to be used to program content (17% of adult Internet users were okay with this); and to target them with ads (only 18% didn’t mind that, so most do).
Trust in online services to protect user data and/or use it responsibly also varies significantly, per the report findings — with social media definitely in the dog house on that front. “Among ten leading UK sites, trust among users of these services was highest for BBC News (67%) and Amazon (66%) and lowest for Facebook (31%) and YouTube (34%),” the report notes.
Despite low privacy trust in tech giants, more than a third (35%) of the total time spent online in the UK is on sites owned by Google or Facebook.
“This reflects the primacy of video and social media in people’s online consumption, particularly on smartphones,” it writes. “Around nine in ten internet users visit YouTube every month, spending an average of 27 minutes a day on the site. A similar number visit Facebook, spending an average of 23 minutes a day there.”
And while the report records relatively high awareness that personal data collection is happening online — finding that 71% of adults were aware of cookies being used to collect information through websites they’re browsing (falling to 60% for social media accounts; and 49% for smartphone apps) — most (69%) also reported accepting terms and conditions without reading them.
So, again, mainstream public awareness of how personal data is being used looks questionable.
The report also flags limited understanding of how search engines are funded — despite the bald fact that around half of UK online advertising revenue comes from paid-for search (£6.7BN in 2018). “[T]here is still widespread lack of understanding about how search engines are funded,” it writes. “Fifty-four per cent of adult internet users correctly said they are funded by advertising, with 18% giving an incorrect response and 28% saying they did not know.”
The report also highlights the disconnect between time spent online and digital ad revenue generated by the adtech duopoly, Google and Facebook — which it says together generated an estimated 61% of UK online advertising revenue in 2018; a share of revenue that it points out is far greater than time spent (35%) on their websites (even as those websites are the most visited by adults in the UK).
As in previous years of Ofcom ‘state of the Internet’ reports, the Online Nation study also found that Facebook use still dominates the social media landscape in the UK.
Though use of the eponymous service continues falling (from 95% of social media users in 2016 to 88% in 2018). Even as use of other Facebook-owned social properties — Instagram and WhatsApp — grew over the same period.
The report also recorded an increase in people using multiple social services — with just a fifth of social media users only using Facebook in 2018 (down from 32% in 2018). Though as noted above, Facebook still dominates time spent, clocking up way more time (~23 minutes) per user per day on average vs Snapchat (around nine minutes) and Instagram (five minutes).
A large majority (74%) of Facebook users also still check it at least once a day.
Overall, the report found that Brits have a varied online diet, though — on average spending a minute or more each day on 15 different internet sites and apps. Even as online ad revenues are not so equally distributed.
“Sites and apps that were not among the top 40 sites ranked by time spent accounted for 43% of average daily consumption,” the report notes. “Just over one in five internet users said that in the past month they had used ‘lots of websites or apps they’ve used before’ while a third (36%) said they ‘only use websites or apps they’ve used before’.”
There is also variety when it comes to how Brits search for stuff online, and while 97% of adult internet users still use search engines the report found a variety of other services also in the mix.
It found that nearly two-thirds of people (65%) go more often to specific sites to find specific things, such as a news site for news stories or a video site for videos; while 30% of respondents said they used to have a search engine as their home page but no longer do.
The high proportion of searches being registered on shopping websites/apps (61%) also looks interesting in light of the 2017 EU antitrust ruling against Google Shopping — when the European Commission found Google had demoted rival shopping comparison services in search results, while promoting its own, thereby undermining rivals’ ability to gain traffic and brand recognition.
The report findings also indicate that use of voice-based search interfaces remains relatively low in the UK, with just 10% using voice assistants on a mobile phone — and even smaller percentages tapping into smart speakers (7%) or voice AIs on connected TVs (3%).
In another finding, the report suggests recommendation engines play a major part in content discovery.
“Recommendation engines are a key way for platforms to help people discover content and products — 70% of viewing to YouTube is reportedly driven by recommendations, while 35% of what consumers purchase on Amazon comes from recommendations,” it writes.
In overarching aggregate, the report says UK adults now spend the equivalent of almost 50 days online per year.
While, each week, 44 million Brits use the internet to send or receive email; 29 million send instant messages; 30 million bank or pay bills via the internet; 27 million shop online; and 21 million people download information for work, school or university.
The full report can be found here.
from RSSMix.com Mix ID 8204425 https://tcrn.ch/2W3Yz4y
via IFTTT
0 notes
Text
UK Internet attitudes study finds public support for social media regulation
UK telecoms regulator Ofcom has published a new joint report and stat-fest on Internet attitudes and usage with the national data protection watchdog, the ICO — a quantitative study to be published annually which they’re calling the Online Nation report.
The new structure hints at the direction of travel for online regulation in the UK, following government plans set out in a recent whitepaper to regulate online harms — which will include creating a new independent regulator to ensure Internet companies meet their responsibilities.
Ministers are still consulting on whether this should be a new or existing body. But both Ofcom and the ICO have relevant interests in being involved — so it’s fitting to see joint working going into this report.
“As most of us spend more time than ever online, we’re increasingly worried about harmful content — and also more likely to come across it,” writes Yih-Choung Teh, group director of strategy and research at Ofcom, in a statement. “ For most people, those risks are still outweighed by the huge benefits of the internet. And while most internet users favour tighter rules in some areas, particularly social media, people also recognise the importance of protecting free speech – which is one of the internet’s great strengths.”
While it’s not yet clear exactly what form the UK’s future Internet regulator will take, the Online Nation report does suggest a flavor of the planned focus.
The report, which is based on responses from 2,057 adult internet users and 1,001 children, flags as a top-line finding that eight in ten adults have concerns about some aspects of Internet use and further suggests the proportion of adults concerned about going online has risen from 59% to 78% since last year (though its small-print notes this result is not directly comparable with last year’s survey so “can only be interpreted as indicative”).
Another stat being highlighted is a finding that 61% of adults have had a potentially harmful online experience in the past year — rising to 79% among children (aged 12-15). (Albeit with the caveat that it’s using a “broad definition”, with experiences ranging from “mildly annoying to seriously harmful”.)
While a full 83% of polled adults are found to have expressed concern about harms to children on the Internet.
The UK government, meanwhile, has made child safety a key focus of its push to regulate online content.
At the same time the report found that most adults (59%) agree that the benefits of going online outweigh the risks, and 61% of children think the internet makes their lives better.
While Ofcom’s annual Internet reports of years past often had a fairly dry flavor, tracking usage such as time spent online on different devices and particular services, the new joint study puts more of an emphasis on attitudes to online content and how people understand (or don’t) the commercial workings of the Internet — delving into more nuanced questions, such as by asking web users whether they understand how and why their data is collected, and assessing their understanding of ad-supported business models, as well as registering relative trust in different online services’ use of personal data.
The report also assesses public support for Internet regulation — and on that front it suggests there is increased support for greater online regulation in a range of areas. Specifically it found that most adults favour tighter rules for social media sites (70% in 2019, up from 52% in 2018); video-sharing sites (64% v. 46%); and instant-messaging services (61% v. 40%).
At the same time it says nearly half (47%) of adult internet users expressed recognition that websites and social media platforms play an important role in supporting free speech — “even where some people might find content offensive”. So the subtext there is that future regulation of harmful Internet content needs to strike the right balance.
On managing personal data, the report found most Internet users (74%) say they feel confident to do so. A majority of UK adults are also happy for companies to collect their information under certain conditions — vs over a third (39%) saying they are not happy for companies to collect and use their personal information.
Those conditions look to be key, though — with only small minorities reporting they are happy for their personal data to be used to program content (17% of adult Internet users were okay with this); and to target them with ads (only 18% didn’t mind that, so most do).
Trust in online services to protect user data and/or use it responsibly also varies significantly, per the report findings — with social media definitely in the dog house on that front. “Among ten leading UK sites, trust among users of these services was highest for BBC News (67%) and Amazon (66%) and lowest for Facebook (31%) and YouTube (34%),” the report notes.
Despite low privacy trust in tech giants, more than a third (35%) of the total time spent online in the UK is on sites owned by Google or Facebook.
“This reflects the primacy of video and social media in people’s online consumption, particularly on smartphones,” it writes. “Around nine in ten internet users visit YouTube every month, spending an average of 27 minutes a day on the site. A similar number visit Facebook, spending an average of 23 minutes a day there.”
And while the report records relatively high awareness that personal data collection is happening online — finding that 71% of adults were aware of cookies being used to collect information through websites they’re browsing (falling to 60% for social media accounts; and 49% for smartphone apps) — most (69%) also reported accepting terms and conditions without reading them.
So, again, mainstream public awareness of how personal data is being used looks questionable.
The report also flags limited understanding of how search engines are funded — despite the bald fact that around half of UK online advertising revenue comes from paid-for search (£6.7BN in 2018). “[T]here is still widespread lack of understanding about how search engines are funded,” it writes. “Fifty-four per cent of adult internet users correctly said they are funded by advertising, with 18% giving an incorrect response and 28% saying they did not know.”
The report also highlights the disconnect between time spent online and digital ad revenue generated by the adtech duopoly, Google and Facebook — which it says together generated an estimated 61% of UK online advertising revenue in 2018; a share of revenue that it points out is far greater than time spent (35%) on their websites (even as those websites are the most visited by adults in the UK).
As in previous years of Ofcom ‘state of the Internet’ reports, the Online Nation study also found that Facebook use still dominates the social media landscape in the UK.
Though use of the eponymous service continues falling (from 95% of social media users in 2016 to 88% in 2018). Even as use of other Facebook-owned social properties — Instagram and WhatsApp — grew over the same period.
The report also recorded an increase in people using multiple social services — with just a fifth of social media users only using Facebook in 2018 (down from 32% in 2018). Though as noted above, Facebook still dominates time spent, clocking up way more time (~23 minutes) per user per day on average vs Snapchat (around nine minutes) and Instagram (five minutes).
A large majority (74%) of Facebook users also still check it at least once a day.
Overall, the report found that Brits have a varied online diet, though — on average spending a minute or more each day on 15 different internet sites and apps. Even as online ad revenues are not so equally distributed.
“Sites and apps that were not among the top 40 sites ranked by time spent accounted for 43% of average daily consumption,” the report notes. “Just over one in five internet users said that in the past month they had used ‘lots of websites or apps they’ve used before’ while a third (36%) said they ‘only use websites or apps they’ve used before’.”
There is also variety when it comes to how Brits search for stuff online, and while 97% of adult internet users still use search engines the report found a variety of other services also in the mix.
It found that nearly two-thirds of people (65%) go more often to specific sites to find specific things, such as a news site for news stories or a video site for videos; while 30% of respondents said they used to have a search engine as their home page but no longer do.
The high proportion of searches being registered on shopping websites/apps (61%) also looks interesting in light of the 2017 EU antitrust ruling against Google Shopping — when the European Commission found Google had demoted rival shopping comparison services in search results, while promoting its own, thereby undermining rivals’ ability to gain traffic and brand recognition.
The report findings also indicate that use of voice-based search interfaces remains relatively low in the UK, with just 10% using voice assistants on a mobile phone — and even smaller percentages tapping into smart speakers (7%) or voice AIs on connected TVs (3%).
In another finding, the report suggests recommendation engines play a major part in content discovery.
“Recommendation engines are a key way for platforms to help people discover content and products — 70% of viewing to YouTube is reportedly driven by recommendations, while 35% of what consumers purchase on Amazon comes from recommendations,” it writes.
In overarching aggregate, the report says UK adults now spend the equivalent of almost 50 days online per year.
While, each week, 44 million Brits use the internet to send or receive email; 29 million send instant messages; 30 million bank or pay bills via the internet; 27 million shop online; and 21 million people download information for work, school or university.
The full report can be found here.
from iraidajzsmmwtv https://tcrn.ch/2W3Yz4y
via IFTTT
0 notes
Link
The forecasts are in, and they say the 2018 elections can go any number of ways.
If you’re following election coverage and forecasting models, you know the conventional wisdom at this point: Democrats are the favorites to take the House, and Republicans are the favorites to hold on to the Senate.
FiveThirtyEight’s “classic” forecast — which has become the gold standard in elections forecasting — gives Democrats an 85.6 percent chance of retaking the House and Republicans a 81.3 percent chance of holding the Senate, as of Tuesday evening.
So both of those are highly likely to happen, right?
Well, one person who’s been trying to complicate that assessment is FiveThirtyEight founder Nate Silver himself.
One point Silver has made over and over again in recent weeks is that even if you take his House and Senate forecasts at face value, when you think about both of them together, there’s around a 40 percent chance that one of them will be wrong.
He elaborated on this on Twitter this week, making a point that’s important to understand — that a “very normal-sized polling error” in either direction could result in a dramatically different outcome.
If polls underestimate Republicans by 2-3 points—which is a very normal-sized polling error—the House is a district-by-district nail-biter.
If polls underestimate Dems by 2-3 points, their path to victory in the Senate is much more viable; toss-ups go their way, TN/TX close etc.
— Nate Silver (@NateSilver538) October 22, 2018
Let’s pause on this. Republicans holding the Senate and narrowly holding the House would, of course, be an enormous victory for the party. Conversely, a Democratic takeover of both chambers would be a stunning win for them. Either would have seismic consequences for the Trump administration’s future.
And either of those outcomes is just “a very normal-sized polling error” away or so from happening.
These days, savvy election watchers have to keep two ideas in their heads at the same time:
The best way to get some sense of what the Election Day outcome will be is to look at polling averages or models like FiveThirtyEight’s.
But polls of state or House races often get the final margin wrong by several points, and just because a forecast shows an outcome as unlikely, that doesn’t mean it’s impossible.
In other words: uncertainty, uncertainty, uncertainty.
Before the advent of model-mania, a common way to think about polling was that if the polls are close, the race is a “toss-up,” and it could go either way. RealClearPolitics, for instance, continues to classify any race where the polls average out to a 5-point lead or less for one candidate as a toss-up, instead of making more specific forecasts of some kind.
Though based on most of the same underlying polls, FiveThirtyEight and its kin try to come up with a numerical percentage of how likely each candidate is to win, with the help of historical data and mathematical modeling.
“Almost all statistical models are grounded in history,” Silver recently explained in an appearance on The Ezra Klein Show. “The implicit idea is that you are hoping that history will repeat itself, at least in a probabilistic way.”
So they start from polling averages of the current races. They modify that a bit with certain other technical tweaks depending on the particular version of the model. For instance, in sparsely polled House races, they incorporate other polls that could be helpful (similar districts, state, or national numbers). Some versions of the model incorporate other factors that appear to be historically important, like fundraising: the “fundamentals.”
Out of all that, FiveThirtyEight calculates a candidate’s expected vote share. This looks pretty similar to a polling average — for instance, in the Florida Senate race, they show Democratic Sen. Bill Nelson leading his Republican opponent Rick Scott by 3 percentage points (as of Tuesday afternoon).
Then, though, comes the big leap. Working off that expected vote share, they simulate the election thousands of times — comparing to a wealth of historical data on how past elections turned out, and trying to incorporate uncertainty. What comes out at the other end is the candidate’s projected chance of victory. For Bill Nelson, that’s 69 percent.
Once they do that for every House and Senate race up this year, they come up with an overall estimate of the chance each party will win control of each chamber. Something like an 81.3 percent chance Republicans will keep the Senate, and an 85.6 percent chance Democrats will take the House.
An 80 percent chance of winning compared to a 20 percent chance seems like a huge advantage. Yet in commentary about their models, Silver and the rest of the FiveThirtyEight team (I recommend their podcast) repeatedly stress that an 80 percent chance of victory is not a done deal — not even close. Their argument is that an outcome that’s 20 percent likely will happen 20 percent of the time.
The most infamous example of something like this was, of course, the 2016 election. FiveThirtyEight’s model gave Hillary Clinton a 71.4 percent chance of winning, and she, er, didn’t win.
But though this put an end to the legend of Silver as the forecaster who “called” all 50 states “correctly” in 2012, he ended up something of a winner anyway. In the days before the election, even though his model showed Trump as the underdog, it gave Trump a substantially higher chance of winning than any other mainstream model out there. For that, some accused him of “panicking the world” and “putting his thumb on the scales,” and others opined he was “cautiously” trying to ensure his forecast looked right whatever happened.
The Upshot
In the days before the election, I dug into FiveThirtyEight’s modeling choices and concluded they made “a whole lot of sense.” Most broadly, I wrote, this was because “Silver’s forecast is just more uncertain that the result will match what the current polling data shows.” He understood quite well that there could be a polling error, a last-minute swing, or both.
In the end, the worst error made by other 2016 forecasters was that they drew far-too-confident conclusions from Clinton’s relatively narrow, single-digit poll leads nationally and in key swing states. Silver did not make this mistake — and so he came off looking, relatively, the best (or, as some have put it, the “least wrong”).
Still, a closer look at the FiveThirtyEight model’s pre-2016 forecasts, state by state, should be enough to give any political observer some agita as November 6 approaches.
First, let’s look at the “expected margin of victory” — the amount they thought Clinton or Trump was probably ahead in each state — as compared to Trump’s final outcome. Here I’ll look at a rather broad set of 15 swing states. (These, of course, were many of the most heavily polled races in the country.)
State 538 expected victory margin Actual outcome Who’d 538 underestimate?
State 538 expected victory margin Actual outcome Who’d 538 underestimate?
Georgia Trump +4 Trump +5.1 Trump by 1.1 Iowa Trump +2.9 Trump +9.5 Trump by 6.6 Arizona Trump +2.2 Trump +3.5 Trump by 1.3 Ohio Trump +1.9 Trump +8.1 Trump by 6.2 Florida Clinton +0.6 Trump +1.2 Trump by 1.8 North Carolina Clinton +0.7 Trump +3.7 Trump by 4.4 Nevada Clinton +1.2 Clinton +2.4 Clinton by 1.2 New Hampshire Clinton +3.6 Clinton +0.3 Trump by 3.3 Pennsylvania Clinton +3.7 Trump +0.7 Trump by 4.4 Colorado Clinton +4.1 Clinton +4.9 Clinton by 0.8 Michigan Clinton +4.2 Trump +0.3 Trump by 4.5 Maine Clinton +7.5 Clinton +2.9 Trump by 4.6 New Mexico Clinton +5.8 Clinton +8.3 Clinton by 2.5 Wisconsin Clinton +5.3 Trump +0.7 Trump by 6 Virginia Clinton +5.5 Clinton +5.4 Trump by 0.1
FiveThirtyEight
What are the takeaways?
They underestimated Trump’s margin by 6 to 6.6 points in Iowa, Ohio, and Wisconsin
They underestimated Trump’s margin by 3 to 5 points in Pennsylvania, Michigan, North Carolina, Maine, and New Hampshire
They underestimated Trump’s margin by 1 or 2 points in Georgia, Arizona, and Florida
They were within a point of the actual outcome in Virginia and Colorado
They underestimated Clinton’s margin by 1 to 3 points in Nevada and New Mexico.
So out of 15 swing states, FiveThirtyEight’s “expected margin of victory” was within a point of the outcome in just two. And it was off by more than 3 points in half of them, all in the same direction (underestimating Trump). Overall, the “misses” were enough to flip the outcome in five states: Wisconsin, Pennsylvania, Michigan, North Carolina, and Florida.
My point is not to say the model was wrong — it mainly reflects what the polls were showing, and most polls did show Clinton ahead in these states. My advice is just that you really, really should not read this margin of victory number with excessive certainty. It is usually off by a few points and often off by more than that.
So then what about the projected chance of victory in each state? On Election Day 2016, FiveThirtyEight projected the following:
State 538 chance of victory Actual outcome
State 538 chance of victory Actual outcome
Georgia Trump 79.1% Trump +5.1 Iowa Trump 69.8% Trump +9.5 Arizona Trump 66.6% Trump +3.5 Ohio Trump 64.6% Trump +8.1 Florida Clinton 55.1% Trump +1.2 North Carolina Clinton 55.5% Trump +3.7 Nevada Clinton 58.3% Clinton +2.4 New Hampshire Clinton 69.8% Clinton +0.3 Pennsylvania Clinton 77% Trump +0.7 Colorado Clinton 77.5% Clinton +4.9 Michigan Clinton 78.9% Trump +0.3 Maine Clinton 82.6% Clinton +2.9 New Mexico Clinton 82.6% Clinton +8.3 Wisconsin Clinton 83.5% Trump +0.7 Virginia Clinton 85.5% Clinton +5.4
FiveThirtyEight
The takeaways here are:
21 to 35 percent chance of Clinton winning in Georgia, Iowa, Arizona, and Ohio (all of which she lost)
55 to 58 percent chance of Clinton winning in Florida and North Carolina (which she lost) and Nevada (which she won)
69.8 percent chance of Clinton winning New Hampshire (which she barely won)
77 to 79 percent chance of Clinton winning Colorado (which she did win) and Pennsylvania and Michigan (which she lost)
82 to 86 percent chance of Clinton winning Maine, New Mexico, and Virginia (which she won) and Wisconsin (which she lost)
So the favored candidate won in 10 of these 15 swing states. Since Clinton barely had more than a 50 percent advantage in Florida and North Carolina, the biggest discrepancies are naturally the famous trio of Michigan, Pennsylvania, and Wisconsin, where practically everyone was shocked by the outcome on election night.
Do FiveThirtyEight’s 77 to 83 percent estimates of Clinton winning those three Rust Belt states look too high in retrospect? Or was this the sort of ordinary outcome we should expect from a probabilistic forecast (after all, something with a one in four chance does happen one in four times)?
I’m not a forecasting or modeling expert, and I don’t have a firm view on this. Still, when you’re poring over this year’s forecast, I think what happened last time is helpful to keep in mind — that of the seven swing states where Clinton was given a 77 to 86 percent chance of winning, she lost three.
To their credit, the FiveThirtyEight team understands all this and has been trying to sound the uncertainty alarm at every turn, rather than voicing excessive and specific certitude in their forecasts.
In their explanation of this year’s models, they write a great deal about uncertainty, and explain that they try to account for four historically common types of polling mistakes: local error (in particular states or districts), regional or demographic error, incumbency-based error, and the possibility that one party will overperform in the polls nationwide. It’s useful to think about all of these in thinking about how the polls might go awry.
For another, they made an excellent visual change. In 2016, FiveThirtyEight topped their presidential forecast with Clinton’s 71.4 percent chance of winning and Trump’s 28.6 percent chance. The visual was a long blue horizontal bar for Clinton that was far bigger than Trump’s small red one. The Senate forecast was illustrated similarly. They seemed to be geared toward answering readers’ simple and most urgent question: Who will win?
But this year’s FiveThirtyEight Senate and House models are now each topped with a bell curve of sorts, showing various possible outcomes of seats for each party and how likely they appear to be. They’ve also shaded in the middle 80 percent of the bell curve, where the likeliest outcomes lie. This is a smart way to drive home that they are not “predicting” one certain outcome here.
FiveThirtyEight
To some of FiveThirtyEight’s critics, this may seem to make their forecast maddeningly unfalsifiable. If the outcome ends up anywhere in that rather wide 80 percent confidence interval, does that mean the forecast was “accurate”?
Yet what seems far more ridiculous to me is any pretension to correctly pinpoint the outcome in every race when the polls themselves clearly cannot. And I’m glad the myth of the forecasting wizard who reads the outcomes from a crystal ball is finally a thing of the past.
Now, in an article several months back reviewing polling error, Silver crunched the numbers and concluded that “the average error in all polls conducted in the late stage of campaigns since 1998 is about 6 percentage points.” He continued:
If the average error is 6 points, that means the true, empirically derived margin of error (or 95 percent confidence interval) is closer to 14 or 15 percentage points! … This means that you shouldn’t be surprised when a candidate who had been trailing in the polls by only a few points wins a race. And in some cases, even a poll showing a 10- or 12- or 14- point lead isn’t enough to make a candidate’s lead “safe.”
Yet Silver’s conclusion from all this was that “the polls are all right” — because, well, this type of polling error is historically normal.
Yes, models like his attempt to account for all this by building in uncertainty and a wide range of potential outcomes.
Still, I look at a 6-point or so average error, and the number of close races up this year, and how dramatically they could swing the outcome in either direction — and none of this really makes me feel “all right.”
For more on election forecasting, listen to Ezra Klein’s recent interview with Nate Silver below, or at this link.
Original Source -> The terrifying uncertainty at the heart of FiveThirtyEight’s election forecasts
via The Conservative Brief
0 notes
Text
From Cold Email to Nurture: Build Momentum with Your Leads
Have you ever had to do door-to-door sales? Let me tell you, it takes a special kind of energy to just walk into a stranger’s life like that and try to get them to pick up what you’re putting down. It takes finesse and charisma to get through the door.
Once inside, a successful traveling salesperson wields the uncanny ability to quickly soak in their surroundings and use those contextual clues to their advantage. They glean what they can about their customer or host and work that into their presentation. They interact with their clients to figure out how, specifically, their product meets their clients’ needs. By the end of the visit, the unsuspecting consumer wonders how in the world they’ve lived this long without the product.
To be honest, when I think of walking up to a stranger’s door to make a pitch of some sort, I get a little sick to my stomach. Like a lot of digital folks I know, I enjoy the relative anonymity of existing behind my monitor. But it turns out that digital marketers could learn a lot from a traveling salesperson. Think about it, we have the same goals: endearing oneself to the customer to find out and relate how your product specifically meets their needs.
It takes time
Traveling salespeople generally only have one visit to go from cold call to closed case, but it’s a long visit, quite possibly hours. Digital marketers don’t have hours to sit with one customer. Or do we?
According to an Ascend2 survey, nearly half of businesses polled say most of their leads require “long cycle” nurturing involving many influencers.
In fact, research shows that prospects receive, on average, ten touches during their journey from the top of the sales funnel to closed sale.
In the long run, all those touches take time. Don’t try to rush it. Remember, it’s called lead nurturing and nurturing takes time.
Let’s see how lead nurturing can build momentum through your sales funnel.
TOP OF THE FUNNEL
In salesperson terms, the top of the funnel is where you get your foot in the door. These first touches include your cold (introductory or first) emails, social media and advertising. If you haven’t already, figure out your target buying personas and build targeted content that speaks to their needs. You’re going to need it.
He went that-a-way
When leads come through digital ads, use the information gathered from the ad placement to personalize your follow-up email. If the ad was placed on a sports site, send content geared toward the sporting aspects of your business. If the ad was placed on a fashion site, follow up with appropriately fashionable content. Use the information you have in front of you to direct your next steps.
Misery loves company
Thanks to click-thru content, emails are a great source for gleaning information for future personalization. Click-thru content provides information on the lead’s interests and perhaps the pain points to which you can speak. You know the old saying: “Misery loves company.” Voicing and addressing pain points is a number one tack for getting your foot in the “door”.
MIDDLE OF THE FUNNEL
The middle of the funnel is where your salesperson assesses the situation and gathers information they can use to better relate to the consumer. You’re already in the door, now it’s time to learn more about your lead – really see and address their needs. This is also the time to introduce more about yourself, your company, and your product. You see their needs and you just so happen to have a solution.
Put it on auto(mation) pilot
Are you using a marketing automation platform? If you’re not, you’re missing out. From campaign scheduling to persona identification and segmentation to trigger follow-up responses, marketing automation platforms offer all sorts of bells and whistles. You can have the best content ever created and it won’t amount to a hill of beans without the appropriate timing. Successful marketing requires having the right information in the right place at the right time. With automation, you can set follow-up responses based on depth and breadth of user interaction in addition to standard reaction mechanisms of landing page triggers and calls-to-action.
One of the most beautiful assets marketing automation provides is, of course, lead nurturing. BUT, did you know that they can help with multi-channel lead nurturing? Successful multi-channel lead nurturing takes into account direct sales outreach along with marketing automation, email marketing, dynamic website content, social media, and paid remarketing/re-targeting. Bringing together information from multiple channels allows you to better learn your prospect’s behaviors and interests. Then, you can turn around and use that information to send them emails, calls, or even direct mail with personalized content – think white papers, email newsletters, special deals and offers, etc.
Pulse it out
One of my favorite tongue-in-cheek lines comes from, of all places, the movie Beaches:
“But enough about me, let’s talk about you…what do you think of me?” I love how it showcases people’s innate desire to be known. Your prospect wants to be known and so do you. Not everything needs to be cloak and dagger with scouring analytics and tracking user interactions. Take the guesswork out of customization with quick pulse surveys. List a few options and ask what they’d like more information on or what interests them. This is a very straightforward way to let your leads know you care about them and want to best serve their needs.
BOTTOM OF THE FUNNEL
You’ve made it through the door and you’ve delivered your spiel. You’ve convinced your lead that they have a need and you have an answer to their need when the doorbell rings and there stands another salesperson with a similar product. The bottom of the funnel is where you give it your all to show your host why they should choose you and kick the competitor to the curb.
Rely on your relationship
By this point in your sales cycle, you should have a relationship with your lead. If you don’t, you’ve missed a step or two. Rewind and try again.
You have their email address. You know their spending habits. Heck, you could probably figure out their pay periods based on their grocery market schedule. Let me be clear: Do. Not. Do. That. There’s a difference in having access to information and exploiting information. Do not creep out your customers. Healthy relationships have boundaries. Healthy relationships are good. Be healthy. Do good.
Now that we’ve gotten that out of the way, let’s move on, shall we?
You have a relationship at this point. You and your lead have been exchanging information. Use that information (wisely) to your benefit. Put reminders and notifications in your project management software (TechnologyAdvice has recommendations for good project management tools) or CRM. Send a birthday or anniversary greeting. Give your lead a one-on-one phone call. Find out what is keeping them from closing and provide the answers they need to seal the deal.
This stage is all about breaking down barriers to meeting their needs.
Get into the nitty gritty and see what you can do. Show them you’re in their corner. You don’t need to contact them every day (see above: do not creep out your customers).
But you do need to let them know you’re there for them. Be present. Not overwhelming. Clients who know you’re there for them will be there for you.
Remember, it takes time to get there. Don’t be discouraged. Nurturing takes time. It’s worth the wait.
Author: Melissa Reinke is a writer for TechnologyAdvice.com. She is a storyteller, editor, writer, and all-around word nerd extraordinaire. She spends her days managing web content and her nights unwinding in myriad creative ways, including writing for herself and others. From personal memoirs to professional solutions, when writing and editing for others Melissa’s singular goal is to sculpt each piece into its best, most successful form while maintaining the integrity of the original voice and vision.
Related posts
9 Steps to Creating a Magnetic Blog
Customer Segmentation: The Ideal Compromise
The post From Cold Email to Nurture: Build Momentum with Your Leads appeared first on GetResponse Blog - Online Marketing Tips.
0 notes
Link
via Politics – FiveThirtyEight
Welcome to FiveThirtyEight’s weekly politics chat. The transcript below has been lightly edited.
micah (Micah Cohen, politics editor): It’s time to gaze at our navels!!! We’re chatting about the media. Everyone ready?
nrakich (Nathaniel Rakich, elections analyst): I’m not not ready.
julia_azari (Julia Azari, political science professor at Marquette University and FiveThirtyEight contributor): Technically, I’m in a different field full time, academia, where we never do any navel-gazing, sooo …
micah: On this week’s FiveThirtyEight Politics podcast, we talked about President Trump’s attacks on the press. Trump’s criticisms are mostly wrong, but the press as a whole (yes, it’s not great to lump all the media into one) does have a trust issue.
With that in mind, our mission for today: What resolutions do we think journalists (us and everyone else) should make to improve Americans’ faith in the press? Who wants to go first?
julia_azari: I nominate Perry as the seasoned press type among the three of us.
micah: Perry, Julia has thrown you under the bus!
perry (Perry Bacon Jr., senior writer): OK …
micah: I will say, to Julia’s point, I like the mix of experiences we’re bringing to this question: Julia is from academia but is obviously deeply immersed in the media world. Perry is an experienced reporter. Nathaniel is newer to journalism and comes more from an online/quanty background.
perry: The media should stop aiming for a middle or for a balance between “both sides.”
Some issues have four sides. Some have one. But there aren’t many issues with two sides, with the Democratic and Republican views equally valid.
The “both sides” model manages to annoy the left and the right, as well as undermine trust in media.
In other words, I think, for example, CNN should avoid panels of two Republicans and two Democrats giving their talking points, no matter the issue.
nrakich: The problem is: How do you assess “validity”?
micah: That’s a journalist’s entire job!
julia_azari: That’s a question — how do you assess validity — whose answer is in your process for gathering information, not in the answer itself.
micah: Julia, waddya mean by that?
julia_azari: In academia, we sometimes say “the content is the method.” Information is only as good as the method by which it was gathered. So if we’re trying to, say, assess the validity of different perspectives about immigration, you don’t just say “well here’s talking point No. 1 and here’s talking points No. 2.” Instead, you can say: “Here is a study and how it was conducted. But I also talked to 12 people who think immigration is affecting them in X way. That doesn’t mean it’s objectively true, but it’s their experience.”
I am not explaining this well.
nrakich: No, I think that’s helpful.
julia_azari: To be clear about perceptions vs. hard facts: Both are important but do different work.
And journalists could also be clearer about whether information was derived from interviews (how many), observation or a large-scale study or whatever.
nrakich: Exactly. A big part of journalism is seeking out how people perceive an issue or event — whether through interviews or polling.
perry: Let me make an aggressive statement here: We have already lost something like 30 percent of the audience, in terms of confidence in media. As a rough proxy, let’s say it’s the portion of people who said in a July Quinnipiac University poll that they trust Trump more than the media to tell the truth about important issues:
A significant bloc of conservatives are not going to tell pollsters that they trust the media — no matter what.
So I think we are really talking about, as people who might trust the media, Democrats and Jeb Bush-style Republicans. I worry that the “both sides” obsession fails in building support and trust for the media from either side: Democrats feel the media strains unfairly for balance; a lot of Republicans, I would argue, hate the media as part of their partisan identity — it’s on the other “side.” So, I don’t think that group would be placated by media moves to show it is in touch with conservatives.
nrakich: Here’s a question I’ve batted around at dinner parties (yes, I know I have no life): Do we think it would be better to return to the days when there was a liberal media and a conservative media and they were just open about it?
julia_azari: Nathaniel, does anyone answer that question, or do they just quickly move to the dessert course?
nrakich: Usually the dinner parties end when I ask that question.
julia_azari: Resolved: Nathaniel needs better friends.
nrakich: My gut instinct is that an explicitly partisan media is a bad idea. But it might very well solve some of these problems we’re talking about. The people who hate the media don’t hate ALL media — their readership could probably be retained by partisan media that agrees with them. Case in point, here are “net bias” scores from The Knight Foundation, via The Nieman Lab (positive scores mean more people think the outlet is unbiased; negative scores mean more people think the outlet is biased). Democrats are on the left, Republicans on the right:
julia_azari: Can I come back with a reframing of the question? At the risk of alienating Micah and everyone else forever.
What if the question was less, “how do we win back people who hate the media because of their partisanship,” and instead was, “how do we help people who want to like the media become more engaged consumers of it.” Or, “how do we make the product resonate more with the questions people already ask themselves and guide them to ask deeper ones.”
perry: “What resolutions do we think journalists (us and everyone else) should make to improve Americans’ faith in the press? Who wants to go first?” was Micah’s question.
As you are all saying, that question depends on which Americans we’re talking about. There are different reasons people hate the media: the Democrats (too much both sides-ism) vs. Republicans (too liberal/it is part of their party tribe to be against media). It won’t be easy for media outlets to build trust with Republicans — they’ve been told for decades that the media is against them.
nrakich: A partisan media would resonate more with people’s internal questions because they would be asking the same questions. And a responsible media outlet would guide them to those deeper questions.
julia_azari: Right. Explicit first principles like “we believe less government is better” and “we believe in reducing economic inequality” and then real reporting.
nrakich: Right — exploring WHY those principles are “good” (from their perspective) to have. Then at least people will be intellectually informed about why they believe something instead of it just being tribal.
micah: I think an explicitly partisan media structure sidesteps the problem.
Don’t we all need some agreed-upon facts?
nrakich: In this admittedly idealistic scenario, all media would still stick to the facts.
But there are some facts that support liberal positions and some that support conservative ones.
micah: Yeah, I don’t think that works.
julia_azari: Micah, do you think we have agreed-upon facts that would be assumed, or does everything have to be interrogated? (I was taught in my one journalism class to fact-check my mother’s love for me.)
micah: lol
What did you find?
julia_azari: We just took a long car trip together, so the facts are evolving.
micah: I think everything gets interrogated.
But let’s return to Perry’s resolution real quick and then go to the next one.
Perry, don’t you think this is less of an issue than it used to be?
Both-siderism, that is.
This is actually one area where I think people have improved.
perry: This is from a New York Times story about the Georgia governor’s race:
ATLANTA — The Republican won the nomination Tuesday after branding himself a politically incorrect conservative who would “round up criminal illegals” and haul them to the border in his very own pickup. The Democrat all but opened her campaign by demanding that the iconic carvings of Jefferson Davis, Robert E. Lee and Stonewall Jackson be sandblasted off Stone Mountain.
micah: Eek.
perry: The story implies both candidates are really partisan. That is a useful frame for news outlets trying to show they are not partisan. But it’s hard, and maybe this is my bias as a black person, to take that framing seriously as an example of both sides being really partisan. (How reasonable is it to expect a black candidate to not be opposed to Confederate monuments?)
Coverage around Trump himself seems less both sides-ish. But once you leave Trump, coverage of Democrats vs. Republicans has many of these problems.
micah: That’s a good point. I was thinking of coverage of Trump.
nrakich: I don’t know that it’s gotten better. I think back when politics was “normal” and Democrats and Republicans had their relatively moderate platforms, it was easier for the media to say “that comment was racist” when, say, Steve King said that Mexicans cross the border with “calves the size of cantaloupes.” But now the goalposts have moved, and the media isn’t sure what to call out as racist or sexist anymore since it’s become clear that these views are mainstream enough to get you elected president.
micah: OK, Nathaniel, you’re next. What’s your resolution?
nrakich: I kinda have two, because we haven’t already gone off on enough tangents.
More diversity in newsrooms. This one’s pretty obvious — we need people with a wider range of perspectives, including women, non-whites and conservatives.
I think the media needs to seriously beef up coverage of local politics and issues. Most governing that affects people’s lives happens at the state or local level, but local media outlets are being decimated. And state capitol bureaus are shrinking to almost nothing. That’s a real problem.
julia_azari: On No. 1, some of those groups may be at odds. Adding women and non-whites is not likely to pull a newsroom to the right.
I mean, add everyone! But that’s gonna make things interesting.
micah: For some context, this is from a report from our former colleague Farai Chideya and the Shorenstein Center on Media, Politics and Public Policy at Harvard:
julia_azari: This seems like a good time to point out that FiveThirtyEight contributor Dan Hopkins (also a political scientist) has written about how the nationalization of media has contributed to the nationalization of politics.
perry: I’m pretty opposed to calls for ideological diversity. A few reasons:
It could result in favoring whites and disfavoring minorities (blacks in particular) in hiring. Do we have a national history of discrimination against conservatives for jobs?
Also, do we want job interviews in which people are asking applicants about their ideologies? What if the person lies? And, again, that will create a racial bias. (It will be harder for a black person to credibly claim he or she voted for Trump.)
Hiring a reporter who is supposed to be for conservatives will basically force that reporter to find articles favorable to his or her team. Do you then find an explicitly pro-Democrats reporter too?
I think this kind of hiring approach would undermine the idea of nonpartisan reporting as a field with defined skills or norms, like lawyers or doctors. I believe people can be experts in their fields and put aside their personal views. I worry that when Trump attacks the lawyers on special counsel Robert Mueller’s team for having donated to Democratic candidates, he is undermining the idea that somehow these lawyers can’t separate the law from their personal opinions. You can have experts in their fields who ignore their personal views and act objectively.
julia_azari: The ideological diversity thing is a big question right now in academia, too.
micah: That’s a tough one.
julia_azari: Here’s the thing: I’m happy to have a colleague who teaches students to read the big works of libertarian economic thought. You go in a classroom and make comments about race science, and I am coming down on your ass.
micah: I think you’re right, Perry. But it’s also hard to argue with a conservative who just feels like the mainstream media is coming from a different place than he or she is.
nrakich: Very good points, Perry. I have no idea HOW you’d do it. I certainly don’t want to create litmus tests. But if The New York Times magically hired the entire staff of the National Review, I feel like conservative trust in the media would increase.
perry: It would not.
micah: Perry, why don’t you think it would?
perry: Jonathan Martin, the one of the top political reporters for the Times, used to work at National Review. So did Robert Costa, one of the lead reporters at The Washington Post.
julia_azari: There are some very smart folks at National Review. But it’s an elite publication.
nrakich: That’s a good point, Julia.
julia_azari: When we talk about distrust of elite media, that’s a populist attitude, and the point of populism is that the institutions themselves are suspect.
perry: The Weekly Standard is pretty skeptical of Trump.
nrakich: Yeah.
perry: In January 2016, National Review ran a series of essays written by prominent conservatives who were blasting Trump.
nrakich: And newspapers aren’t going to hire non-elites, nor should they be expected to. The Times should hire the best and the brightest! Even if they were all conservatives, a lot of Trump’s base would hate them.
perry: If The New York Times changed its journalism practices and, say, got rid of pieces saying that Trump is lying, that would help with conservatives. But then it wouldn’t be The New York Times, a fact-based newspaper.
julia_azari: It’s a problem when people who distrust elite media aren’t starting zines or indie blogs, but rather watching Infowars. Or consuming other non-factual or racially inflammatory material.
nrakich: It kinda goes to the point that maybe the true divide in this country isn’t Democrat vs. Republican, it’s elite vs. non-elite. Bernie Sanders’s and Trump’s rhetoric (if not positions) kind of wrapped around to the point of almost touching in a lot of ways.
julia_azari: Also, how many people on this chat have a degree from Harvard or Yale?
nrakich: 75 percent.
micah: Not me. I barely graduated from college.
perry: I think I object to this framing too. I, a black person from a working-class area in Louisville, got on the path to get this job in large part because I went to Yale. That credential really helps in an elite field like this. I was not vacationing on Cape Cod as a kid.
julia_azari: I technically have three degrees from Yale (but a B.A. from a state school), so I’ll see myself to the guillotine.
micah: But Perry’s right that the standards are different.
perry: Here’s an idea: What if publications, instead of having a program of specifically hiring conservatives, had beats like rural policy, religion, regulation and family development. (I know there are some religion reporters, but maybe we need more of them and at every outlet.) That would diversify their coverage. Which is what I care about.
nrakich: I really like that idea.
julia_azari: That is an excellent idea.
perry: Part of this is how news organizations hire. “The race reporter” is maybe not going to be a conservative, but the religion reporter will understand how deep and sincere opposition to abortion is among religious conservatives.
micah: It would diversify coverage and expose a mostly cosmopolitan reporting force to new worlds — which probably would have some effect in making them more conservative, honestly.
julia_azari: This again is true about academia. People who write on religion and, say, the military are probably still often left of center, but they are a lot more sympathetic to certain perspectives than a randomly selected social scientist.
nrakich: This also goes to my resolution about local media.
micah: Yeah.
perry: Right, the rural reporter would be more likely to work in Iowa than Seattle.
micah: OK, we gotta move on to Julia’s.
julia_azari: My resolution is that we should be more attentive to power dynamics when we write.
micah: I like this one.
julia_azari: This is a set of growing pains that academia had to deal with and still does — primarily that when you write about someone, you attain a certain power to tell their story. How do you do rigorous work while simultaneously allowing people to tell their own stories? This set of questions is really for writing about people who are marginalized, not for reporting on powerful officials.
How would we want to be written about if we were the subject of the story? Is it respectful?
But also I need to slag on WaPo.
micah: Haha … go on.
julia_azari: This piece — about white workers who feel like they’re in the minority working at a chicken plant — got a lot of pushback (some of which the Post published).
This is the kind of story where you need to tread a delicate line between letting people tell their stories as they see them and questioning concepts like the sense of entitlement to be in the majority or surrounded by people who share your language.
So you want to ask multidimensional questions about what kinds of power different people have.
perry: My objection to that piece is that I think its genesis was an attempt at balance — i.e, “if we do stories about how ICE mistreats some undocumented immigrants,” we need to do this one too. The subtext is: “Conservatives/whites/rural people have problems too.”
julia_azari: I read it more sinisterly than that, to be honest. I read it as centering white perspectives in a way that was worse than both-sidesism.
micah: Julia, are there concrete things that journalists can do to better account for power dynamics? I just worry “think about power dynamics” is hard to put into action?
julia_azari: I’m an academic, as we said at the top. I don’t do “action.”
micah: Haha.
OK, we gotta wrap.
I had a couple, but maybe we don’t have time.
perry: I would love to hear them
Maybe we quickly weigh in on them?
micah: OK, real quick …
micah: 1. Do a better job. I don’t mean this flippantly. A huge share of journalism is sloppy or ill-conceived or surface-level. Much of that is unintentional or seemingly unavoidable — deadlines, resources, etc. But not all those factors are set in stone. I’m pretty sure that newsrooms could put in place some incentives to just improve the quality of their work by, say, 30 percent.
nrakich: Employ fact-checkers! We have a phenomenal copy desk (hi, guys!). Other places I’ve written for haven’t had nearly as stringent a fact-checking layer in the editing process.
micah: 2. Be more transparent. This is really the big one for me. Treat the reader/viewer as an equal, explain how you’re doing the work you’re doing. Explain what assumptions you’re making and what you don’t know.
perry: Endorse both of Micah’s
julia_azari: Same!
perry: No. 1 is hard to define, but I see bad work all the time (and produce some of it myself). And I just wish editors were stepping in more at times.
nrakich: As for No. 2, I agree, obviously. I feel like the mindset for a lot of places is to be the “expert” and insist to their readers that they know what they’re doing, even if they’re a lot less sure themselves. I agree that it’s OK to say, “Hey, we’re not sure about X, but maybe it’s a thing?”
julia_azari: Agreed.
nrakich: As we like to say here at FiveThirtyEight, get comfortable with uncertainty.
Not every article has to come to a firm conclusion.
micah: Being able to say “we’re not sure about this” is a huge advantage, and — going back to No. 1 — removes an incentive that pushes people toward crappy work.
Also, more transparency shows readers/viewers that we’re just people trying to do a job.
julia_azari: Can I add something to kinda maybe answer the “what do we do about power dynamics” question?
micah: Take us home, Julia.
julia_azari: Warm, fuzzy feature pieces need more analytical framework, IMO. Why has employment changed in certain circumstances? How does the rate of immigrants in community X compare to surrounding ones?
Put people’s stories into a more structural context, highlighting how something like state budgets or other policies might affect what people are facing. Framing a piece like a biography puts too much emphasis on both individual experience and individual responsibility for circumstances. These are part of bigger — and often more technical — stories. I’m not saying that some journalists aren’t already doing this, but in my opinion, some of the stock frames for pieces need an update.
If that makes any sense.
You have a lot of efforts to humanize policy. Maybe policy-ize humanity.
1 note
·
View note
Text
How FiveThirtyEight’s House Model Works
We’ve been publishing election models for more than 10 years now, and FiveThirtyEight’s 2018 House model is probably the most work we’ve ever put into one of them. That’s mostly because it just uses a lot of data. We collected data for all 435 congressional districts in every House race since 1998, and we’ve left few stones unturned, researching everything from how changes in district boundary lines could affect incumbents in Pennsylvania to how ranked-choice voting could change outcomes in Maine.
Not all of that detail is apparent upon launch. You can see the topline national numbers, as well as a forecast of the outcome in each district. But we’ll be adding a lot more features within the next few weeks, including detailed pages for each district. You may want to clip and save this methodology guide for then. In the meantime, here’s a fairly detailed glimpse at how the model works.
Overview
The principles behind the House forecast should be familiar to FiveThirtyEight readers. It takes lots of polls, performs various types of adjustments to them, and then blends them with other kinds of empirically useful indicators (what we sometimes call “the fundamentals”) to forecast each race. Then it accounts for the uncertainty in the forecast and simulates the election thousands of times. Our models are probabilistic in nature; we do a lot of thinking about these probabilities,and the goal is to develop probabilistic estimates that hold up well under real-world conditions. For instance, Democrats’ chances of winning the House are between 7 in 10 and 3 in 4 in the various versions of the model upon launch — right about what Hillary Clinton’s chances were on election night two years ago! — so ignore those probabilities at your peril.
Nonetheless, if you’re used to the taste of our presidential forecasts, the House model will have a different flavor to it in two important respects:
As compared with the presidential model, the House model is less polling-centric. Instead, it uses a broader consensus of indicators. That’s partly out of necessity: House districts don’t get much polling, and the polling they do get often isn’t much good. It’s also partly out of opportunity: With 435 separate races every other year, it’s possible to make fairly robust empirical assessments of which factors really predict House races well and which don’t.
House races are far more localized than presidential races, and this is reflected in the design of the model. In presidential elections, outcomes are extremely correlated from state to state. It wasn’t a surprise that President Trump won Michigan given that he also won demographically similar states such as Wisconsin and Pennsylvania, for instance. Sometimes that sort of thing happens in congressional elections too; although Democrats are favored in our initial forecast, even a relatively minor polling error could tilt the race back toward Republicans. Nonetheless, about three-quarters of the uncertainty in the House forecasts comes from local, district-by-district factors. If the presidential model is laser-focused on how the polls are changing from day to day and what they say about the Electoral College, the House model’s approach is more diffuse, with the goal being to shine some light into the darker corners of the electoral landscape.
Three versions of the model: Lite, Classic, Deluxe
In 2016, we published what we described as two different election models: “polls-only” and “polls-plus.”6 This year, we’re running what we think of as three different versions of the same model, which we call Lite, Classic and Deluxe. I realize that’s a subtle distinction — different models versus different versions of the same model.
But the Lite, Classic and Deluxe versions of the House model somewhat literally build on top of one another, like different layers of toppings on an increasingly fancy burger. I’ll describe these methods in more detail in the sections below. First, a high-level overview of what the different versions account for.
The layers in FiveThirtyEight’s House forecast
Which versions use it? Layer Description Lite Classic Deluxe 1a Polling District-by-district polling, adjusted for house effects and other factors. ✓ ✓ ✓ 1b CANTOR A system which infers results for districts with little or no polling from comparable districts that do have polling. ✓ ✓ ✓ 2 Fundamentals Non-polling factors such as fundraising and past election results that historically help in predicting congressional races. ✓ ✓ 3 Expert forecasts Ratings of each race published by the Cook Political Report, Inside Elections and Sabato’s Crystal Ball ✓
Lite is as close as you get to a “polls-only” version of the forecast — except, the problem is that a lot of congressional districts have little or no polling. So it uses a system we created called CANTOR7 to fill in the blanks. It uses polls from districts that have polling, as well as national generic ballot polls, to infer what the polls would say in districts that don’t have polling.
The Classic version also uses local polls8 but layers a bunch of non-polling factors on top of it, the most important of which are incumbency, past voting history in the district, fundraising and the generic ballot. These are the “fundamentals.” The more polling in a district, the more heavily Classic relies on the polls as opposed to the “fundamentals.” Although Lite isn’t quite as simple as it sounds, the Classic model is definitely toward the complex side of the spectrum. With that said, it should theoretically increase accuracy. In the training data,9 Classic miscalled 3.3 percent of races, compared with 3.8 percent for Lite.10 You should think of Classic as the preferred or default version of FiveThirtyEight’s forecast unless we otherwise specify.
Finally, there’s the Deluxe flavor of the model, which takes everything in Classic and sprinkles in one more key ingredient: expert ratings. Specifically, Deluxe uses the race ratings from the Cook Political Report, Nathan Gonzales’s Inside Elections and Sabato’s Crystal Ball, all of which have published forecasts for many years and have an impressive track record of accuracy.11
Within-sample accuracy of forecasting methods
Share of races called correctly based on House elections from 1998 to 2016
Forecast 100 Days Before Election Election Day Lite model (poll-driven) 94.2% 96.2% Fundamentals alone 95.4 95.7 Classic model (Lite model + fundamentals) 95.4 96.7 Expert ratings alone* 94.8 96.6 Deluxe model (Classic model + expert ratings) 95.7 96.9
* Based on the average ratings from Cook Political Report, Inside Elections/The Rothenberg Political Report, Sabato’s Crystal Ball and CQ Politics. Where the expert rating averages out to an exact toss-up, the experts are given credit for half a win.
So if we expect the Deluxe forecast to be (slightly) more accurate, why do we consider Classic to be our preferred version, as I described above? Basically, because we think it’s kind of cheating to borrow other people’s forecasts and make them part of our own. Some of the fun of doing this is in seeing how our rigid but rigorous algorithm stacks up against more open-ended but subjective ways of forecasting the races. If our lives depended on calling the maximum number of races correctly, however, we’d go with Deluxe.
Collecting, weighting and adjusting polls
Our House forecasts use almost all the polls we can find, including partisan polls put out by campaigns or other interested parties. (We have not traditionally used partisan polls in our Senate or presidential forecasts, but they are a necessary evil for the House.) However, as polling has gotten more complex, including attempts to create fake polls, there are an increasing number of exceptions:
We don’t use polls if we have significant concerns about their veracity or if the pollster is known to have faked polls before.
We don’t use DIY polls commissioned by nonprofessional hobbyists on online platforms such as Google Surveys. (This is a change in policy since 2016. Professional or campaign polls using these platforms are still fine.)
We don’t treat subsamples of multistate polls as individual “polls” unless certain conditions are met.12
We don’t use “polls” that blend or smooth their data using methods such as MRP. These can be perfectly fine techniques — but if you implement them, you’re really running a model rather than a poll. We want to do the blending and smoothing ourselves rather than inputting other people’s models into ours.
These cases are rare — so if you don’t see a poll on our “latest polls” page, there’s a good chance that we’ve simply missed it. (House polls can be a lot harder to track down than presidential ones.) Please drop us a line if there’s a poll you think we’ve missed.
Polls are weighted based on their sample size, their recency and their pollster rating (which in turn is based on the past accuracy of the pollster, as well as its methodology). These weights are determined by algorithm; we aren’t sticking our fingers in the wind and rating polls on a case-by-case basis. In a slight change this year, the algorithm emphasizes the diversity of polls more than it has in the past; in any particular race, it will insist on constructing an average of polls from at least two or three distinct polling firms even if some of the polls are less recent.
There are also three types of adjustments to each poll:
First, a likely voter adjustment takes the results of polls of registered voters or all adults and attempts to translate them to a likely-voter basis. Traditionally, Republican candidates gain ground in likely voter polls relative to registered voter ones, but the gains are smaller in midterms with a Republican president. Furthermore, some polls this year actually show Democrats gaining in likely voter models. The likely voter adjustment is dynamic; it starts with a prior that likely voter polls slightly help Republicans, but this prior is updated as pollsters publish polls that directly compare likely and registered voter results. (If you’re a pollster, please follow Monmouth University’s lead and do this!) In mid-August, for example, the model treats likely-voter and registered-voter polls as roughly equivalent to each other, but this could change as we collect more data.
Second, a timeline adjustment adjusts for the timing of the poll, based on changes in the generic congressional ballot. For instance, if Democrats have gained a net of 5 percentage points on the generic ballot since a certain district was polled, the model will adjust the poll upward toward the Democratic candidate (but not by the full 5 points; instead, by roughly half that amount — 2.5 points — depending on the elasticity score13 of the district). As compared with the timeline adjustment in our presidential model, which can be notoriously aggressive, the one in the House model is pretty conservative.14
A house effects adjustment corrects for persistent statistical bias from a pollster. For instance, if a polling firm consistently shows results that are 2 points more favorable for Democrats than other polls of the same district, the adjustment will shift the poll part of the way back toward Republicans.15
The House model does use partisan and campaign polls, which typically make up something like half of the overall sample of congressional district polling. Partisanship is determined by who sponsors the poll, rather than who conducts it. Polls are considered partisan if they’re conducted on behalf of a candidate, party, campaign committee, or PAC, super PAC, 501(c)(4), 501(c)(5) or 501(c)(6) organization that conducts a large majority of its political activity on behalf of one political party.
Partisan polls are subject to somewhat different treatment than nonpartisan polls in the model. They receive a lower weight, as partisan-sponsored polls are historically less accurate. And the house effects adjustment starts out with a prior that assumes these polls are biased by about 4 percentage points toward their preferred candidate or party. If a pollster publishing ostensibly partisan polls consistently has results that are similar to nonpartisan polls of the same districts, the prior will eventually be overridden.
CANTOR: Analysis of polls in similar districts
CANTOR is essentially PECOTA or CARMELO (the baseball and basketball player forecasting systems we designed) for congressional districts. It uses a k-nearest neighbors algorithm to identify similar congressional districts based on a variety of demographic,16 geographic17 and political18 factors. For instance, the district where I was born, Michigan 8, is most comparable to other upper-middle-income Midwestern districts such as Ohio 12, Indiana 5 and Minnesota 2 that similarly contain a sprawling mix of suburbs, exurbs and small towns.
The goal of CANTOR is to impute what polling would say in unpolled or lightly polled districts, given what it says in similar districts. It attempts to accomplish this goal in two stages. First, it comes up with an initial guesstimate of what the polls would say based solely on FiveThirtyEight’s partisan lean metric (FiveThirtyEight’s version of a partisan voting index, which is compiled based on voting for president and state legislature) and incumbency. For instance, if Republican incumbents are polling poorly in the districts where we have polling, it will assume that Republican incumbents in unpolled districts are vulnerable as well. Then, it adjusts the initial estimate based on the district-by-district similarity scores. For instance, that Republican incumbent Carlos Curbelo is polling surprisingly well in Florida’s 26th Congressional District will also help Republicans in similar congressional districts.
All of this sounds pretty cool, but there’s one big drawback. Namely, there’s a lot of selection bias in which districts are polled. A House district usually gets surveyed only if one of the campaigns or a media organization has reason to think the race is close — so unpolled districts are less competitive than you’d infer from demographically similar districts that do have polls. CANTOR projections are adjusted to account for this.
Overall, CANTOR is an interesting method that heavily leans into district polling and gets as close as possible to a “polls-only” view of the race. However, in terms of accuracy, it is generally inferior to using …
The fundamentals
The data-rich environment in House elections — 435 individual races every other year, compared with just one race every four years for the presidency — is most beneficial when it comes to identifying reliable non-polling factors for forecasting races. There’s enough data, in fact, that rather than using all districts to determine which factors were most predictive, I instead focused the analysis on competitive races (using a fairly broad definition of “competitive”). In competitive districts with incumbents, the following factors have historically best predicted election results, in roughly declining order of importance:
The incumbent’s margin of victory in his or her previous election, adjusted for the national political environment and whom the candidate was running against in the prior election.
The generic congressional ballot.
Fundraising, based on the share of individual contributions for the incumbent and the challenger as of the most recent filing period.19
FiveThirtyEight partisan lean, which is based on how a district voted in the past two presidential elections and (in a new twist this year) state legislative elections. In our partisan lean formula, 50 percent of the weight is given to the 2016 presidential elections, 25 percent to the 2012 presidential election and 25 percent to state legislative elections.
Congressional approval ratings, which are a measure of the overall attitude toward incumbents.20
Whether either the incumbent or the challenger was involved in a scandal.
The incumbent’s roll call voting record — specifically, how often the incumbent voted with his or her party in the past three Congresses. “Maverick-y” incumbents who break party ranks more often outperform those who don’t.
Finally, the political experience level of the challenger, based on whether the challenger has held elected office before.
In addition, in Pennsylvania, which underwent redistricting in 2018, the model accounts for the degree of population overlap between the incumbent’s old and new district. And in California and Washington state, it accounts for the results of those states’ top-two primaries.
In open-seat races, the model uses the factors from the list above that aren’t dependant on incumbency, namely the generic ballot, fundraising, FiveThirtyEight partisan lean, scandals, experience and (where applicable) top-two primary results. It also uses the results of the previous congressional election in the district, but this is a much less reliable indicator than when an incumbent is running for re-election.
But wait — there’s more! In addition to combining polls and fundamentals, the Classic model compares its current estimate of the national political climate to a prior based on the results of congressional elections since 1946, accounting for historic swings in midterms years and presidential approval ratings. This prior has little effect on the projections this year, however, as it implies that Democrats should be ahead by about 8 points in the popular vote — similar to what the generic ballot and other indicators show.21 To put it another way, the results we’re seeing in the data so far are consistent with what’s usually happened in midterms under unpopular presidents.
Incorporating expert ratings
Compared with the other steps, incorporating expert ratings and creating the Deluxe version of the model is fairly straightforward. We have a comprehensive database of ratings from Cook and other groups since 1998, so we can look up how a given rating corresponded, on average, with a margin of victory. For instance, candidates who were deemed to be “likely” winners in their races won by an average of about 12 points:
What do ratings like “lean Republican” really mean?
Expert Rating Average margin of victory Toss-up 0 points “Tilts” toward candidate 4 points “Leans” toward candidate 7 points “Likely” for candidate 12 points “Solid” or “safe” for candidate 34 points
Based on House races since 1998.
But, of course, there are complications. One is that there’s an awful lot of territory covered by the “solid” and “safe” categories: everything from races that could almost be considered competitive to others where the incumbent wins every year by a 70-point margin. Therefore, the Deluxe forecast doesn’t adjust its projections much when it encounters “solid” or “safe” ratings from the experts, except in cases where the rating comes as a surprise because other factors indicate that the race should be competitive.
Also, although the expert raters are really quite outstanding at identifying “micro” conditions on the ground, including factors that might otherwise be hard to measure, they tend to be lagging indicators of the macro political environment. Several of the expert raters shifted their projections sharply toward the Democrats throughout 2018, for instance, even though the generic ballot has been fairly steady over that period.22 Thus, the Deluxe forecast tries to blend the relative order of races implied by the expert ratings with the Classic model’s data-driven estimate of national political conditions. Deluxe and Classic will usually produce relatively similar forecasts of the overall number of seats gained or lost by a party, therefore, even though they may have sharp disagreements on individual races.
Simulating the election and accounting for uncertainty
Sometimes what seem like incredibly pedantic questions can turn out to be important. For years, we’ve tried to design models that account for the complicated, correlated structure of error and uncertainty in election forecasting. Specifically, that if a candidate or a party overperforms the polls in one swing state, they’re also likely to do so in other states, especially if they’re demographically similar. Understanding this principle was key to understanding why Clinton’s lead wasn’t nearly as safe as it seemed in 2016.
Fortunately, this is less of a problem in constructing a House forecast; there are different candidates on the ballot in every district, instead of just one presidential race, and the model relies on a variety of inputs, instead of depending so heavily on polls. Nonetheless, the model accounts for four potential types of error in an attempt to self-diagnose the various ways in which it could go off the rails:
First, there’s local error — that is, error pertaining to individual districts. Forecasts are more error-prone in districts where there’s less polling or in districts where the various indicators disagree with one another. (In West Virginia 3, for example, the fundamentals regression thinks Democrat Richard Ojeda should be a huge underdog — but the only poll of the race has him ahead!) Some districts are also swingier (or more elastic) than others; conditions tend to change fairly quickly in New Hampshire, for instance, but more slowly in the South, where electorates are often bifurcated between very liberal and very conservative voters.
Second, there’s error based on regional or demographic characteristics. For instance, it’s possible that Democrats will systematically underperform expectations in districts with large numbers of Hispanic voters or overperform them in the rural Midwest. The model uses CANTOR similarity scores to simulate these possibilities.
Third, there can be error driven by incumbency status. In some past elections, polls have systematically underestimated Republican incumbents, for example, even if they were fairly accurate in open-seat races. The model accounts for this possibility as well.
Fourth and finally, the model accounts for the possibility of a uniform national swing — i.e., when the polls are systematically off in one party’s direction in almost every race.
Error becomes smaller as Election Day approaches. In particular, there’s less possibility of a sharp national swing as you get nearer to the election because there’s less time for news events to intervene.
Nonetheless, you shouldn’t expect pinpoint precision in a House forecast, and models that purport to provide it are either fooling you or fooling themselves. Even if you knew exactly what national conditions were, there would still be a lot of uncertainty based on how individual races play out.
Related: Politics Podcast
Politics Podcast: Let's Talk About The 2018 House Forecast
Odds and ends
OK, that’s almost everything. Just a few final notes:
We’ve made educated guesses about the identity of the nominees in states that haven’t yet held their primaries. We’ll definitely be wrong about a few of these, and we’ll change them once the primaries are held. For the time being, we’re also assuming that incumbent Republican Chris Collins will successfully be able to withdraw from the race in New York’s 27th District, but we’ll reinsert him if it looks like he won’t be able to.
Once we publish the race-by-race pages, you’ll notice that we also project turnout in each district, based on factors such as the citizen voting-age population and turnout in past midterms and presidential races. This is important in understanding the relationship between the national popular vote and the number of seats that each party might gain or lose. As of forecast launch, our model implies that Democrats would need to win the House popular vote by 5 to 6 percentage points to have a break-even chance of winning a majority of seats.
Finally, I should emphasize that we do not make ad-hoc adjustments to the forecasts in individual races. They’re all done strictly by algorithm. Nor do we implement major changes in the program once the model has been released. With that said, we will correct bugs, especially in the first week or two after the model is out.23 So if you see something that looks awry, please just let us know.
from News About Sports https://fivethirtyeight.com/features/2018-house-forecast-methodology/
0 notes
Text
The Next Recession Is Closer Than You Think
New Post has been published on http://foursprout.com/wealth/the-next-recession-is-closer-than-you-think/
The Next Recession Is Closer Than You Think
Authored by Peter Cook via RealInvestmentAdvice.com,
If a Hall Of Fame existed for financial beliefs, “market-timing is impossible” would rank right up there with “diversification is the only free lunch in finance.” These statements have been validated by a large volume of peer-reviewed academic studies, so it is widely believed that there is no need to question their legitimacy. Although the declining value of diversification was addressed in Diversification Can’t Cure Overvaluation Disease, this article concerns the issue of market-timing for investment portfolios.
First, almost all investors are likely to agree that market-timing, as defined over short-term intervals and based on observed historical patterns, is impossible. In reality, financial markets are enormously complex systems in which a multitude of investors buy and sell in different magnitudes for different reasons on different days. On top of that, investors may respond (or be forced to respond) differently to a specific stimulus over time. While some investors may be able to make excess profits based on known anomalies (e.g., seasonality, small capitalization, valuation, momentum) over long periods of time, even these anomalies are unreliable over shorter periods of time. If some investors can create excess short-term trading profits, they probably do so because of structural advantages (e.g., informational advantages of market-making, or detecting and front-running corporate buyback programs). If anyone can create short-term excess profits without those advantages, these precious few certainly don’t and won’t advertise how they achieve their success, which means the rest of us might as well continue to assume it is impossible.
In contrast, the study of longer-term business cycles is valuable for the simple reason that business cycles drive capital markets cycles. Business cycles run for periods of years, not days, weeks, or months. So business cycle analysis is different from the common definition of market-timing because it is concerned with a much longer time horizon. It is difficult for anyone other than politicians to deny the existence of a business cycle, which includes both an expansion and a recession phase because they are a fact of economic life. A recent Goldman Sachs research piece not only acknowledges the existence of cycles but divides them into four phases and produces recommended asset allocations for each phase, as shown below.
Goldman’s investment recommendation for 2018 is based on the belief that 2018 lies within Phase 3, in which the economy is operating above capacity and growing. More broadly, Goldman’s chart and table show that identifying the Phases is a crucial determinant of investment success. For example, if 2018 truly lies within Phase 4, cash and bonds would outperform commodities and equities. The Fed appears to agree with Goldman’s analysis of Phase 3, based on its simultaneous campaigns to lift the Fed Funds rate and to reduce the size of its bond holdings that were acquired during its QE experiment.
In another admission that business cycles exist, Bank of America/Merrill Lynch (BAML) produces a monthly Fund Manager Survey, in which it asks the largest institutional investment managers a simple question; where are we in the business cycle? The results from the past decade are shown below.
Beginning with the most recent results, a majority of institutional investors currently believe the global economy is “late-cycle” (gold line), which is an analog for Goldman’s Phase 3. In fact, this belief has been in existence since early 2016, and the belief has increased in popularity over the last six months or so. For most of the period from 2010-2016, a majority of investors believed “mid-cycle” (blue line) was the best description for the state of the global economy, which is an analog for Goldman’s Phase 2. In 2009, investors didn’t believe the economy was either in mid-cycle or late-cycle, a fact that will be addressed later in this article. In 2008, 70% of investors believed the global economy was in late-cycle, and relatively few believed the global economy was mid-cycle, which are similar to the current percentages.
Summarizing the results of the chart above, the investors polled by BAML have thus far been largely correct in their assessment of the state of the global economy. They correctly identified the economy was late-cycle on the eve of the recession of 2008-09, correctly identified an upswing in the business cycle in early 2010. Whether they are correct that 2016-2018 is late-cycle (Phase 3) is plausible but remains to be seen.
The BAML survey extends further back than 2008, so we can get a better idea of investors’ beliefs leading to the recession of 2008-09, as shown below. During these years, investors were given two other choices to describe the economy; early-cycle or recession. A majority of investors believed the economy was late-cycle beginning in 2005, with a peak in that belief occurring in late 2007 (thin black line), which coincided with a continuous decline in the percentage believing the economy was mid-cycle. During the period 2005-2007, almost no investors believed that the economy was in either in its early-cycle or recession.
By late 2008, investors believed that a late-cycle economy was giving way to a period of recession, as shown by the decline in the black line and ascendance of the red line. By late 2009, a majority of investors began to describe the economy as early-cycle, as indicated by the ascendant green line.
Summarizing, investors were largely correct in describing the state of the global economy in the years leading up to the recession. They began to believe the economy had moved into late-cycle by 2005, a couple of years before the recession struck in December 2007. By late 2008, they began to understand the economy was in recession, and by mid-2009, they understood the economy was early-cycle, which occurs after recessions.
Furthermore, investors seem to firmly grasp the sequence of the phases of the business cycle, as evidenced by the sequential peaks in the black, red, green, and blue lines during the period of 2007-2012. That is, it makes sense that a peak in late-cycle would be followed by a recession, which would be followed by early-cycle and then mid-cycle.
Investment Implications for 2018
If Goldman is correct that the economy is in Phase 3, and the BAML investor survey is correct that the global economy has been in late-cycle since 2016, then the next stage of the business cycle will be a recession (Phase 4). However, the timing of a potential recession is uncertain. What isn’t uncertain and of utmost importance to investors is that the performance of asset classes is radically different in Phase 3 than in Phase 4. It is also not uncertain that economists will be blindsided by any impending recession, just as has occurred before all of the eleven post-WWII recessions.
With the preceding knowledge, an investor should probably be reducing exposure to equities, precisely at a time when persuasive narratives exist to keep an equity investor in the game (e.g., great earnings reports, globally synchronized growth, fiscal stimulus, etc.). That is not easy to do.
Can we get more specific on the timing? Interestingly, a majority of the BAML investor survey voted for late-cycle beginning in late 2005, or a couple of years ahead of the recession that began in late 2007. This time around, voting for late-cycle became a majority in early 2016, which is about two years ago. So, in each of these two periods, it isn’t a surprise to investors that the economic expansion is long in the tooth, or that a recession will be coming next. But it is unlikely that recessions will always follow precisely two years after investors declare a beginning to late-cycle.
The question of timing can also be addressed by the fact that both periods (2005-2007 and 2016-2018) share a common fundamental characteristic; in both periods the Fed persistently raised interest rates while the price of crude oil more than doubled. Every single recession since 1970 has been preceded by a sharp rise in the cost of money and the cost of energy, as explained here (LINK). It appears that a rise in oil is perceived as inflationary by the Fed, which then raises rates to counteract inflation. But business owners and consumers, operating in the real world, see the rising costs of energy and interest on debt as costs they must offset by cutting other areas, whether that be in business expenses such as headcount or advertising, or discretionary consumption for consumers. That process sows the seeds of recession.
The main question a long-only investor must answer in 2018 is how long Phase 3 (late-cycle) will persist. If an investor assumes it will persist for several more years, then a large allocation to equity and commodities should provide superior performance. If the end of Phase 3 is coming soon, those allocations will likely perform relatively poorly. The following argue for a sooner end to Phase 3:
The BAML investor survey has described the economy as late-cycle for two years
Crude oil has almost tripled over the past two years
The Fed has been raising the Fed Funds rate for three years, and is planning to continue down that path
The Fed has further tightened liquidity by reducing their balance sheet which in turn decreases the money supply
On the other hand, it is possible that the economy will overcome sharp increases in short-term interest rates and oil prices, delaying the transition from Phase 3 to Phase 4, and extending the stock market advance. But given the historical record of recessions since 1970 and the investor survey results from 2005-2008, that is a low-probability bet.
Another potential outcome is possible for investors who can implement hedging and/or short sales to their investment strategies. During both Phase 3 and 4, commodities outperform equities by ~15% per annum. If Goldman is correct that we are in Phase 3 on the way to Phase 4, AND if historical performance patterns hold, then a long commodities/short equities investment strategy might be rewarding. In that case, correctly identifying whether the economy is in Phase 3 or 4 is far more important than precisely timing the transition from Phase 3 to Phase 4.
Conclusions
Business cycles exist, and the progression through phases of the business cycle is recognized by institutional investors
Business cycles drive financial market cycles, as demonstrated by the radically different pattern of asset class performance during the different phases of the business cycle
Economists’ views on the potential for a recession will probably be inadequate because they have been unable to predict any Post-WWII recession, so it is unlikely they will do so now
A majority of BAML’s institutional investors have correctly described the state of the economy over the past 15 years, although they also were late in recognizing the recession of 2008-09
For the past two years, BAML’s investors have described the global economy as late-cycle, reaching a recent peak of 70+%. The length and magnitude of late-cycle consensus also occurred from 2005-08, which increases the probability of a transition to recession in 2018 or 2019
The combination of sharply rising costs for money and energy, which occurred before each recession since 1970, increases the probability of a transition to recession in 2018 or 2019
The increasing probability of recession should be reflected in the structure of investment portfolios, either by reducing equity exposure or by implementing a long commodity/short equity strategy.
0 notes
Text
The Generic Is Falling! The Generic Is Falling!
The Generic Is Falling! The Generic Is Falling! By Stuart Rothenberg
I hear it all the time these days. The Democratic electoral wave is petering out. The generic ballot shows the Democrats’ advantage is cratering. President Donald Trump’s job approval ratings are up. Voters are giving the president more and more credit for the economy’s strength. Lighten up, political junkies, the election is not until November. Today’s generic may not be tomorrow’s.
Moreover, the Democrats remain well-positioned to benefit from an electoral wave. This column focuses on the generic ballot, as reported and averaged by RealClearPolitics.
Although various surveys report different results, the generic ballot probably now sits in the mid-single digits, in the 5- to 8-point range.
There was a point in mid-December when a series of polls showed Democrats with a big advantage in the generic ballot.
Consecutive polls released by Quinnipiac (+15 points, +12 points), CNN (+18 points), NBC News/Wall Street Journal (+11 points), PPP (+11 points) and Marist (+13 points) showed Democrats with a double-digit lead on the question.
For those using those polls as a starting point, the generic has tightened.
But the evidence is more complicated, and the warnings of the Democrats’ weakening position overblown.
There were 15 polls conducted between early December and early February that showed a double-digit advantage for Democrats — almost half of them, seven, came from Quinnipiac.
Quinnipiac’s generic advantage numbers have been relatively consistent (and within the margin of error) over the last two months.
Just as important, they have almost always showed a much larger Democratic advantage than other nonpartisan surveys:
Nov. 29-Dec. 4, Democrats +14
Dec. 6-11, Democrats +12
Dec. 12-18, Democrats +15
Jan. 5-9, Democrats +17
Jan. 12-16, Democrats +11
Jan. 19-23, Democrats +13
Feb. 2-5, Democrats +9
The February number was certainly down a few points, especially from early January. But given margins of error and the impact of news and short-term events on the public, the general direction of Quinnipiac’s polling is clear and consistent.
According to Quinnipiac, Democrats have had and continue to have a considerable advantage in the generic ballot (if the numbers accurately reflect the sentiments of registered voters, of course).
Deeper dive
Let’s compare the Quinnipiac numbers to those from Monmouth University.
Monmouth released two surveys between early December and early February. The December survey (Dec. 10-12) found Democrats with a 15-point advantage in the generic ballot, while the late January survey (Jan. 28-30) showed the party holding a mere 2-point edge.
You can conclude either that the Democrats’ generic advantage has collapsed or, alternatively, that one or both of the numbers did not accurately reflect where registered voters stood at that time.
For me, the choice isn’t close. I’ll select the second alternative. Public opinion rarely moves so dramatically in seven weeks.
Let’s look at the generic ballot questions in the Economist/YouGov online surveys from late November to early February. Five additional surveys during that same period showed the same trend. (The Economist Group is the parent company of Roll Call.)
Nov. 26-28, Democrats +6
Dec. 10-12, Democrats +8
Dec. 17-19, Democrats +9
Jan. 8-9, Democrats +7
Jan. 14-16, Democrats +6
Jan. 28-30, Democrats +5
Feb. 4-6, Democrats +6
No wild swings. No dramatic movement. Just a consistent mid- to high-single-digit advantage.
The narrow range doesn’t prove that the numbers are correct, but at the very least they raise questions about the “sky is falling” assessment.
Let’s compare the Economist/YouGov surveys to CNN’s, which asked the generic three times between October and January, a slightly earlier period than the other polls I’ve been discussing.
An Oct. 12-15 CNN poll found the Democrats with a 16-point advantage in the generic (54 percent to 38 percent).
In mid-December, the Democrats’ advantage grew to 18 points (56 percent to 38 percent).
And in the most recent poll (Jan. 14-18), the Democratic advantage plunged to 5 points (49 percent to 44 percent).
Again, you can believe the Democrats’ position in the generic has absolutely cratered, or you can be skeptical — as I am — that the mid- to high-teens advantages accurately portrayed where the cycle was.
Finally, let me turn to my favorite survey over the years, the one from NBC News and The Wall Street Journal.
An Oct. 23-26 NBC News/Wall Street Journal poll had the Democrats with a 7-point generic ballot advantage.
In mid-December, that advantage spiked to 11 points. And in mid-January, it was back down to a modest 6 points.
Do those three surveys show movement, or, given that they all were well within the margin of error, is the difference just noise? I don’t think we can know for sure without looking at them in the larger context.
The sky is not falling
After examining all of the data on RealClearPolitics, including individual surveys from various organizations, I’m inclined to conclude that the Democrats’ advantage in the generic has generally been in the middle to upper single digits except, possibly, for a short-lived spike in mid-December.
I would not be surprised if we see another spike or two (in one direction or the other), but count me as skeptical that the sky is falling for Democrats.
The warnings that Democrats can’t take a wave for granted and don’t have the House locked up in November strike me as wise. It is still early.
But waves usually don’t develop until the midterm year, so the fact that the Democratic advantage isn’t in the double digits now is not especially important.
During 2005, the year before the Democratic midterm wave, the NBC News/Wall Street Journal generic ballot favored the Democrats by anywhere from 5 to 11 points.
In January 2006, the survey showed Democrats with a 9-point advantage.
In March, the party’s advantage grew to 13 points, but one month later, it fell to a mere 6 points (45 percent to 39 percent).
I expect that at that point some Democrats and many journalists were issuing dire warnings about the party’s prospects.
As we know, the Democratic generic ballot advantage in the NBC News/Wall Street Journal poll jumped back up to double digits in June 2006, and the Democrats eventually won the House in November, with the last NBC News/Wall Street Journal generic ballot showing a lead in the mid-teens.
So what should you take from all of this?
The abundance of polls has not made our political crystal balls clearer. We have more data, but they often seem contradictory.
We still have to figure out which numbers are accurate and what they mean.
There are now so many polls asking the generic ballot question that even people who should know better end up making comparisons across surveys.
The most recent poll gets all of the hype, no matter whether it seems to fit comfortably with other data and real news events.
And the generic ballot is just one measure of the two parties’ strengths during the cycle, which is why any analysis should look at multiple indicators, including multiple poll questions, fundraising numbers, measures of enthusiasm, candidate recruitment and district-level survey data in competitive seats.
So watch the generic ballot, but don’t become a prisoner to it.
Democratic prospects of taking over the House are not measurably worse than they were a month or two ago. Indeed, there are plenty of reasons to believe that they are better and improving.
View Article at Inside Elections
http://ift.tt/2HAn6YV
0 notes
Last Seen Blogs

nashirasauce
⋆☆⋆☆⋆☆⋆☆⋆☆⋆☆⋆☆⋆

palindrome-chan
Wait, what?


intersection-of-art-and-science
Intersection of Art and Science