#...what the diagram DOES and how it visually indicates a pattern was helpful <3
Text
Another bonus to learning a fiber art is being able to speak to others in a Lovecraftian language that nobody else understands...
...and also being able to read things like THIS:

#art#crochet#fiber art#described images#image description in alt#used a crochet pattern for this because it's just INSANE#see i can recognize some of these stitch markings but i haven't done them all yet#i actually kind of prefer the diagram pattern because it actually shows you the shape and the way stitches compliment the piece#with a 'normal' pattern (e.g. 1 dc in fifth ch from hook ch 2 4 dc) i understand it sure but. it isn't the same.#i was reading somebodys recommendations for tapestry yarn and understood all the abbreviations and what they mean#plus i feel like diagrams can be a great way to teach you not only how stitches look but how they contribute to the larger piece#one of my crochet proficiency goals is to be able to look at a piece and know instantly what made it#*cue me at the store analyzing a crochet piece so i can replicate it for 5× the cost*#if you're selling a crocheted piece for like $20 then it's my imperative to replicate it and not buy it 🫡#i think that has the same moral implication as like... 'proplifting'#did crochet as the example because thats what i do as a fiber art. if theres a similar thing for knit/weave/ect then DROP IT BELOW I BEG YO#i want to learn all the lovecraftian languages of the fiber artists <3#i feel like describing the image in exactly what stitch marking indicates what would have been too much so hopefully the explanation as to..#...what the diagram DOES and how it visually indicates a pattern was helpful <3
817 notes
·
View notes
Text
Journal reading 2
Trends expert interview
Talking with trends experts to learn about latest developments and possible futures.
Benefits
Facilitates quick and early discovery
Brings in new perspectives
Captures knowledge
Input
Project's topic
Pool of trend experts
Output
Understanding of trends and growth factors
Areas for further research
What it does:
Helps one quickly learn about trends related to a topic. Speaking with experts like futurists, economists, professors, authors, and researchers, who stay on top of what is happening in a specific topic area, can very quickly reveal valuable insights. Speaking with them also provides guidance for where to look for additional information.
How it works:
1) Determine the topics to be understood
2) Identify experts
3) Make preparations for the interview
4) Conduct the interview
5) Listen, capture and follow up
6) Transcribe and summarise
Keyword Bibliometrics
Using keywords for researching spread of ideas among publications
and databases.
Benefits:
Processes large sets of data
Reveals patterns
Encourages comprehensiveness
Input:
Set of keywords related to specific topics
Identified specialised database
Output:
Insights and patterns revealed by the search on the specific topics.
What it does:
Keyword Bibliometrics is a method adapted from library and information sciences used in researching the spread of ideas among publications and databases in fields such as science, medicine, economics, and technology. Keyword Bibliometrics operate like search engines. It uses keywords to search through huge databases to find relevant articles and writings. The list of documents generated through a search is analysed to understand the nature of what is being written about the topic or uncover emergent non-obvious relationships.
How it works:
1) Determine keywords that will be searched
2) Consider the time period that will be searched
3) Combine keywords to find overlaps
4) Review returned results and reiterate if needed
5) Summarise findings
Ten types of innovation framework
Understanding the nature of different types of innovations in industries
Benefits
Broadens mindset
Encourages comprehensiveness
Shows best practices
Facilitates comparison
Provides organising structure
Input
Identified industries, organisations, and their innovations relevant to the project’s topic
Output
Understanding of how the different types of innovation are playing a role in the studied industries
What it does
The Ten Types of Innovation Framework, developed by Doblin, is a method for surveying an industry (or sometimes an economic sector or an individual organisation) to understand and plot different types of innovations. The method also helps us with what to look at more closely, where the innovation trends are in the industry, and where to direct forthcoming research efforts. The framework proposes that regardless of industry, innovations happen in one of four areas: finance, process, offering, and delivery. Among the four areas can be found ten distinct types of innovations. In the fi nance area, there are business model and networking innovations. Process innovations include both core processes and enabling processes—an organisations new ways for developing their offerings. Innovations in the offering area are product performance, product systems, and service. Delivery includes innovation types like channel, brand, or customer experience.
How it works:
1) Gather information about the industry
2) Search for innovations in the industry and organise them.
3) Make a visual diagram of innovations
4) Find insights, share and discuss opportunities
Innovation landscape
Mapping an industry's range of innovations as it grows over time.
Benefits
Creates overview
Facilitates comparison
Maps change over time
Reveals opportunities
Input
Identified industries relevant to the project's topic
Output
Visual representations of innovation activities in industries over time
Indications of where innovation opportunities exist
What it does:
The Innovation Landscape is a diagnostic method that applies Doblin’s Ten Types of Innovation Framework to understand the broader patterns of innovations in industries over time. The method creates a three-dimensional terrain map by plotting the type of innovation on the X-axis, time on the Y-axis, and number of occurrences of innovation activities as the height dimension.
The ten types of innovations plotted are in finance (business models, networking), process (enabling, core), offering (product performance, product system, service), and delivery (channel, brand, customer experience). The landscape shows the intensity of innovation activities by the height of the peaks, the diversity by the number of peaks, and the pace of change by how many new peaks form and by the change of their slopes.
How it works:
1) Select the industry and identify databases to be searched
2) Specify keywords and the time period to be searched
3) Search the databases to compile results
4) Visualise the results as a terrain map
5) Discuss the patterns and explore opportunities
Trends Matrix
Summarising changes happening today that lead to a future direction.
Benefits
Creates overview
Maps change over time
Encourages comprehensiveness
Reveals opportunities
Defines direction
Input
Project aspects to be studied
Output
Matrix with an organised set of trends
Insights about trend patterns and possible directions
What it does
A trends matrix presents a high-level summary of how trends and forces of change affect technology, business, people, culture, and policy. The matrix offers an at a glance understanding of how trends impact your project. For a project on cultural travel, one might study travel tools, travel-related services, travel experiences, travel information, and other similar aspects.
How it works:
1) Set up the dimensions for the Trends Matrix
2) Fill the matrix with relevant trends
3) Take a step back and discuss the matrix as an overview
4) Capture insights as overlays on the matrix
Convergence map
Visualising converging fields and seeing opportunities for innovation at the overlaps.
Benefits
Visualises data
Reveals opportunities
Reveals relationships
Promotes shared understanding
Input
Data from research about trends and innovations in selected topics
Outputs
Visual map showing where topics are converging and the related trends affecting them
What it does
The Convergence Map makes visible how areas of daily life (work-life, home-life, mobile communications, etc.) or industries are beginning to overlap more an how new behaviours are emerging because of this dynamic.
How it works
1) Identify topics for creating the Convergence Map
2) Identify trends and innovations in these topics
3) Build a Venn diagram showing overlapping regions
4) Discuss and identify opportunities
From… To exploration
Moving from a current perspective based on conventions to a new perspective based on trends
Benefits
Challenges assumptions
Identifies opportunities
Gives focus to the process
Input
List of key aspects of the project
Understanding of key trends related to the project
Output
Table with conventions, trends and possibilities
Innovation opportuntities
What it does
From . . .To Exploration is a method that helps turn a current perspective into a new perspective for solving problems. It is about challenging orthodoxies, questioning why things are the way they are, exploring possibilities, and making suggestions. Based on a good understanding of the latest trends, the method proposes how the current context may be changed for the better.
How it works
1) List the key aspects of the project
2) Identify trends related to the project aspects
3) Describe current perspectives based on conventions
4) Describe new perspectives based on trends
5) Discuss innovation opportunities
Initial opportunity map
Speculating on an opportunity space to move to in relation to the current position.
Benefits
Visualises information
Facilities comparison
Reveals opportunities
Defines direction
Input
Trends relevant to the industry to be considered
Output
Visual map of industry participants and potential opportunity spaces for innovation.
What it does
The Initial Opportunity Map helps you explore possible opportunities for your organisation’s innovations on a 2x2 map. The map uses two key dimensions that
are found to be strategically signifi cant to the project based on a deep understanding of the trends and other changes taking place. Plotted on the map are various participants operating in that space. The map shows your organisation in relation to others and can support speculations on where opportunities exist for your organisation to move. During the early stage of an innovation project, this method helps explore the fundamental question of strategy: Where to play?
How it works
1) Identify key dimensions
2) Create a map and plot industry participants
3) Discuss the map and identify opportunity spaces
4) Speculate on innovation opportunities.
0 notes
Text
Introduction
Higher-Dimensional Space
The world around us exists in 3-dimensional (3D) space. There are 3 pairs of cardinal directions: left and right, forward and backward, and up and down. All other directions are simply combinations of these fundamental directions. Mathematically, these pairs of directions correspond with three coordinate axes, which are conventionally labelled X, Y, and Z, respectively.

The arrows in the diagram indicate which directions are considered numerically positive and which are negative. By convention, right is positive X, left is negative X, forward is positive Y, backward is negative Y, and up is positive Z, and down is negative Z. We shall refer to these directions as +X, -X, +Y, -Y, +Z, and -Z, respectively. The point where the coordinate axes intersect is called the origin.
As far as we know, the space we inhabit consists of these 3 dimensions, and no more. We may think that space has to be 3-dimensional, that it can't possibly be anything else. Physically, this may be true, but mathematically, there is nothing special about the number 3 that makes it the only possible number of dimensions space can have. It is possible to have dimensions lower than 3: for example, 1D space consists of a single straight line stretching off to infinity at either end; and 2D space consists of a flat plane, extending in length and width indefinitely. However, nothing about geometry restricts us to 3 dimensions or less. It is quite possible—and mathematically straightforward—to deal with geometry in more than 3 spatial dimensions. In particular, we can have a 4th spatial dimension that lies perpendicular to all 3 of the familiar cardinal directions in our world. The space described by these 4 dimensions is called 4-dimensional space, or 4D space for short.
In a 4D world, there is another directional axis which is perpendicular to the X, Y, and Z axes. We shall label this axis W, and call the direction along this axis the fourth direction. This new axis also has positive and negative directions, which we shall refer to as +W and -W.

It is important to understand that the W-axis as depicted here is perpendicular to all of the other coordinate axes. We may be tempted to try to point in the direction of W, but this is impossible because we are confined to 3-dimensional space.
Why Bother?
Why bother trying to visualize a higher-dimensional space that we can neither experience nor access directly? Besides pure curiosity, 4D visualization has a wide variety of useful applications.
Mathematicians have long wondered how to visualize 4D space. In calculus, a very useful method of understanding functions is to graph them. We can plot a real-valued function of one variable on a piece of graph paper, which is 2D. We can also plot a real-valued function of two variables using a 3D graph. However, we run into trouble with even the simplest complex-valued function of 1 complex argument: every complex number has two parts, the real part and the imaginary part, and requires 2 dimensions to be fully depicted. This means that we need 4 dimensions to plot the graph of the complex function. But to see the resulting graph, one must be able to visualize 4D.
Einstein's theory of Special Relativity postulates that space and time are interrelated, forming a space-time continuum of 3 spatial dimensions and 1 temporal dimension. While it is possible to visualize space-time simply by treating time as time and examining “snapshots” of space-time objects at various points in time, it is also useful to treat space-time geometrically. For example, the distance between two events is the distance between two 4D points. The light-cone also has a particular shape that can only be adequately visualized as a 4D object.
Furthermore, Einstein's theory of General Relativity describes curvature in space-time. While it may not actually be a curvature into a physical spatial dimension, it is helpful to visualize it as such, so that we can see how space curves in 4D as a 3-manifold. If space in the universe had positive curvature, for example, it would be in the shape of a 4D hypersphere—but what exactly does that look like?
Many other interesting mathematical objects also require 4D visualization to be appreciated fully. Among them are 4D polytopes (4D equivalents of polyhedra), topological objects such as the 3-torus and the Real Projective Plane which can only be embedded without self-intersection in 4D or higher, and the quaternions, which are useful for representing 3D rotations. It is difficult to fully appreciate these objects without being able to see them in their native space.
Is it possible to visualize 4D?
Some believe that it is impossible for us to visualize 4D, since we are confined to 3D and therefore cannot directly experience it. However, it is possible to develop a good idea of what 4D objects look like: the key lies in the fact that to see N dimensions, one only needs an (N-1)-dimensional retina.
Even though we are 3D beings who live in a 3D world, our eyes actually only see in 2D. Our retina has only a 2D surface area with which it can detect light coming into our eye. What our eye sees is in fact not 3D, but a 2D projection of the 3D world we are looking at.
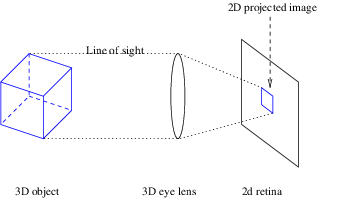
In spite of this, we are quite able to grasp the concept of 3D. Our mind is quite facile at reconstructing a 3D model of the world around us from the 2D images seen by our retina. It does this by using indirect information in the 2D images such as light and shade, parallax, and previous experience. Even though our retina doesn't actually see 3D depth, we instinctively infer it. We have a very good intuitive grasp of what 3D is, to the point that we are normally quite unconscious of the fact we're only seeing in 2D.
Similarly, a hypothetical 4D being would have a 3D retina, and would see the 4D world as 3D projections.

It would not directly see the 4th dimension, but would infer it using indirect information such as light and shade, parallax, and previous experience.
The key here is that what the 4D being sees in its retina is 3-dimensional, not 4-dimensional. The 4th dimension is inferred. But since we have a good intuitive grasp of 3D, it is not that difficult to understand what a 4D being sees in its retina. From there, we just need to learn how to infer 4D depth.
The rest of this document will describe in detail the basic principles of 4D visualization, as well as provide a number of examples of 4D objects. We shall take a purely geometrical approach and treat all 4 dimensions as spatial dimensions.
Dimensional Analogy
A very useful tool in exploring 4D, or higher dimensions in general, is dimensional analogy. Dimensional analogy is the process of examining how a particular geometric feature in a lower dimension relates to an equivalent geometric feature in our dimension, and then applying the same principle to relate our dimension to a higher one.
Let's examine a few examples to see how this works.
Boundaries of Objects
Let's begin with the very basics. Let's start in a 1D world. The 1D world is like a piece of string. There is only one axis along which one may move along this string, the X-axis. The only dimension any object can have is length, because there aren't any other dimensions to accomodate width or height. So the only possible objects in 1D are points, which are 0D, and lines, which are 1D.

In order to completely specify a line segment, it is enough to specify its starting point and its ending point. In other words, the boundary of an object in 1D consists of points, which are 0D.
Now, let's move to the next higher dimension. The 2D world is a plane, like the surface of a piece of paper, but extending indefinitely in width and length. The 2D world is much more interesting than the 1D world, because a much larger variety of objects are possible. For example, we can have polygons and circles, in addition to points and lines:

What is the boundary of a polygon? A polygon is bounded by line segments, which are 1D. A circle also has a 1D boundary: even though it is a curved boundary, it is fully specified by a single parameter: angle. So 2D objects are bounded by 1D lines and curves.
Now let's move on to the 3D world. Objects in the 3D world are bounded not by lines or curves, but by 2D surfaces. For example, a cube is bounded by 6 squares, and a ball is bounded by a spherical surface. The spherical surface is 2D, because any point on the sphere is fully specified by only two parameters: longitude and latitude.

We can see a pattern emerge here. Objects in 1D are bounded by 0D points; objects in 2D are bounded by 1D lines (or curves); and objects in 3D are bounded by 2D surfaces. In other words, points in 1D are analogous to lines and curves in 2D: they form the boundaries of objects in the respective dimensions. Similarly, bounding lines and curves in 2D are analogous to surfaces in 3D. So, by applying dimensional analogy, we see that in N dimensions, objects are bounded by (N-1)-dimensional boundaries.
This leads us to conclude that in 4D, objects are bounded not by points, lines, nor even surfaces, but volumes. It would be rather difficult to realize this without applying dimensional analogy. For example, as we shall see later, a 4D cube is bounded by 8 cubes. We call these bounding volumes the cells of the 4D cube.
Vision
Another application of dimensional analogy that has been mentioned before is the dimension of the retina in the eye of an N-dimensional creature. We are 3D beings, yet our eyes only see in 2D because our retina is only a 2D array of light-sensitive cells.
Why are our retinas only 2D? Surely it would be much better for us to have a 3D retina, so that we can see every part of our 3D world simultaneously?
The reason is that in order for us to see something, light must have an unobstructed path from that thing to the cells in our retina. A 2D retina works, because there is a 3rd dimension in which the light can travel unobstructed from the object onto the retina. However, if our retina were 3D, we would not see anything more, because light must pass the cells on the outer surface in order to reach the inner cells, so that what the inner cells see has already been seen by the outer cells. Since we are confined to 3D, there is no additional dimension in which light may travel to reach these inner cells by an independent path, which might have given us additional visual information.
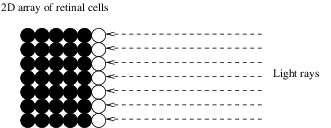
This fact leads us to conclude, by dimensional analogy, that a 2D creature must only have a 1D retina. As the diagram above shows, when a creature is confined to 2D, there is no unobstructed path for light to travel from a 2D object to an inner cell in a 2D retina. Any light that reaches an inner cell has already passed an outer cell, so having a 2D retina would not help the creature to see more.
We can also conclude by dimensional analogy that in 4D, it is possible to have a 3D retina, because there is now an extra dimension in which light can travel unobstructed from the object being seen to any point on the retina.
We shall make much use of dimensional analogy to understand 4D in the subsequent discussions.
On the Nature of Vision
Since we're interested in visualizing 4D, let's take a more careful look at vision itself.
A Deficient Vision
As mentioned in the previous chapter, we 3D beings have a 2D retina, whereas a hypothetical 2D being only has a 1D retina. We are able to see the entirety of a 2D image, whereas a 2D being can only see a 1D projection of it at a time. For example, when we look at a square, we see this:

Since a square is a 2D object, and 2D beings are obviously familiar with 2D objects, we may think that this is how a 2D being would see a square, too.
However, when a 2D being looks at the same square, it actually sees only this:

This thin line is actually the square viewed edge-on. This is the only view the 2D being can have of the square, because it is unable to leave the 2D plane and observe the square from a 3D point of view.
When we 3D beings look at the square from our 3D vantage point, we can see all 4 edges of the square and all 4 corners at the same time. But the 2D being can see at most only two of the square's edges. It would need to walk around the square and look at it from different angles before it can see all 4 edges and all 4 corners.
Furthermore, it may not be able to tell from a single glance whether something is a square or something else, say a pentagon. It may be able to infer the 2D slope of the edges from the way light falling on the edge illuminates it, and, by doing so for each of the edges, infer that they are meeting at right angles, and thus deduce that the object is likely to be a square. However, it would need to walk around the object and look at it thoroughly before it could be sure that it's a square and not some other shape.
Why is this important?
The Appearance of Diagrams
This seemingly trivial point has far-reaching consequences when learning to visualize higher dimensions. To see why this is so, consider how we 3D beings may try to explain what a cube is to a 2D being. We may try to draw a diagram of a cube, thus:

Since this diagram can be entirely contained in a 2D surface, we may imagine that the 2D being would see it as we do: a hexagon with three lines within, meeting at the center. However, this is what the 2D being actually sees:

If you look at this line very carefully, you will notice subtle variations in shading, based on which the 2D being can tell the edges apart. At most two or three of the outer edges of the diagram can be seen at a time. Even after walking around the diagram and looking at it from every angle, the most the 2D being can discern is that the diagram is a hexagon: it cannot see the three edges inside the diagram at all!
To help our 2D being see the entire diagram, we would need to erase parts of the edges so that it can walk into the hexagon and explore the 3 quadrilateral “rooms” within it, thus forming a kind of mental “floor plan” of our diagram. Alternatively, we would have to construct the outer edges of the hexagon with some semi-transparent material, so that the 2D being can see through it and discern the 3 inner edges.
In other words, what is to us an obvious diagram of a cube is far from obvious from the 2D being's point of view. We see the diagram of the cube from our “overhead” 3D point of view, and can see every part of it simultaneously. The 2D being has no such luxury; it has to painstakingly explore each part of the diagram separately, and concessions such as holes in edges through which it can pass, or transparency in some of its edges, must be made in order to ease this process.
Floor Plans
Why should we care about a hypothetical 2D being's deficient vision, since we 3D beings do not suffer from such crippling limitations? This is because a similar situation applies to us when we attempt to visualize higher dimensions.
As we begin to explore the methods of visualizing 4D, we will be making much use of 3D diagrams and images that depict higher-dimensional objects—much like our diagram of the cube above is a 2D depiction of the cube, not the 3D cube itself. However, we can't draw 3D diagrams on a 2D computer screen, and even if we could, our eyes can only see a 2D representation of them at a time. So we are in a similar situation to the 2D being looking at a 2D diagram: we can only see a 2D representation of the 3D diagram, not the 3D diagram itself.
This point is vitally important to keep in mind as we begin to explore 4D visualization. The 2D images we will see may depict some 3D construct; it is crucial not to conflate the 2D images with the 3D construct that they are intended to convey. The 2D being looking at our diagram of a cube sees only a single line, which is of no help in understanding what a cube is. Similarly, a mere 2D image for us is of no help in understanding higher-dimensional objects either.
What is needed, in the case of the 2D being, is to explore the diagram thoroughly, and form a mental picture of the “floor plan” of the diagram, so to speak. It is this mental floor plan—a hexagon with three edges inside it, or rather, a hexagon made of three adjoining quadrilaterals—that gives the 2D being a glimpse into the nature of the cube.
Similarly, when we look at 2D representations of 3D diagrams, we need to understand that the 2D images themselves are not an adequate depiction of the higher-dimensional object. What is needed in our case is to form, in our mind, a “3D floor plan” of the 3D diagram being conveyed by the 2D images. It is this 3D mental model, not the 2D images themselves, that gives us a glimpse into the nature of the higher-dimensional object. Merely staring at the 2D images, as compelling as they may be, will not magically cause us to see 4D.
Keeping this in mind, let us now begin to look at some of the tools by which we may study the 4D world.
Cross-sections
Using Cross-sections
Since we are creatures confined to 3D, we have no way of directly exploring higher-dimensional objects. We can, however, employ various indirect means to study and understand them. One method is to intersect a higher-dimensional object with our world to see what its various cross-sections look like.
To illustrate this, let's apply dimensional analogy again. Suppose we are only 2D beings, living in a 2D world, and unable to see into the 3rd dimension. Suppose we're trying to understand what a cylinder is. We know what circles and squares are, because these objects exist in our 2D world and we can directly handle and see them. But we haven't the slightest idea what a cylinder might be. We have no way of directly seeing such an object, because our retina is only 1D, and a 2D retina is needed to adequately perceive a 3D object. What we can do, is to examine what happens when a cylinder passes through our 2D world:

As the cylinder does this, we can observe its cross-sections with our planar world. For example, if the cylinder descends through our world vertically, we would see a series of circular cross-sections, all of a constant size.

Now, as we have mentioned in the previous chapter, 2D beings cannot actually see the above image directly; they can only see the circular cross-sections from the side. The cross-sections will appear as line segments that show curvature from the way they interact with nearby light sources. Nevertheless, it is reasonable to assume that, as diligent 2D beings trying to understand 3D, we will, through careful study of these cross-sections from various angles, eventually form a mental model of these cross-sections that more-or-less corresponds with what is depicted above. For the sake of conciseness, we will continue to present these 2D images as they would appear from 3D; however, it is to be understood in each case that 2D beings can only imagine such diagrams in their mind after careful study.
In any case, from these circular cross-sections, we may conclude that the cylinder must be something circular.
We can also observe the cylinder passing through our world in a different orientation:

This time, the cylinder passes through round-side first. What we see is a series of rectangular cross-sections that seem to grow and shrink in length but remain constant in width. From this, we conclude that the cylinder must have something rectangular about it.

Thus far, we learned that a 3D cylinder is something that is both circular and rectangular. This is obviously correct. Examining cross-sections has yielded valuable information about the shape of a cylinder.
A Fundamental Weakness
Now, still supposing we are only 2D creatures, we have a hard time understanding how something can be both circular and rectangular at the same time, as we've just learned. As 2D creatures, we only have experience with 2D shapes, and none of them are simultaneously a circle and a rectangle. We may try to investigate this further by observing the cylinder pass through our 2D world at a 45-degree angle:
The cross-sections are now rather puzzling:

They consist not of regular circles or rectangles but of ellipses in various states of truncation. Unless we knew beforehand, we would probably not be able to deduce the shape of a cylinder from these cross-sections. We may even think that these are cross-sections of a different object altogether.
This illustrates a fundamental weakness of the cross-sections method: although it does yield some useful information, it is difficult to synthesize this information into a coherent model of the actual object. For example, if we only knew the above sequence of cross-sections of the cylinder, it would be rather hard for us to deduce that a cylinder has two circular lids and a curved side.
The following sequence of cross-sections further illustrate this weakness:

Can you guess what 3D object would produce this sequence of cross-sections?
Probably not, unless you knew it beforehand.
These are, in fact, cross-sections of the 3D cube, which are produced when the cube passes through the 2D world corner-first. It is rather difficult to know this just by examining these cross-sections alone; information about the object such as the number of vertices (corners) and the number and shape of its faces are not readily apparent. Most people probably don't even know that a cube can make a hexagonal cross-section with a plane!

Now, as 3D beings, we at least have some knowledge of 3D geometry to be able to imagine the cross-sections stacked on top of each other, and perhaps deduce a vaguely cube-like shape from them. But consider the following sequence of cross-sections of a 4D object with 3D space:

Can you figure out what the 4D object is?
Likely not, unless you knew it beforehand, since you would have a hard time understanding just how these cross-sections could fit together. Without an intuitive grasp of 4D, it is very hard to reconstruct the original object from them.
The fundamental problem with cross-sections is that we are examining the object piecemeal. Important features such as the number and shape of facets, the number of vertices (corners), and the overall shape of the object, are only implied, not explicit.
A better approach is to use projections, as we will discuss in the next chapter.
137 notes
·
View notes
Text
1.2 Scales
The year is 1863 and Johannes Brahms, at the age of 30, has fastened a political statement. Completing composition of Variations on a Theme of Paganini, Op. 35 and publishing it as a piano study with the designation “studien”, he has aligned himself with the followers of the late, musical conservative, Robert Schumann. This antagonized the progressive New German School in Weimar. Indeed, we’ve been dropped into the center of the War of the Romantics. Sound familiar? Essentially, old versus new music. How about now?
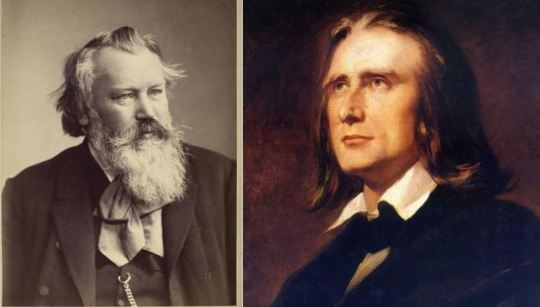
Opposing Ideals: (left) Johannes Brahms, (right) Franz Liszt
Encouragement abound for the interested reader to continue digging! The combatants, musical pieces, critiques, newspaper headlines, etc. are all worth their own discussion. Today though, the thirteenth variation of Paganini’s twenty-fourth caprice deserves special mention. Within the ledger lines of the sheet music is a very special motion called a glissando. As it takes place on a piano, it could even be called discrete glissando, meaning that there is audible gliding between two notes, with distinct tones heard between the glide’s endpoints.

This is clearly from Disney’s Peter Pan.
Picture the above photo, except less pirate-y... and more glissando. Piano glissando can be: all the white keys, or all the black keys, or with impressive timing, every key in order. During these moments in the variation, the pianist cares less about what notes are being used in the overall piece. The same cannot be said for everywhere else in the music. There are some notes during the melody which when played would sound very off indeed.
Why is this happening? In effect, the piece of music has been restricted to a set of acceptable notes to limit dissonance. In Western music (our system of choice), the set of acceptable notes is a seven-pitch, or heptatonic, scale. So five of the constructed notes discussed last time are thrown out. These notes are chosen based on the special rules of the scale and there are a lot of them. Seven very popular sets of rules are called Ionian, Lydian, Mixolydian, Dorian, Phrygian, Aeolian, and Locrian. These are also called modes, and some theorists would be quick to note that the relationship between modes and scales are more subtle than described above. Let’s ignore that until a bit later.
The two modes to be discussed initially are the Ionian and Aeolian modes, more commonly referred to as the major and natural minor scales.
The Major Scale
We can start from C4, or middle C, at 440*(1/2)^(3/4) Hz, or 261.6 Hz and move up two whole steps, then a half step, then three more whole steps, and finally another half step. This brings us to the next octave in our initial pitch class, C5.

So the notes in the C major scale are: C, D, E, F, G, A, and B. Super easy! No accidentals required. We could also put the twelve semitones into a ring and draw connecting lines as follows.

Doing the same for every major scale makes... a mess... but it’s fun to visualize.

The Natural Minor Scale
This time, our progression moves through a whole step, then a half step, then two whole steps, then another half step, then two final whole steps. Using any of the diagrams above, we see the set of pitches in the A natural minor scale are A, B, C, D, E, F, and G! Again, really easy with no accidentals!
This means though that C major and A minor are actually the same set of notes, and only the ordering is different. Another phrasing would be that A is C’s relative minor. Conveniently, we can pair up all relative scales by rotating the above circle. G♯ sits to the left of A, and is therefore the relative minor of B major, which sits to the left of C. This can also be reversed for relative majors!
Alternatively, G major and G minor would be considered parallel, because they have the same base tone, called the tonic.
Writing the two scale progressions with whole (w) and half (h) tones, we say the major scale follows w,w,h,w,w,w,h and the natural minor scale is w,h,w,w,h,w,w. Note again a rotational relationship. Moving the first two letters of the natural minor scale to the end produces the major scale!
Other Minor Scales
There are also the harmonic and melodic minor scales which raise the seventh note or the sixth and seventh notes by a half step. So the harmonic A minor (hereafter Am) is A, B, C, D, E, F, G♯ and the melodic Am has an additional sharp with F♯ instead of F.
The Rest of the Modes
So where do the other five modes come in?
Consider again the C major scale. When it starts on C, it is the Ionian mode. Now shift the scale to D, but keep all the original tones: D, E, F, G, A, B, C. This is D Dorian. It is essentially the minor (Aeolian) scale but with a raised sixth note. Continue shifting to E. This is E Phrygian. Then F Lydian, G Mixolydian, A Aeolian, and finally B Locrian. Not so tricky after all. The order of these modes can be remembered by a mnemonic device such as I Don’t Particularly Like Modes A Lot.
The Circle of Fifths
So now we fast forward 155 years and the modern musician reads from left to right and sees two things: a clef and a series of accidentals. Odds are it’s a treble clef but the accidentals are relatively unpredictable. These describe the key of the piece, or movement, or section. Take for example a piece with no written accidentals following the clef:

Can you guess the name of this one? We know because of the key signature, which in this case is blank, that this song is either in the key of C major or A minor. To determine between the two, one would need to look at which tone is being positioned as the tonic through phrasing and other analysis. As a freebie, the excerpt of Ode to Joy above is in C.
Not all key signatures are so simple however. Generating a Dm scale gives the set of notes: D, E, F, G, A, B♭, C. The relative major, B, has five sharps!

In the first two bars of Scarborough Fair, the pianist never even gets to play a B♭, but the signature is more about the overall key and tonic center no matter how frequently the flat accidental is added.
The specifics of each key and how many flats are present is all too much for the average musician to remember right away. One of the most important tools of introductory music theory is called the Circle of Fifths. This tool has a myriad of interesting properties to be discussed over the next several lectures which relate keys and chords and progressions and so on. Leave space for each of the twelve semitones to fit inside and outside of a circle. Start with the key of C at the top. The next fifth is the fifth note in the current scale progression. So the fifth to the right of C is the fifth note in C major: G. Then, jumping by fifths in the same way as in Pythagorean tuning, we wind around the circle until we return to C. On the inside, we can plot the relative minors using the rotation trick again.
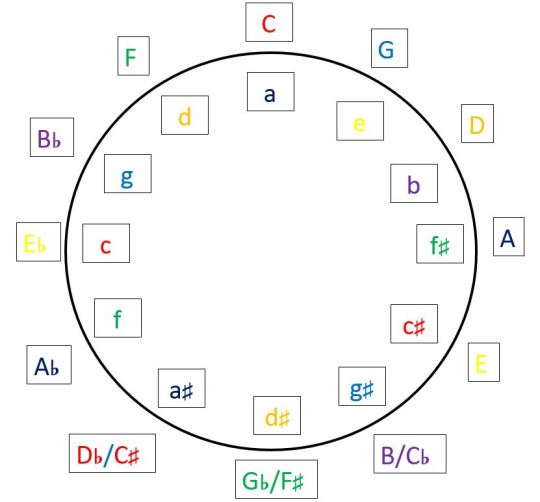
To remember the ordering of the fifths, students often implement other mnemonic devices. In this case, clockwise from the key of F might read: Father Charles Goes Down And Ends Battle. Likewise, counterclockwise from B♭ reads: Battle Ends And Down Goes Charles. This works for the minors also.
So how might this help remembering the accidentals in each key? Consider that C has neither, while G has... G, A, B, C, D, E, F♯... one sharp. From writing out Dm earlier, we know the relative major, F, contains one flat! Likewise, D has two sharps: F♯ and C♯ and B♭ has two flats: B♭ and E♭. Incredibly, the pattern continues all the way around the circle.
Can you guess how the War of the Romantics ended? If the fight between classical and more modern music is unsurprising to you, its because notions of the war are still present even today. Sooner than later, proponents of House and Alternative styles might be competing with a newer form of music not yet invented.
For Thought:
1) Glissando and portamento are two words which both essentially mean a slide between notes. Many individuals however would be quick to point out subtle differences. Try to construct as accurate of definitions for each as possible, or argue towards the idea that they are in fact the same.
2) Identify one system of music which does not use heptatonic scales and describe their alternative.
3) Construct any natural, melodic, and harmonic minor scales that have not yet been discussed and calculate the frequency differences between the sixth and seventh tone for each scale. Generate the D♭ Locrian mode from the appropriate major scale and indicate which major scale was used.
4) Determine the order that flats and sharps appear as one moves around the circle of fifths. Does this line up with the order they appear in key signatures? Do the overlapping areas at the bottom of the circle cause any issues?
5) Eduard Hanslick once said of Wagner’s Götterdämmerung, “One can listen to this incoherent ardour amidst the fluctuations of deafening and nerve-racking orchestral effects for only a short time without relaxation.” Which side of the war was Hanslick likely on? What specific type of music was he against?
Next Time: Chords
#music theory#circle of fifths#brahms#liszt#richard wagner#hanslick#major#minor#heptatonic#glissando#music scales
1 note
·
View note
Link
Mobile Check Engine Light Diagnostics Repair and Cost Mobile Check Engine Light and Maintenance Services in Albuquerque NM | Mobile Auto Truck Repair Albuquerque (505) 485-1618
More Information Is At: http://mobileautotruckrepairalbuquerque.com/check-engine-light-diagnostics-repair/
Youtube Link: https://youtu.be/yFc6V0y4WN8
Facebook Link: https://www.facebook.com/MobileAutoTruckRepairAlbuquerque/videos/1482762271876140/
Looking for emergency mobile check engine light diagnostics and repair services near Albuquerque NM? Our engine diagnostics service provides information to help diagnose why your car's check engine light is on. Schedule an appointment at Mobile Auto Truck Repair Albuquerque . We can come to you for Mobile Check Engine Light Diagnostics Repair. Call us to schedule appointment. Cost of Check Engine Light Diagnostics Repair? Free estimates! Call today or book Check Engine Light Diagnostics Repair online easily! Best mobile car and truck repair in Albuquerque NM. Open 24 hours 7 days!
REQUEST FREE ESTIMATES TODAY!
CHECK ENGINE LIGHT DIAGNOSTICS REPAIR
Check Engine Light On? Free Diagnostics And Cost At Mobile Auto Truck Repair Albuquerque
Your vehicle is driving erratically, or you’ve got a warning light on your dashboard that was blinking yesterday and now is on steady. What do you do? Hint: the answer is not to put a piece of electrical tape over the warning light and pretend it’s not happening. Quick attention to dashboard lights can save you thousands on serious repairs down the road.
WHAT MAKES A DASHBOARD LIGHT COME ON?
Today’s vehicles are manufactured with complex interrelated systems. On-board computers continuously monitor and store information concerning the performance of these systems. A warning light comes on because the computer has sensed a signal from one of the systems or components that has gone outside of its normal operating range. The computer then sends a signal to turn on the dashboard light to let you know something is wrong!
The potential causes for a warning light can range from improperly tightening your gas cap to engine, transmission or braking system performance issues. While dashboard lights can go on and the car still appears to be driving “fine”, ignoring some lights can lead to serious issues, such as engine damage or other component failure. In some instances, this can be a safety hazard. That’s why it is recommended to have your car looked at by a certified professional as soon as possible for both your safety and peace of mind. To learn more about the different types of dashboard lights visit our Car Warning Lights page.
HOW CAN MOBILE AUTO TRUCK REPAIR ALBUQUERQUE “DIAGNOSE” MY PROBLEM?
At, Mobile Auto Truck Repair Albuquerque we have the tools, training and technology to properly handle diagnostic issues for everything from a Check Engine light to an ABS Warning light. Properly performing a complete diagnostic procedure normally includes the following steps:
1. Retrieve Data – A full-functioning scan tool is used to perform an onboard computer system analysis in order to retrieve the following:
Computer codes
Freeze frame data
Computer software version numbers
Critical sensor data and status information
NOTE: Merely “pulling codes” does not generally provide enough information to make an accurate diagnosis of the problem. Pulling codes is the initial step in the process by identifying the circuit or system that has illuminated the vehicle’s dashboard light.
2. Verification Testing – Verification tests determine if systems meet proper specifications. These tests may include an analysis of:
Engine vacuum and backpressure
Mechanical and electrical engine timing
Ignition system
Fuel system
Emissions system
NOTE: Failure in any of these basic systems can cause the check engine light to illuminate and falsely identify a circuit or component as the problem, which could lead to improper or unnecessary parts replacement if your garage does not complete verification testing.
3. Pinpoint Testing – All manufacturers require that circuit or component pinpoint testing is done in order to make an absolute diagnostic determination. These actions involve:
Working through wiring diagrams
Performing electrical and/or mechanical tests
Performing bi-directional control tests
Visual inspections of suspect areas
4. Research Technical Service Bulletins – Technical Service Bulletins and hotline information will indicate if the problem has been determined to be a pattern failure, meaning that it is a known issue that occurs with a particular type of vehicle. This does not eliminate the need for testing, as other systems must meet specifications before a service bulletin procedure should be performed.
5. Car Repair – This may involve multiple actions such as:
Parts replacement
Cleaning of passages, connections and/or components
Performing manufacturer technical service bulletin updates
Updating of vehicle’s computer software
Wiring repair or replacement
6. Verify Repair – Once all necessary actions have been taken, the vehicle must be retested to verify that the repair is complete and has achieved the proper results.
HOW MUCH DOES IT COST TO DIAGNOSE A CHECK ENGINE LIGHT?
The average cost for a check engine light diagnosis & testing is between $30 and $60. Labor costs are estimated between $30 and $60. Estimate does not include taxes and fees.
HOW MUCH DOES IT COST TO FIX THE CHECK ENGINE LIGHT?
If it goes bad, your mileage could drop by up to 25 percent. It costs about $100-375 to fix, but will save you money at the pump. Getting the "check engine" light to turn off could be as easy as replacing a spark plug. Spark plugs are responsible for igniting a car's air/fuel ratio.
HOW MUCH DOES IT COST TO FIX AN ENGINE MISFIRE?
If the spark fires at the incorrect time or not at all, it is considered a misfire. Misfiring of a cylinder can happen for numerous reasons. Here are the most common causes and related costs of the misfire condition: Carbon or oil-fouled sparkplugs: $100 to $300 depending on cost of plugs and labor to replace
WHY IS MY CAR SHAKING AND CHECK ENGINE LIGHT ON?
Engine firing issues: When one or more of your spark plugs isn't firing correctly, it can cause your car to vibrate. Typically, this problem will also cause your check engine light to illuminate. If a misfire is responsible, a loss of power or “hesitation” will usually accompany the vibration.
CAN A MISFIRE RUIN AN ENGINE?
The most common causes of engine misfires are: worn spark plugs, weak fuel injector, vacuum leak, worn valve seals, carbon tracking, and no voltage at the coil. Misfiring engines should be looked at as soon as possible, as the problem can worsen over time and damage internal components of the vehicle.
HOW DO YOU KNOW WHEN YOU NEED NEW SPARK PLUGS?
If you're not keeping track of your mileage, here are some signs your spark plugs or ignition wires are due to be serviced or replaced:
· The engine idles roughly. ...
· You have trouble starting your car in the morning. ...
· Your car's engine misfires. ...
· Engine surge or hesitation. ...
· High fuel consumption. ...
· Lack of acceleration.
PAGE IS RELATED TO
· Free Check Engine Light Diagnosis Near Me
· Where Can I Get A Free Diagnostic For My Car
· Free Check Engine Light Diagnostic
· Free Check Engine Light Scan Near Me
· Check Engine Light Scanner
· Advance Auto Parts Check Engine Light
· Free Check Engine Light Scan
· Free Engine Diagnostic Test Near Me
BEST CHECK ENGINE LIGHT DIAGNOSTICS REPAIR AND TRUCK SERVICE IN ALBUQUERQUE NM
MOBILE AUTO TRUCK REPAIR ALBUQUERQUE
REQUEST MORE INFORMATION NOW. CLICK HERE!
Contact:
MOBILE AUTO TRUCK REPAIR ALBUQUERQUE
Best mobile mechanic towing roadside assistance services near Albuquerque Rio Rancho New Mexico
CALL (505) 485-1618 Mobile Mechanic
CALL (505) 346-2682 Towing and Roadside Assistance
WEBSITE: http://www.mobileautotruckrepairalbuquerque.com/
Albuquerque and Rio Rancho, NM
YouTube Video: https://youtu.be/vMB_z7DSpdU
CALL US FOR:
• Mobile Mechanic Albuquerque,
• Mobile Auto Repair Albuquerque,
• Mobile Truck Repair Albuquerque,
• Diesel Service Albuquerque,
• Vehicle Inspection Albuquerque,
• Lockout Services Albuquerque,
• Flat Tire Repair Albuquerque,
• Roadside Assistance Albuquerque,
• RV Repair Albuquerque,
• Towing Service Albuquerque,
• Diesel Mechanic Albuquerque,
• Jumpstarts Albuquerque,
• Pre-Purchase Inspections Albuquerque,
• 24 Hour Auto Repair Services Albuquerque,
SERVICE AREA:
Albuquerque Metropolitan Area: Bernalillo, Sandoval, Torrance, Valencia Counties NM, Albuquerque, Belen, Moriarty, Rio Communities, Rio Rancho, Bernalillo, Estancia, Mountainair, Peralta, Bosque Farms, Corrales, Cuba, Encino, Jemez Springs, Los Lunas, Los Ranchos de Albuquerque, San Ysidro, Tijeras, Willard, Algodones, Carnuel, Casa Colorada, Cedar Crest, Chilili, Cochiti, El Cerro-Monterey Park, Isleta Village Proper, Jarales, Jemez Pueblo, La Jara, Los Chavez, Los Trujillos-Gabaldon, Manzano, Meadow Lake, North Valley, Paradise Hills, Pena Blanca, Placitas
Ponderosa, Pueblo of Sandia Village, Regina, Rio Communities North, Rio Communities, San Felipe Pueblo, Santa Ana Pueblo, Santo Domingo Pueblo, South Valley, Tajique, Tome-Adelino, Torreon (Sandoval County), Torreon (Torrance County), Valencia, Zia Pueblo New Mexico
Zip Codes: 87101, 87102, 87103, 87104, 87105, 87106, 87107, 87108, 87109, 87110, 87111, 87112, 87113, 87114, 87116, 87119, 87120, 87121, 87122, 87123, 87125, 87131, 87153, 87154, 87158, 87176, 87181, 87187, 87190, 87191, 87192, 87193, 87194, 87196, 87197, 87198, 87199.
0 notes
Video
youtube
Mobile Check Engine Light Diagnostics Repair and Cost in Omaha NE | FX Mobile Mechanic Services Omaha (402) 401 7563
More information is at: http://www.mobilemechanicomaha.com/check-engine-light-diagnostics---repair.html
https://youtu.be/EB10Lt6SMPY
Looking for emergency mobile check engine light diagnostics and repair services near Omaha NE? Our engine diagnostics service provides information to help diagnose why your car's check engine light is on. Schedule an appointment at FX Mobile Mechanic Services Omaha . We can come to you for Mobile Check Engine Light Diagnostics Repair. Call us to schedule appointment. Free estimates. Open 24 hours.
REQUEST FREE ESTIMATES TODAY!
CHECK ENGINE LIGHT ON? FREE DIAGNOSTICS AND COST AT FX MOBILE MECHANIC SERVICES OMAHA
Your vehicle is driving erratically, or you’ve got a warning light on your dashboard that was blinking yesterday and now is on steady. What do you do? Hint: the answer is not to put a piece of electrical tape over the warning light and pretend it’s not happening. Quick attention to dashboard lights can save you thousands on serious repairs down the road.
WHAT MAKES A DASHBOARD LIGHT COME ON?
Today’s vehicles are manufactured with complex interrelated systems. On-board computers continuously monitor and store information concerning the performance of these systems. A warning light comes on because the computer has sensed a signal from one of the systems or components that has gone outside of its normal operating range. The computer then sends a signal to turn on the dashboard light to let you know something is wrong!
The potential causes for a warning light can range from improperly tightening your gas cap to engine, transmission or braking system performance issues. While dashboard lights can go on and the car still appears to be driving “fine”, ignoring some lights can lead to serious issues, such as engine damage or other component failure. In some instances, this can be a safety hazard. That’s why it is recommended to have your car looked at by a certified professional as soon as possible for both your safety and peace of mind. To learn more about the different types of dashboard lights visit our Car Warning Lights page.
HOW CAN FX MOBILE MECHANIC SERVICES OMAHA “DIAGNOSE” MY PROBLEM?
At, FX Mobile Mechanic Services Omaha we have the tools, training and technology to properly handle diagnostic issues for everything from a Check Engine light to an ABS Warning light. Properly performing a complete diagnostic procedure normally includes the following steps:
1. Retrieve Data – A full-functioning scan tool is used to perform an onboard computer system analysis in order to retrieve the following:
Computer codes
Freeze frame data
Computer software version numbers
Critical sensor data and status information
NOTE: Merely “pulling codes” does not generally provide enough information to make an accurate diagnosis of the problem. Pulling codes is the initial step in the process by identifying the circuit or system that has illuminated the vehicle’s dashboard light.
2. Verification Testing – Verification tests determine if systems meet proper specifications. These tests may include an analysis of:
Engine vacuum and backpressure
Mechanical and electrical engine timing
Ignition system
Fuel system
Emissions system
NOTE: Failure in any of these basic systems can cause the check engine light to illuminate and falsely identify a circuit or component as the problem, which could lead to improper or unnecessary parts replacement if your garage does not complete verification testing.
3. Pinpoint Testing – All manufacturers require that circuit or component pinpoint testing is done in order to make an absolute diagnostic determination. These actions involve:
Working through wiring diagrams
Performing electrical and/or mechanical tests
Performing bi-directional control tests
Visual inspections of suspect areas
4. Research Technical Service Bulletins – Technical Service Bulletins and hotline information will indicate if the problem has been determined to be a pattern failure, meaning that it is a known issue that occurs with a particular type of vehicle. This does not eliminate the need for testing, as other systems must meet specifications before a service bulletin procedure should be performed.
5. Car Repair – This may involve multiple actions such as:
Parts replacement
Cleaning of passages, connections and/or components
Performing manufacturer technical service bulletin updates
Updating of vehicle’s computer software
Wiring repair or replacement
6. Verify Repair – Once all necessary actions have been taken, the vehicle must be retested to verify that the repair is complete and has achieved the proper results.
PAGE IS RELATED TO
• Free Check Engine Light Diagnosis Near Me
• Where Can I Get A Free Diagnostic For My Car
• Free Check Engine Light Diagnostic
• Free Check Engine Light Scan Near Me
• Check Engine Light Scanner
• Advance Auto Parts Check Engine Light
• Free Check Engine Light Scan
• Free Engine Diagnostic Test Near Me
FX Mobile Mechanic Services Omaha
Located in Omaha NE!
Best Check Engine Light Diagnostics and Emergency Mobile Mechanic in Omaha!
Read our reviews at Yelp, Facebook or Google Maps and see what others say about us!
CONTACT:
FX Mobile Mechanics Services Omaha
Best Mobile Mechanic Omaha NE Council Bluffs IA!
CALL Mobile Mechanic 1: (402) 401-7561, http://www.mobileautorepairomaha.com/
CALL Mobile Mechanic 2: (402) 401-7563, http://www.mobilemechanicomaha.com/
CALL Mobile Mechanic 3: (402) 513-4411, http://www.mobilemechanicnearomahane.com/
CALL Towing Service: (402) 401-7564, http://www.towingserviceomaha.com/
CALL Roadside Assistance: (402) 590-8094, http://www.roadsideassistanceomaha.com/
Mobile Mechanic Auto Truck Repair Towing Roadside Assistance Services
Open 7/24
Website: http://www.mobilemechanicomaha.com/
http://www.mobilemechanicomaha.com/
SERVICES:
• MOBILE MECHANIC
• MOBILE AUTO REPAIR
• MOBILE TRUCK REPAIR
• MOBILE CAR REPAIR
• SEMITRUCK REPAIR
• RV REPAIR
• TIRE REPAIR
• FLAT TIRE CHANGE
• JUMPSTART
• FUEL DELIVERY
• CAR LOCKOUT SERVICES
• DIESEL REPAIR
• TOWING
• ROADSIDE ASSISTANCE
SERVICE AREA:
Omaha Nebraska - Council Bluffs Iowa Metropolitan Area: Downtown Omaha, Central Omaha, Southwest Omaha and Sarpy County, including the communities of Omaha, Bellevue, Blair, Carter Lake, Elkhorn, Fort Calhoun, Fremont, Gretna, La Vista, Millard, Papillion, Ralston, Springfield, Plattsmouth, Arlington, Ashland, Louisville, Wahoo, Yutan and Waterloo, NE, Bennington Ne | Blair Ne | Boys Town Ne | Cedar Bluffs Ne | Cedar Creek Ne | Ceresco Ne | Colon Ne| Elkhorn Ne |Elmwood Ne | Fort Calhoun Ne |Fremont Nebraska |Greenwood Nebraska |Gretna Ne | Herman Nebraska | Ithaca Ne |Kennard Ne |La Vista Nebraska |Louisville Ne |Manley Ne |Mead Ne | Memphis Ne | Missouri Valley Ne | Murdock Ne | Murray Ne | Nehawka Ne |Nickerson Ne | Omaha Ne | Papillion Ne | Plattsmouth Ne | South Bend Ne | Springfield Nebraska | St Columbus Ne | Univ Of Ne Med Center Ne | Valley Ne | Wahoo Nebraska | Washington Ne Waterloo Ne | Waverly Ne | Weeping Water Ne |Yutan Nebraska and Missouri Valley, Avoca, Glenwood, Council Bluffs, IA. Zip codes: 68007, 68010, 68022, 68102, 68104, 68105, 68106, 68107, 68108, 68110, 68111, 68112, 68114, 68116, 68117, 68118, 68122, 68124, 68127, 68130, 68131, 68132, 68134, 68135, 68137, 68142, 68144, 68147, 68152, 68154, 68157, 68164, 68178.
0 notes
Link
https://ift.tt/2R3rkfY
Traditional on-page SEO guidance is to target a primary phrase, its near-related terms, and its longtail variants by using them in the text and placing them in strategic locations on the page (i.e., title, headings, early in content, throughout content). However, writing for Natural Language Processing, or NLP, requires some additional steps and considerations.
Managing on-page SEO for Google’s NLP capabilities requires a basic understanding of the limitations of its parser and the intelligence behind the logic. In practical terms, this is technical SEO for content understanding. Writing for NLP requires clear, structured writing and an understanding of word relationships.
Brief Introduction to NLP
The are many aspects to Natural Language Processing, but we only need a basic understanding of its core components to do our job well as SEOs. In short, NLP is the process of parsing through text, establishing relationships between words, understanding the meaning of those words, and deriving a greater understanding of words. I’ll briefly go through the major components and vocab you’ll need.
Major Components of Natural Language Processing
1. Tokenization:
Tokenization is the process of breaking a sentence into its distinct terms.

2. Parts-of-Speech Tagging
Parts-of-Speech Tagging classifies words by parts of speech (think sentence diagramming in elementary school).

3. Lemmatization
Lemmatization determines if a word has different forms, like:
am, are, is = be
car, cars, car’s, cars’ = car
4. Word Dependency
Word dependency creates relationships between the words based on rules of grammar. This process also maps out “hops” between words.

5. Parse Label
Labeling classifies the dependency or the type of relationship between two words connected via a dependency (Standford paper that defines these).

6. Named Entity Extraction
This attempts to identify words with a “known” meaning. Generally, these are people, places, and things (nouns). While pop culture entities tend to come to mind, words like “temperature” and “chicken” are also entities. What Google determines is an entity is expanding as it gains more “knowledge” of the world. Entities can also include product names. These are, generally, the words that trigger a Knowledge Graph. However, Google may know phrases like “title tag” have meaning, even if they aren’t “entities” in the traditional sense.

7. Salience
Salience determines how much text is about something. The more salience, or aboutness, the more relevant that text is to the word/topic. This is determined in NLP based on what we call indicator words. Generally, salience is determined by word co-citation across the web and the relationships between entities within databases like Wikipedia and Freebase. Google is also likely to apply the link graph to entity extraction in documents as well to determine these word relationships.
For example, words like “avocado” and “makeover” make a sentence more salient for the show “Queer Eye.”

8. Sentiment
In short, this is a negative to a positive score of the expressed sentiment (view or attitude) about entities in an article.
9. Subject Categorization
At a macro level, NLP will classify text into subject categories, such as the ones you’ll find here.

Subject categorization helps determine broadly what the text is about (and may interact with how topical authority is determined and assigned through the link graph and your body of content).
10. Text Classification & Function
NLP may go further and determine the intended function of the content. In research by Google, there is discussion of classifying UGC by categories like praise, humor, question, and answer(s).

11. Content-Type Extraction
Google can use structural patterns to determine the content type of given text without Schema.org structured data. The HTML, formatting of text and the data type of the text (date, location, URL, etc.) can be used to structure the text without additional markup. This process allows Google to determine if text is an event, recipe, product, or another content type without the use of markup.
12. Structure Implied Meaning
The formatting of a body of text can change its implied meaning. Headings, line breaks, lists, and nearness all convey a secondary understanding of the text. For example, if text appears in an HTML ordered list or a series of headings with numbers in front of them, it’s likely a process or ranking. The structure is not only defined by HTML tags but by visual font size/weight and proximity when rendered.
Units of Understanding
While tools like the free Google NLP tool can allow us to look at this process one sentence at a time, Google is building these relationships with larger chunks of text. At Briggsby, we often say that meaning is determined one sentence at a time, one paragraph at a time, one section at a time, and one page at a time. Effective NLP optimization clarifies meaning at each of these units.
10 Ways to Improve Writing for NLP
There are a handful of practical and actionable changes we can make to our content to better optimize our content for NLP.
1. Connect Questions to Answers
The key to well-optimized content for NLP is simple sentence structure, especially when answering questions. The advice we give our clients is to think about the 1-2 sentence answer you’d expect Google Assistant to provide when asking it a question.
Basic Format: [Entity] is [Answer].
This format reconstructs the question back into a simple statement that includes the answer. If the question is: “safe temperature for chicken,” then the clear answer is “The safe internal temperature for cooked chicken is 165° Fahrenheit.”
2. Identify Units, Classifications, and Adjectives
Within NLP SEO, words have meaning and therefore may have expected units, classifications, or adjectives associated with them. NLP parsing will be on the lookout for these elements when determining if the content contains the precise answer to a question. Let’s look at two examples.
Example Query 1: “Safe Temperature for Chicken”
For this query, temperature has a unit of degrees in either Fahrenheit or Celsius expressed as a numerical value. If a sentence does not include these elements, it does not satisfy the question. A well-structured sentence should contain a number and the word degree or the degree symbol. If our sentence clarifies Fahrenheit or Celsius, the answer is more accurate and specific, while also improving our localized targeting.
Example Query 2: “Title Tag Length”
For this query, Google could identify that “title tag” is a known concept within a subcommunity of web developers and SEOs. The question “length” denotes a dimension that has units, which for the title tag is traditionally characters or more recently (for the SEO niche only) pixels. A number should express both of those units. The top-ranking article, from Moz, satisfies this expectation by answering “Google typically displays the first 50–60 characters of a title tag.”
3. Reduce Dependency Hops
Reading a sentence and determining if a question is answered depends on Google’s NLP parsers not getting hung up as they “crawl” through a sentence. If a sentence’s structure is overly complicated, Google may fail to create clear links between words or may require it to take too many hops to build that relationship.
The goal here is to reduce the total number of hops to get from the subject to the question to the answer.
Example Sentence 1:
“The safe internal temperature for cooked chicken is 165° Fahrenheit.”
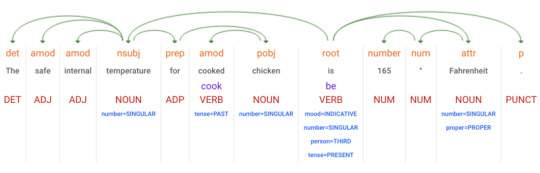
Map the journey from chicken to temperature to the answer:
chicken <-> for <-> temperature <-> is <-> Fahrenheit <-> degree <-> 165
We can get from chicken to a numerical value in 6 hops with a clear journey and relationship between the two.
Example Sentence 2:
“The most precise way of telling if the chicken is done is to reach a perfect internal temperature of 165 degrees for dark meat.”

Mapping it out:
chicken <-> done <-> telling <-> of <-> way <-> is <-> reach <-> temperature <-> of <-> degrees <-> 165
This sentence has 10 hops between the noun of the question and the numerical answer. The increased complexity may lower confidence in the answer or get the NLP hung up on understanding a sentence entirely. These types of embellishments are common for writers but can hinder content performance.
To optimize text for NLP, you want to reduce these hops and create a more explicit journey between the question and the answer by using simplified grammar and clear writing.
4. Don’t Beat Around the Bush
A common NLP problem is “beating around the bush” when it comes to answering a question. It’s not that these answered are “wrong,” but they don’t give Google a precise determination of the answer.
Let’s look at the query: “how often to wash hair.”
Example Text 1:
It seems as though we’re all divided when it comes to how often we should be washing our hair. Some people swear that washing less frequently makes their hair healthier, while others insist that double-shampooing is actually the way to go.
…
But how does your haircare routine stack up against the rest of America? A recent survey conducted by Lookfantastic set out to measure just that. It turns out that 49% of women polled admitted to washing their hair every damn day, which means that we, as a nation, are totally split 50/50.
…
If you’re not sure how often you should be washing your hair, it’s always a good idea to check in with your stylist next time you’re at the salon.
Can you find the precise answer in there? How confident is Google that the answer appears in that text?
Example Text 2:
If your skin and hair are anywhere from normal (not super oily and not super dry) to dry, you probably only need to wash it once or twice a week, according to a Columbia University health column. If you have a greasy scalp, you probably need to wash your hair more often.
This second example provides a much clearer answer to the question. Identifying a lack of clarity in content is an important step when auditing content for NLP. If Google is unable to parse a definite answer, their confidence in search task completion and relevance goes down.
5. Avoid Unclear Antecedents
As a quick grammar refresher, a pronoun, such as “she,” “it,” and “they,” can stand in for a noun. The antecedent is the noun that pronoun is meant to represent. When pronouns are introduced, it can become unclear which noun is being referenced.
A classic example is:
The folder was on the bus, but now it’s gone.
Which is gone? Is it the bus or the folder?
The problem can become compounded when NLP has to carry meaning from sentence to sentence. Even if an antecedent is clear when looking at a single sentence, it can become unclear when meaning is carried from sentence to sentence.
Example Text:
Title tags are an essential part of optimizing a page for SEO. On a podcast last week, John suggested they should be less than 60 characters.
It’s possible to consider “they” as a reference to podcasts. The meaning could be “podcast should be less than 60 characters long”, even though this doesn’t make logical sense. As readers, we’re able to make the intellectual leap to know that “they” refers to “title tags,” but Google may fail to make that connection.
As a result of this unclear antecedent, NLP may conclude that this text does not contain the answer to “title tag length.” The best practices listed above should help minimize this but pay particular attention when you’re splitting the question/subject from the answer across two separate sentences.
6. Be “Correct” and Clear
It’s possible to be too smart for Google. Saying that Google can understand text is like saying Google could crawl JavaScript several years ago. Yes, it could, but there were, and still are, a ton of caveats. Understanding those various caveats help us ensure that Google not only can see our content accurately (rendering) but that it can also read and extract meaning from that content. Generally, Google is pretty “dumb” when it comes to reading.
The lack of a distinct answer can get you in trouble when you are “correct,” but are perhaps too complex for Google to determine if you answered a question.
Example Text:
The optimal length for a title is determined by how much Google can show in their search results. The way the results look might differ depending on the device you’re using.
…
If you’re asking “how many characters does Google show?”, the answer is: “it depends.” Google doesn’t count a particular number of characters but has a fixed width in which it can show the title.
…
As the optimal title length for SEO differs per type of result, we would suggest getting your most important keyword in the first half of the title.
This answer isn’t incorrect. It’s exceptionally accurate. However, Google’s reading comprehension abilities will struggle to determine if this text answers a question about the ideal title tag length, especially when compared to Moz’s “Google typically displays the first 50–60 characters of a title tag.” The more complicated answer also doesn’t satisfy Google’s goal of simple responses for featured snippets and voice search.
While this simplification will lead to better SERP performance, it can be frustrating when writing about complex, nuanced subjects. There may not be a simple answer, but right now the sites that give the precise answer get a disproportionate advantage due to featured snippets and NLP weighting.
7. Boost Your Salience
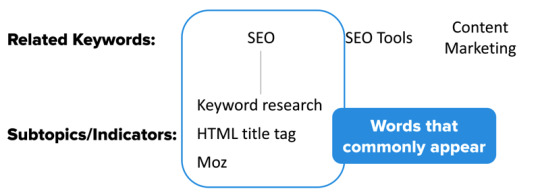
Traditional keyword targeting focuses on keyword placement, phrase/broad match variants, and closely related keywords. As NLP improves, keyword salience becomes more critical than naïve targeting practices that have been standard for 10 years.
Related keywords typically refer to either “people also search” or “page also ranks for” terms, but indicator keywords (as we call them) are the words that commonly appear alongside a keyword and can “build up” to it. The use of these terms improves an article’s “aboutness” for its target keyword.
Using these keywords in your text can improve its salience for a given word – similar to the Queer Eye, avocado, and makeover example earlier.
Subject matter experts tend to identify and use these phrases naturally when writing about a topic (a great reason spend more for better writers). However, this can be improved by intentionally adding a step to your brainstorming process, as well as your internal documentation and training.
Related keyword tools can often fail you at this stage. Let’s look at the related keyword recommendations of popular tools when you put in “title tag.”
SEMRush Moz Google Suggest what is the title tag title tag html title tag length 2018 keyword is title tag meta title tag html title tag what is a title tag title tag definition title tag definition title tag seo meta title example title tag and meta description page title tag title tag and meta description title tag vs h1
These tools weigh heavily the “keywords people also search” style of related terms. If you parse these out, there are some indicator keywords, but mostly they’re variants of the target term.
However, a subject matter expert might brainstorm a list such as:
Search result page, SERP
HTML, Head
Length, characters
Web browser display, bookmark
Social networks, Facebook, Open Graph, Twitter
SEO, On-page SEO, keyword targeting
Meta tags
The goal of including these indicator keywords above is not to target or rank for them, but to bolster the salience or aboutness of the target phrase.
8. Follow the Query Through
An extension of salience is addressing the question, “does this article answer all the subjects and questions a searcher might have when they search?” Google can identify these follow through topics and questions by looking at follow up searches and query refinement within search sessions. Google can improve searcher satisfaction if its able to satisfy searchers sooner by giving them content that eliminates the need for two to three additional searches.
If a user searches for “Emergency Fund,” they may have the following goals on their journey:
What is an Emergency Fund
How Much to Save
Types of Emergency Funds
How to Build an Emergency Fund
Try to cover these secondary topics in your articles. The depth of subjects covered depends on how broad the initial target keyword is. If the target phrase is a broad, head term, there may be many secondary topics, but if it’s a specific longtail phrase, there may be none. By doing this, you’ll naturally pick up additional indicator keywords that improve salience.
We often train writers to think through the journey of the searcher, relevant vocab terms, what secondary subjects a reader might need to know, and the frequently asked questions. These are included in the outline or brief and should be answered throughout the content. While SEO tools can be handy here, we’ve found that subject matter experts can do this more effectively than SEO tools alone.
9. Disambiguate Entities
Simplify your content around entities you want Google to extract successfully. There are two simple rules here:
Isolate the entities when not used in a sentence. When an entity is used outside of a sentence, try to isolate it in the text, and within an HTML tag where it appears, such as headings, list items, or table cells. If you’re using a bold as a “list label” or “list summary,” as I’m doing with this paragraph, put the entity in the tag by itself. Avoid grouping it with a price, year, category, parentheses, or any other data/text.
Use indicator words to disambiguate entities. When an entity can be confused, such as cities in multiple states, movies with the same name, or films vs. books, you can disambiguate entities by using indicator words in the same sentence. For the sentence “Portland is a great place to live,” the extracted entity is Portland, OR. For the sentence, “the Old Port neighborhood in Portland is a great place to live,” the extracted entity is Portland, ME. There is an entity relationship between “Portland (ME)” and “Old Port,” which allows Google to disambiguate the entity “Portland.” Brainstorm these indicator words when your entities could have multiple identities.
10. Use Structure to Convey Meaning
Structure and formatting have semantic meaning. These can be used to convey additional context for NLP understanding.
Here are some general best practices and concepts:
Inverted Pyramid: Articles have a lede, body, and a tail. Content has different meanings based on how far down the page it appears.
Headings: Headings define the content between it and the next heading.
Subtopics: Think of headings as sub-articles within the parent article.
Proximity: Proximity determines relationships. Words/phrases in the same sentence are closely related. Words/phrases in the same paragraph are related. Words/phrases in different sections are distantly related.
Relationships: Subheadings have a parent – > child relationship. (A page with a list of categories as H2s and products as H3s is a list of categories. A page with a list of products as H2s and categories as H3s is a list of products.)
HTML Tags:
Text doesn’t have to be in a heading tag to be a heading. (However, heading tags are preferred.)
Text also doesn’t need a heading tag to have a parent -> child relationship. Its display and font formatting can visually dictate this without the use of heading tags. (However, heading tags are preferred.)
Lists:
HTML ordered and unordered lists function as lists, which have a meaning.
Headings can also perform as lists.
Headings with a number first can work as an ordered list.
Ordered lists imply rankings, order, or process.
Short bolded “labels” or “summary” phrases at the start of a paragraph can function as a list.
Other Formats:
Tables inherently imply row/column relationships.
Some formatting suggests classification, like addresses and date formats.
Structure by Content Type: Some content types have expected data that define them. Events have names, locations, and dates. Products have names, brands, and prices.
How to Implement this in Your Content Program
Google’s advances in NLP require SEOs and content programs interested in driving distribution through organic search to start thinking more about the technical limitations Google has in understanding how we write. We’ve seen success in the last year by implementing these best practices. Currently, there are few tools that help guide this process, but a few tweaks to your process and training can cover a lot of ground.
Update training material and checklists to include an overview of these ten improvements to writing style. Our training material has a heavy emphasis on featured snippet targeting. The sole goal isn’t featured snippets, but focusing on them can drive broader success. Writing for featured snippets is writing for NLP.
Give writers featured snippet targets to pursue in each article, which are tracked and celebrated upon acquiring (along with an explanation of why their copy worked so well).
Place significant emphasis on readability and governance around content templates and formatting guidelines, which force articles into best practices around formatting and structure.
Introduce an additional stage to keyword research and creative brief development that brainstorms indicator keywords, search journey topics, and question keywords. This process also includes a step of researching the topics covered by the top 5 ranking articles for the keyword.
Create a short-term iterative process of SEO QA on articles before publication, which provides feedback to writers/editors on their first few articles after training.
If you have any comments or questions, hit me up on Twitter or leave a comment below.
via Briggsby
0 notes
Last Seen Blogs

thickleavein
THICK leave-in (blog)

thi-laststar
Beta Blast’s Art Space

myselfsissy
My Sissy Self

netsmp
Untitled

mzbathory
curiosities