#MACD
Text
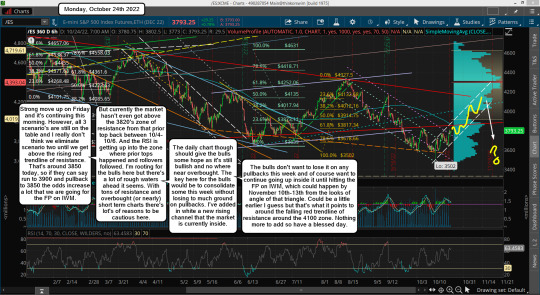
ES Morning Update October 24th 2022
ES Morning Update October 24th 2022
Strong move up on Friday and it’s continuing this morning. However, all 3 scenario’s are still on the table and I really don’t think we eliminate scenario two until we get above the rising red trendline of resistance. That’s around 3850 today, so if they can say run to 3900 and pullback to 3850 the odds increase a lot that we are going for the FP on IWM.
But currently the market hasn’t even got…
View On WordPress
#bearish#bull market#bullish#DOW#es futures#fake print#flash crash#FP#MACD#Nasdaq#rally#russell#SPX#spy#stock market#trendline
3 notes
·
View notes
Text
Zeebu Token Rebounds from 50-DMA, Eyeing $5 Milestone

As the cryptocurrency market experienced a notable downturn on Tuesday, investors may anticipate declining profits within their portfolios. The leading cryptocurrency, Bitcoin, encountered a significant drop of over 8%, concluding its daily trading session below the $62,000 threshold. This decline comes on the heels of Bitcoin's recent peak at a remarkable $73,750, marking a substantial 14% decrease within just six trading sessions.
To Know more- cryptocurrency market
#Zeebu Token#ZBU#ADX#cryptocurrency market#cryptocurrency#digital token#MACD#RSI enterprises#Zeebu Blog#coingabbar
0 notes
Text
Indicators that may be useful to you in the bull market!
BTC With the holding above $65,000, the bull run in the cryptocurrency market accelerated. Altcoins, which are rising one by one, continue to make crypto investors happy. Indicators, which make it easier to follow the course of the market, are even more critical with the bullish effect. So, what are the most valuable indicators to consider in the bull market?
1- Relative Strength Index (RSI)
One…

View On WordPress
0 notes
Text
Whales Unload $SHIB Worth Millions During Price Surge, According to Report
The recent surge in the price of Shiba Inu ($SHIB) has triggered a closer examination of the strategic moves made by key players in the cryptocurrency market. Smart trader 0x37d demonstrated sharp market foresight by withdrawing 75.91 billion $SHIB from Binance two days before the price surge, resulting in a 69% profit of around $614,000. This well-timed withdrawal showcased the trader's keen understanding of market dynamics.
Founder of MakerDAO, Rune Christensen, entered the $SHIB market with a strategic investment of 100,000 $USDC, acquiring 7.41 billion $SHIB just 13 hours before the price hike. The move led to a 47.1% gain, contributing to increased investor confidence in $SHIB. Christensen's high-profile purchase highlighted the influence of key figures in the cryptocurrency world.
In addition to individual moves, a wallet linked to Upbit, known as 0x02e, accumulated an impressive 2.13 trillion $SHIB in the past 24 hours, becoming the 7th largest $SHIB holder with a total of 12.45 trillion $SHIB valued at $247 million. This accumulation underscored the growing interest in $SHIB among major market players.
Despite strategic moves driving the surge, a whale seized the opportunity to realize profits by depositing 365.36 billion $SHIB, worth $5.76 million, into Binance over the past 11 hours for selling. These profit-taking transactions across five addresses reflected significant activity in response to the price surge.
Technical indicators aligned with the $SHIB price rally, with the 1-Day Relative Strength Index (RSI) peaking at 96.31, indicating potential overbought conditions. The 1-Day Know Sure Thing (KST) and Moving Average Convergence Divergence (MACD) readings signaled strong buying pressure and a bullish trend, respectively. The strategic moves by key players have played a crucial role in propelling $SHIB to a notable surge, capturing the attention of traders and investors in the cryptocurrency market.
0 notes
Text
Ethereum Price Analysis: Surge Towards $4000 Imminent

Ethereum's price is breaking above the $3550 resistance level, closely following Bitcoin's lead and potentially targeting the $4000 resistance zone soon.
Ethereum Initiates a Fresh Rally
Ethereum's price surge persists above the $3500 mark, mirroring Bitcoin's upward momentum. BTC surged and surpassed the $68,000 level. ETH exhibits signs of strength, climbing above $3650.
A significant move above $3700 has occurred, marking a new multi-month high at $3715. Currently, the price is consolidating gains, trading above the 23.6% Fibonacci retracement level.
Ethereum is currently trading above $3650 and the 100-hour simple moving average. On the hourly ETH/USD chart, a bullish trend line is forming with support near $3600, closely aligning with the 50% Fibonacci retracement level.
Resistance Levels and Potential Upside
Immediate resistance to the upside lies near $3720, followed by significant levels at $3780 and $3850. A break above $3850 could fuel bullish momentum, possibly targeting $3920 next.
If Ethereum moves above the $3920 resistance, it could even rally towards $4000, potentially requiring a test of $4200 for further upside.
Downside Correction for Ethereum?
Failure to overcome the $3720 resistance might trigger a downside correction. Initial support is near $3650, followed by the $3600 zone and the bullish trend line. A significant support zone lies near $3550, with further losses possibly extending to $3420 and $3350.
Technical Indicators
- Hourly MACD: The MACD for ETH/USD is gaining momentum in the bullish zone.
- Hourly RSI: The RSI for ETH/USD is currently above the 50 level.
Key Levels
- Primary Support: $3600
- Primary Resistance: $3720
Read the full article
#Bitcoin#BTC#BullishTrendLine#Cryptomarketanalysis#Cryptocurrency#DownsideCorrection#ETH#Ethereum#Fibonacciretracement#MACD#MarketForecast#priceanalysis#resistancelevels#RSI#supportlevels#TechnicalAnalysis#UpsidePotential
0 notes
Text
XRP at a Crucial Juncture: Will Liquidity Absorption Alter the Game?
The XRP market finds itself at a critical juncture, with the emergence of potential signs of liquidity absorption sparking questions about the cryptocurrency's future trajectory. A sudden dip in XRP/USDT has raised concerns among traders and investors, prompting a closer examination of key indicators that could influence its price movements.
As of the latest update, XRP is trading at $0.509052, accompanied by a 24-hour trading volume of $1.7 billion. The past 24 hours have seen a 5.18% decline in XRP, heightening the apprehension within the market. A detailed analysis of the 4-hour Relative Strength Index (RSI) reveals a value of 31.63, indicating that XRP has entered oversold territory. This signals the potential for a price correction or a rebound in the near future.
A deeper dive into the 4-hour chart showcases the 50 EMA, 100 EMA, and 200 EMA, all pointing towards a short-term downward trend for XRP. The 4-hour Moving Average Convergence Divergence (MACD) aligns with this, reflecting negative momentum in XRP's price.
While these indicators collectively present a complex picture, the oversold RSI, combined with the downward momentum signaled by the MACD, suggests that XRP could be poised for a price correction. However, it is crucial to acknowledge the inherent unpredictability of cryptocurrency markets, where various factors can influence the direction of prices.
An essential factor to consider is the overall sentiment in the cryptocurrency space, as news, regulatory changes, and market sentiment can significantly impact XRP's price movements. Staying informed and prepared for potential market shifts becomes imperative for traders and investors in this context.
Moreover, the concept of liquidity absorption and approaching the order block introduces the potential for alterations in market structure. Traders are advised to closely monitor XRP's price action in the coming days, as it could offer valuable insights into the cryptocurrency's future direction.
In conclusion, XRP stands at a crossroads, with keen attention on signs of liquidity absorption and potential shifts in market structure. The combination of an oversold RSI and downward momentum in the MACD hints at the possibility of a price correction or rebound. However, the inherent volatility of the cryptocurrency market emphasizes the need for caution and constant awareness of external factors influencing XRP's price movements
0 notes
Text
Learn How To Combine RSI Reading With Other Indicators For Strong Confirmation

Throughout this article, we will explore how to combine RSI readings with other indicators, including Moving Averages, Bollinger Bands, and Fibonacci retracements.
0 notes
Video
youtube
MACD Trading Tutorial Step-by-Step Guide for Beginners 2023
0 notes
Link
MACD(移動平均収束拡散)指標の概要と応用方法
MACD(移動平均収束拡散)は、トレーダーが使用する広く認知されたテクニカル指標で、市場のトレンドや勢いを分析するためのツールです。MACDは短期と長期の移動平均の差を計算し、その差をもとに市場の変化や方向性を示します。この指標は、トレンドフォローや過買い・過売りのポイントの特定に役立ち、投資家とトレーダーが自分の戦略に合わせて市場を評価するのに役立つ情報を提供します。
この文章は、MACD(移動平均収束拡散)指標の基本的な概念と構成、そしてそれがどのようにトレンドフォローや過買い・過売りのポイントの検出に使用されるかについて解説しています。MACDの各要素であるMACDライン、シグナルライン、およびヒストグラムの役割が説明されており、またMACDの制限や他の技術指標との組み合わせの重要性も触れられています。これにより、トレーダーや投資家がMACDを効果的に活用するための理解とヒントが提供されています。
0 notes
Link
주식 차트 그리기: 이동평균선과 MACD 지표 시각화
이 포스트는 주식시장의 트렌드 분석을 위한 그래프를 그리는 과정을 자세히 설명하며, 초기 설정부터 데이터 준비, 이동평균선과 캔들스틱 차트, MACD 지표 및 오실레이터 히스토그램까지 다양한 단계를 다룹니다. 주식 시장 데이터를 다운로드하고 처리하는 방법, 그리고 주식의 흐름을 분석하는 중요한 지표들을 시각화하여 이해하기 쉽게 표현하는 방법을 제공합니다. 이 글은 초보자부터 중급자까지 주식 시장 데이터를 분석하고 시각화하는데 유용한 내용을 제공합니다.
0 notes
Video
youtube
The Ultimate MACD Strategy | Olymp Trade 1 Minute Winning Strategy
0 notes
Text
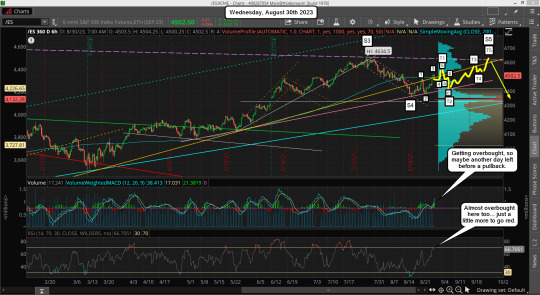
ES Morning Update August 30th 2023
Yesterday looked a lot like the Tiny Wave 3 up that I was really thinking would take longer to play out, but when the market triggers stops the squeeze is vicious. Either this morning or Friday morning after the jobs report should finish it though as I suspect we’ll take out the stops above the 8/14 high and then pullback for Tiny Wave 4… which at the rate this market is going might end up being…
View On WordPress
#2023#30th#august#bearish#bull market#bullish#daily#DOW#es futures#fake print#flash crash#FP#MACD#morning#Nasdaq#rally#reds#russell#SPX#spy#stock market#trendline#update#updates
0 notes
Text
Forex 1-Hour Trading Strategy
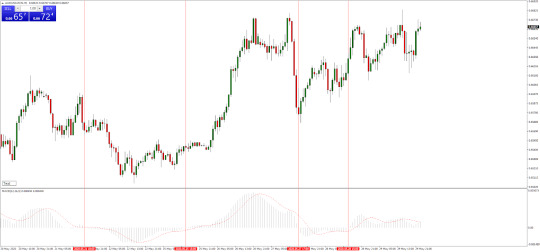
You can take advantage of the 60-minute time frame in this Forex strategy. The most suitable currency pairs to trade using this Forex strategy are the EUR/USD, USD/JPY, GBP/USD, and the AUD/USD. In regards to the Forex trading strategies resources used for this type of strategy, the MACD is the most suitable which is available on both MetaTrader 4 and MetaTrader 5.
Buy Trade Rules:
You can enter a long position when the MACD histogram goes above the zero line. The stop loss could be placed at a recent swing low.
Sell Trade Rules:
You can enter a short position when the MACD histogram goes below the zero line. The stop loss could be placed at a recent swing high.
#MACD#histogram#forex indicators#forex system#forextrading#forex strategy#stocks#daytrader#options#investing#bitcoin#cryptotrading#forexmarket#investor#forex#forexbroker#forexsignals#forexmentor#trader
1 note
·
View note
Text
Ethereum Layer 2 Transactions Skyrocket by 91% in 2024: In-Depth Analysis
Ethereum's Layer 2 solutions are experiencing a substantial surge, with transaction volumes witnessing an impressive 91% increase since the start of the year, as reported by blockchain analytics firm IntoTheBlock.
This surge in activity on Layer 2 solutions emphasizes the growing importance of scalability measures within the Ethereum network. It signifies a tangible shift towards more efficient and cost-effective transactions, addressing the increasing demand for enhanced performance in the blockchain space.
The notable uptick in transaction volumes on Layer 2 solutions is making a significant impact on Ethereum's overall transaction throughput. This surge comes at a time when scalability concerns have been a central topic of discussion in the blockchain community, highlighting the potential effectiveness of Layer 2 solutions in mitigating congestion on the Ethereum mainnet.
The increased adoption of Layer 2 solutions underscores the resilience of the blockchain community in tackling scalability challenges, ultimately enhancing the user experience and positioning Ethereum as a dynamic and adaptive blockchain platform.
0 notes
Link
#BlockDAG-powered#CoinMarketCap#contract#Crypto#dApps#exchange#MACD#platform#smart#TARA#Taraxa#TradingView
0 notes
Text
Bollinger Bands Strategy Guide to Trading Success Trading

The key to success in the ever-changing world of trading is the ability to anticipate market moves and make calculated choices. Bollinger Bands is a popular strategy among traders because of its flexibility and efficiency. This in-depth manual will teach you everything you need to know to use this trading strategy successfully.
An Overview of the Bollinger Bands Strategy

Bollinger Bands Strategy
The Bollinger Bands Strategy is defined as follows.
John Bollinger created the Bollinger Bands strategy in the 1980s as a technical analysis tool. Its purpose is to aid traders in determining when to enter and quit the market. The process employs a triangular plot with a simple moving average in the center and two lines at different standard deviations above and below it. This produces a moving border around the price activity, giving traders a graphical depiction of the market's condition.
Where Bollinger Bands Came From and Why They Matter in Trading
Technical analyst veteran John Bollinger first popularized the Bollinger Bands.
The strategy's value comes from its ability to quantify market volatility and provide benchmarks for a price high or low. Because of its importance in spotting trading opportunities and controlling risk, this data is a must-have for investors.
Learning How Bollinger Bands Are Made
Bollinger Bands include three primary parts:
The Center Line: This short moving average is a foundation for the upper and lower bands. As a symbol of the trend in the medium term, it is often a point of support or resistance.
Overbought conditions are indicated by a move above the Upper Band, which may be seen as a signal to reduce holdings. When the price of an asset reaches or passes this level, it may be a sign that it is overvalued and that a decline in its value is likely.
As indicated by the Lower Band presence, Oversold situations may signal a good time to purchase. Price action around or crossing this level may tell that the asset is underpriced, and a price rise is likely.

Top Methods For Using Bollinger Bands
Profitable Trading Requires Recognizing The Bollinger Squeeze
Top Methods for Using Bollinger Bands
Profitable Trading Requires Recognizing the Bollinger Squeeze
An essential part of the Bollinger Bands strategy is the Bollinger Squeeze. This happens when there is less volatility in the market and the bands' contract. When the band's arrangement is like this, volatility increases, causing significant price swings. Squeezes like this may provide profitable trading chances, so traders watch for them.
Taking Advantage of Market Volatility with the Bollinger Bounce
Another crucial idea essential to the Bollinger Bands strategy is the Bollinger Bounce.
That's jargon for how often prices "bounce" between the two bands. Markets whose prices tend to fluctuate between a specific high and low might benefit significantly from recognizing this trend.
Why RSI and Bollinger Bands Work So Well Together
The efficiency of your trading strategy may be improved by integrating Bollinger Bands with the Relative Strength Index (RSI). The Relative Strength Index (RSI) is a momentum oscillator that evaluates the price change rate. Used in tandem with Bollinger Bands, it may corroborate the signals given by the bands, lowering the chance of receiving a false signal and increasing the strategy's overall dependability.
Strategy for Using Bollinger Bands
Preparing Your Trading Platform Using Bollinger Bands
Bollinger Bands are a standard indicator on most trading platforms. Please select it from the list of possible hands, then tweak the parameters to your liking. Bollinger Bands have two standard deviations for the upper and lower bands and a 20-day simple moving average for the center line. But you may tweak these parameters to suit your trading preferences and time horizon.
Bollinger Bands: An Introduction and Explanation
Bollinger Bands are easy to understand and apply.
A widening of the bands shows increased market volatility. Conversely, narrower bands are indicative of lower volatility. Prices tend to fluctuate towards the bands during high volatility and shift closer to the center line during low volatility.
Traders might utilize these insights to spot future market openings. When the price reaches the top band, it may be time to sell, while when it goes to the lower band, it may be time to purchase. These signals, however, should be double-checked with other indications to ensure their accuracy.
Divergence, convergence, and other high-level methods
Expert traders often use Bollinger Bands to search for divergence and convergence patterns. When the price and band trends are heading in opposing directions, we have divergence; when they run similarly, we see convergence. These patterns may help traders spot good opportunities by revealing information about possible market reversals.
Bollinger Bands and Compatible Indicators
Bollinger Bands and Simple Moving Averages: A Powerful Combination
Smoothing out price data using moving averages makes it worthwhile in technical analysis since patterns become more apparent. When combined with Bollinger Bands, these indicators are helpful for trading. For instance, a trading opportunity may present when the price moves above or below a moving average line.

An Unbeatable Combination: Macd And Bollinger Bands
An Unbeatable Combination: MACD and Bollinger Bands
Another common technique that combines nicely with Bollinger Bands is the Moving Average Convergence Divergence (MACD). The Moving Average Convergence Divergence (MACD) is a momentum indicator that tracks price trends. When used with Bollinger Bands, it may corroborate the signals provided by the bands, making their signs more trustworthy.
A Potent Combination of the Relative Strength Index (RSI) and Bollinger Bands
The Relative Strength Index (RSI) is a momentum oscillator that evaluates the price change rate. By highlighting overbought and oversold circumstances, Bollinger Bands may serve as a helpful trading indication. When the price reaches the upper band and the RSI shows overbought events, this is an excellent time to sell.
Analysis of Bollinger Bands' Performance
The Reasons Why Bollinger Bands Are So Popular With Traders
Because of their adaptability, Bollinger Bands are often used in trading. They are helpful for both short-term traders and long-term investors since they can be used across all markets and time durations. And since they show the market situation graphically, even inexperienced traders can understand them.
Using Bollinger Bands Successfully in Real-World Trading Scenarios
Bollinger Bands have been used successfully by many traders. This trading strategy has shown itself successful time and time again, as seen by these examples of its use. Examples of this use include the identification of overbought/oversold circumstances in range-bound markets and the identification of breakouts in turbulent markets.
What Bollinger Bands Can't Tell You and How to Fix It
Bollinger Bands, like any other trading technique, has its limits. For instance, they may give out misleading readings during high volatility. A disciplined trading strategy and supplementary indicators help traders get beyond these restrictions. Combining Bollinger Bands with other indicators like the Relative Strength Index (RSI) or the Moving Average Convergence Divergence (MACD) may assist in eliminating spurious signals and boost the strategy's consistency.
Improving Your Use of Bollinger Bands
How to Use Price Movement with Bollinger Bands
The term "price action" describes the fluctuations in the value of securities, which are often shown in real-time on a chart. Bollinger Bands are helpful, but you may get more insight into market behavior by including price action in your strategy. For instance, pin bars and engulfing patterns are two examples of price action patterns that may indicate a market reversal. Strong trading signals may be generated by the appearance of such patterns at the band's upper or lower boundary.
Bollinger Bands and the Importance of Candlestick Patterns Trading
Potential market reversals might be predicted with the use of candlestick patterns. Bollinger Bands help determine when to enter and leave a market. For example, in the lower band, a bullish engulfing pattern might indicate a buying chance, while near the higher bar, a bearish engulfing pattern could indicate a selling opportunity.
The Importance of Risk Management in Bollinger Bands Trading
A successful trading strategy must prioritize risk control. Stop-loss orders may
Control losses and gains can be cashed at predefined points. Stop-loss orders may be placed above the upper band or below the lower band when using Bollinger Bands to guard against potentially disastrous price swings. Similarly, take-profit orders might be placed in the opposite band to benefit from price increases.
Market Conditions and Bollinger Bands
Market Trends and Bollinger Bands
Bollinger Bands help determine when to enter and leave moving markets. The upper and lower bands can serve as shifting support and resistance zones. In an upward trend, for instance, a price that encounters resistance at the lower Bollinger Bands may rebound off that level and proceed toward the upper Bands, creating a purchasing opportunity. When prices fall, they can bounce off the upper band and go back down, creating a selling opportunity.
The Breakout Strategy for Bollinger Bands in Choppy Markets
Bollinger Bands are helpful in sideways markets because they reveal stretches of low volatility that usually precede a breakthrough. Investors might use this data to be ready for any price shifts. For instance, if the bands narrow, it may be a precursor to a breakthrough. When a breakout occurs, traders may cash in by placing entry orders either above the upper band or below the lower band.
Bollinger Bands: Riding the Waves in Turbulent Markets
When market volatility is high, Bollinger Bands widen to account for more price movement. Investors might use this data in their trading techniques. They may, for instance, increase the distance between their stop-loss and take-profit levels in anticipation of the higher levels of volatility.
Different Trading Strategies Using Bollinger Bands
Bollinger Bands for Swing Trading: Taking Advantage of Price Movements
Swing traders may use Bollinger Bands to forecast price changes. The higher and lower bands represent possible turning points. For instance, a chance to sell may present itself when the price increases to the upper band. The same holds for the bottom band, as a price touching that level may indicate a possible upward movement and a purchasing opportunity.

Using Bollinger Bands
Using Bollinger Bands for Intraday Trading
Day traders may use Bollinger Bands to monitor temporary price shifts. The strategy may aid in providing signs for entering and leaving markets quickly. For instance, a touch of the upper band may indicate a short-term selling opportunity, while a touch of the lower band may indicate a short-term purchasing opportunity.
Using Bollinger Bands Patiently for Long-Term Gains
Bollinger Bands may help long-term investors see possible shifts in the market's long-term trend. Signals for promising long-term investments may be gleaned by using the strategy. For instance, if the price stays above the upper band for an extended time, it may indicate a robust upward trend and a promising chance for long-term investment. Similarly, if prices stay below the lower range for an extended time, it may indicate a significant negative trend and provide an opportunity for short sellers.
Successfully Using Bollinger Bands, Final Thoughts
Bollinger Bands is a strategy that calls for time and dedication to master. However, if you take the time to learn how it works, you can use it to your advantage in the trading world, bolstering your strategy while increasing your earnings. In trading, remember that finding opportunities is just half the battle; the other half is risk management. Never put more money at risk in the market than you can afford to lose.
Read the full article
#BollingerBands#ForexTrading#MACD#MarketTrends#MovingAverage#PriceAction#RSI#StandardDeviation#TechnicalAnalysis#TradingSignals#TradingStrategy#Volatility
0 notes
Last Seen Blogs

fuckingmoonprince
Skinny Flowers

shiboritate
しぼりたての質問箱(仮)

divinecomplex
HEIROPHILIC

kyum69
✨Seungkyum supremacy✨

sinnical-bastard1
Scream’s Without The S