#VIX volatility index
Text
US stocks open lower despite job additions beating estimate
New Post has been published on https://www.timesofocean.com/us-stocks-open-lower-despite-job-additions-beating-estimate/
US stocks open lower despite job additions beating estimate

New York (The Times Groupe)- US stock markets opened lower on Friday despite higher job gains in May than expected.
The Dow was down 266 points, or 0.8%, to 32,981 points at 9.31 a.m. EDT (1331GMT). The S&P 500 fell 49, or 1.2%, to 4,127.
Even after gaining 2.7% in the previous session, the tech-heavy Nasdaq was off 200 points, or 1.6%, to 12,117 at the time.
According to the Labor Department, the US economy added 390,000 jobs in May, above the market estimate of 325,000.
As a result, the VIX volatility index, also known as the fear index, rose 3.6% to 25.61.
The dollar index rose 0.14% to 101.97 and the 10-year US Treasury yield increased 2.1% to 2.977%.
In precious metals, gold fell 0.4% to $1,862 and silver fell 0.3% to $22.25.
Crude prices increased slightly. Global oil benchmark Brent crude was trading at $117.84 for a 0.2% gain, while American benchmark West Texas Intermediate (WTI) was at $117.16 — a 0.25% increase.
#American benchmark West Texas Intermediate (WTI)#business news#crude prices#economy news#energy prices#Global oil benchmark Brent crude#latest News#The Times Groupe#Times#Times Of Ocean#US economy news#us job additions#US Labor Department#us news#US stock markets#US stocks#VIX volatility index#Economy
0 notes
Text
Understanding Stock Market Volatility: A Closer Look at the CBOE Volatility Index (VIX)
Written by Delvin
The stock market is a dynamic environment, subject to periods of both stability and volatility. Investors and traders alike often monitor the ebb and flow of the market’s volatility, seeking to understand and anticipate its impact on their investments. Central to this quest is the CBOE Volatility Index (VIX), commonly known as the “fear gauge,” a measure of the market’s…
View On WordPress
#CBOE Volatility Index (VIX)#dailyprompt#Financial#knowledge#money#Money Fun Facts#Stock Market#Stock Market Volatility#Stocks
0 notes
Text
How to buy stocks on the brink of a bear market
How to buy stocks on the brink of a bear market
It seemed like everyone was in a buying mood on Friday, except Elon Musk. The Dow Jones Industrial Average broke a six-day losing streak, the Nasdaq Composite turned in its second positive session in a row, and the S&P 500 was up over 2%, a small step back from the brink of a bear market, ending the week 16.50% off its 52-week high. But any single-day stock gains in this market are tenuous. The…

View On WordPress
#Apple Inc.#ARK Innovation ETF#Business#business news#CBOE Volatility Index#Dow Jones Industrial Average#Ford Motor Co.#General Motors Co.#NASDAQ Composite#personal investing#PowerShares QQQ Trust#Rivian Automotive Inc#S&P 500 Index#Stock markets#VIX Index (Mar&039;21)
0 notes
Text
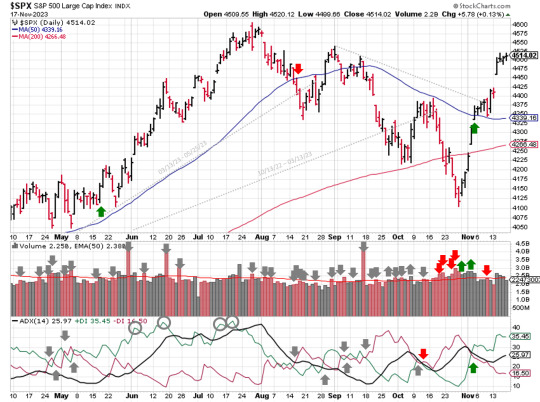
Weekend Stock Market Outlook - November 19 2023
Stock Market Outlook entering the Week of November 19th = Uptrend
ADX Directional Indicators: Uptrend
Price & Volume Signals: Uptrend
Elliott Wave Analysis: Downtrend
ANALYSIS
The stock market outlook heads into the third week of the current uptrend, and there’s STILL no shortage of volatility within the stock market, despite the volatility index ($VIX) showing a low volatility environment.
The…
View On WordPress
7 notes
·
View notes
Text
Nice historical volatility chart
This is a helpful annotated chart of yearly S&P 500 volatility. I bookmarked it back in 2014, so it only covers the years from 1929 to 2014.

S&P 500 calendar year realized volatility from 1929-2014 $SPY $SPX $VIX
— via Ro_Patel on StockTwits, October 09, 2014
The y-axis is S&P Calendar Year Realized Volatility as a percentage. The x-axis is time in years. I hope it is possible to enlarge the image by clicking on it! The red bars represent the 10 years with highest volatility. The green bars represent the 10 years with the lowest volatility. I am guessing that the blue bars are all other years.
I wondered why the chart was tagged with $SPY $SPX and $VIX. Both StockTwits and Twitter used to denote stock symbols with a dollar sign instead of a hash tag.
The first two were easy. SPY is an ETF that is backed by actual shares of stock in the companies that are included in Standard & Poor's 500 index. SPX is driven by the price of the S&P 500 Index itself. SPX isn't tradeable per se, but there are SPX futures and various SPX options.
Volatility and the fear indicator
Volatility is the standard deviation of a stock, stock index, or other security's annualized returns over a time period; essentially, the rate at which the security or index price increases or decreases. ‘Actual’ (historical) volatility measures the variability of known prices.
What is $VIX
VIX is called the fear indicator because it is used to infer a quantitative metric of market risk, fear, and stress. It is defined as the 30-day expected volatility of the S&P 500 stock index, using Chicago Board Options Exchange (CBOE) listed S&P 500 options data. VIX is a measure of implied volatility (forward-looking) not historical. Values over 30 are considered high, while 20 is more typical. There's no upper bound on VIX.
The VIX isn't tradeable, which is why I am amused that its CBOE landing page (URL above) has "tradeable" in the URL! Instead, there are VIX futures, call and put options for trading.
The VIX was introduced by CBOE in 1993. I think that's why this chart doesn't have VIX on the y-axis (only alluding to it with $VIX) as an historical time series. It wouldn't be possible to impute historical values, especially not to 1929 but not even prior to 1993, because VIX is calculated by aggregating weighted prices of a constantly changing portfolio of S&P 500 calls and puts over a range of strike prices.
StockTwits
StockTwits seems mostly moribund to me, since about 2015. The name is a little strange, but it is a great idea: A social network for investor/speculators. The realtime, Twitter-like functionality, and user interface, are well-designed and fun. I think StockTwits was founded by Howard Lindzon who is nice, and maybe Fred Wilson the AVC guy ("A Venture Capitalist"?). EDIT: I just checked. It is still active but not exactly a huge startup venture.
Now that Amazon.com has retired Alexa, I can't find website metrics as easily. I'm mildly curious about StockTwits. I wish I could average unique annual page views per year, and then do a 3-line time series graph of unique daily views during 2012 (when it was really active), 2015, and last year.
5 notes
·
View notes
Text
VIX Death Cross Historically Bullish for S&P 500 over Next 2 Weeks
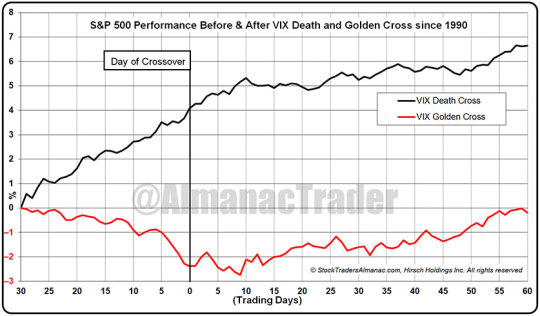
On Friday December 9, a Death Cross appeared on a chart of CBOE Volatility Index (VIX). A Death Cross occurs when the 50 day moving average crosses below the 200-day moving average. When this happens to an individual stock or major index like S&P 500 it is normally considered bearish. But since the VIX is designed to measure near-term market volatility the lower it goes the better the S&P 500 usually performs. Thus, a VIX Death Cross can be a bullish indication.
Going back to 1990, including the most recent cross, there have been 36 VIX Death Crosses. The S&P 500’s average performance 30 trading days before and 60 trading days after the past 35 VIX Death Crosses have been plotted in the following chart. In the 30 trading days prior to the VIX Death Cross, S&P 500 rose an average of 4.1%. This solid advance is what played a large role in the VIX Death Cross as a rising market is normally accompanied by falling volatility and a declining VIX. After the Death Cross, S&P 500 continued to climb another 2.5% over the next 60 trading days.
Also included on the chart are the 35 VIX Golden Crosses. A Golden Cross is just the opposite of a Death Cross, the 50-day moving average crosses above the 200-day moving average as VIX is rising. A VIX Golden Cross is not a good event for S&P 500 as it has typically declined an average 2.4% before the VIX Golden Cross and failed to return to breakeven 60 trading days later.
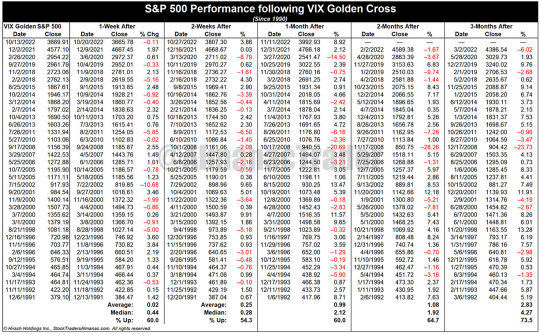
In following tables, we present the S&P 500 performance after past VIX Death Crosses and VIX Golden Crosses across various timeframes. Based upon average performance the near-term, 1-and 2-week S&P 500 performance following a VIX Death Cross is better than a VIX Golden Cross, but by 1-month later and beyond the results are less clear. This would suggest that the current VIX Death Cross is likely bullish in the near-term, but not a great indication much beyond 2-weeks.
Click here for VIX Death Cross Table...

Click here for VIX Golden Cross Table...
4 notes
·
View notes
Text
NEW ALGO LAUNCH: I have been trading the Volatility Index since no overnight holding fees on the VIX at YLDFX launched. Banking over £22,000 in the last 2 months alone. I have been developing a VIX algorithm that will automatically open, close and manage the trades based on the inputs.
The algorithm is capable of trading with as little as £500 account balances and also does not use hedging within its strategy. The algorithm is set to hit our customers by storm due to the popularity of trading the VIX, allowing both large accounts and small accounts to take advantage.
We are allowing 50 pre-orders at a discounted rate and priority dispatch of the algorithm. Our website will list the VIX Algo at a full price of £1,000 + VAT. However, by pre-ordering and locking in just £250 today, you will get the VIX Algo for a total discounted price of £750+VAT saving £250 and getting first access.
If you want to secure a 1 of 50 chance be quick...
3 notes
·
View notes
Text
My Investing Style
Active Manager
Create Custom Growth Portfolio Index Fund
DAX® index
the S&P 500
S&P GSCI Crude Oil
the FTSE 100
S&P/TSX 60 index
S&P/ASX 200
Asian-Pacific
Foreign Bond Markets
Japanese Gold Market
Quanto Bond futures
Histogram for Indices/Index (Return-Risk Ratio & Frequency Distribution)
VIX Index for Volatility
Black-Scholes Model*
Need to Learn
Laspeyre's Method
Paasche Method
Company Comparison Analysis
Company's Performance Ratio
Discounted Cash Flow Modeling (DCF)
Capital Asset Pricing Model (CAPM)
Open Market Operations Hedging Techniques
Forex
REITs dividends allocated to options shorting
Married Puts (Short)
VIX Index for Volatility
Insurance Company Techniques
VIX Index for Volatility
Cash-secured Put Option
Quantity-Adjusting Option (Quanto Put Option)
Multi-leg options order if selling
CHAD GIRL
0 notes
Text
PR Sundar Finfluencer Prediction: NIFTY to Reach 24K in 2024
As investors try to figure out what's going to happen in the stock market this year, there's a lot of talk about what's going to happen with NIFTY, which shows how well the top companies in India are doing. Some people think it's going to go up a lot, while others aren't so sure. One person who's got a lot of people listening is PR Sundar, a well-known expert in the stock market.
In a recent talk, PR Sundar Finfluencer explained why he thinks NIFTY will reach 24,000 points by the end of 2024. He looked at a bunch of different things like how the market has behaved in the past and how risky it is to invest.
Sundar started off by talking about something called the Volatility Index (VIX), which measures how much the market goes up and down. He said that with the VIX staying steady at 12 to 13, it suggests that NIFTY could swing by about 12% in either direction. But he also warned that investors need to be careful because the market can change a lot in the short term, even though it usually goes up over time. So, he thinks a safer estimate would be for NIFTY to change by about 9 to 10%, which matches up with what's happened before.
Read More
0 notes
Link
0 notes
Text
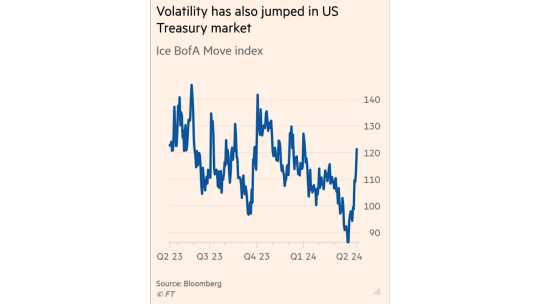
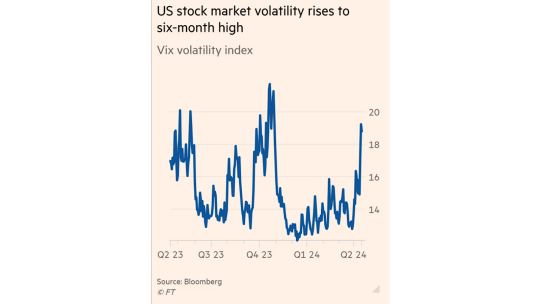
#Vix ‘fear gauge’ soars on Middle East tension and interest rate shift
#Volatility index at highest since October as investors step up protection against downside risk to equities
https://www.ft.com/content/dddd996e-0ac0-48cf-b76a-99745e7b4c56 via @ft #vol #riskarb #investments $spx $qqq
0 notes
Text
Implied volatility while trading options
Implied volatility (IV) is a critical concept in options trading, representing the market's expectation of future volatility of the underlying asset. Unlike historical volatility, which measures past price fluctuations, implied volatility reflects the collective opinion of market participants regarding potential future price movements.
Key Points about Implied Volatility:
Option Pricing Model: Implied volatility is a crucial component of option pricing models, such as the Black-Scholes model. It helps determine the theoretical value of an option.
Influencing Factors:
Market Sentiment: Bullish or bearish sentiments can affect implied volatility. High implied volatility often indicates uncertainty or fear in the market, while low implied volatility suggests confidence or complacency.
Events and News: Implied volatility tends to rise ahead of significant events like earnings announcements, economic data releases, or geopolitical developments.
Supply and Demand: Implied volatility is influenced by supply and demand dynamics in the options market. Increased demand for options contracts typically leads to higher implied volatility, and vice versa.
Time to Expiration: Implied volatility may vary across different expiration dates. Options with longer expiration periods generally have higher implied volatility due to increased uncertainty about future price movements.
Options Strategies:
Traders often incorporate implied volatility into their options strategies. For example, they may buy options when implied volatility is low (anticipating an increase) or sell options when implied volatility is high (anticipating a decrease).
Volatility-based strategies, such as straddles and strangles, capitalize on anticipated changes in implied volatility.
Volatility Skew: Implied volatility can exhibit a skew across different strike prices and expiration dates. This skew reflects market expectations regarding the likelihood of extreme price movements.
Risk Management: Implied volatility plays a crucial role in risk management for options traders. It helps assess the potential risk and reward of options positions and can guide decisions regarding position sizing and hedging strategies.
Historical vs. Implied Volatility: While historical volatility provides insights into past price movements, implied volatility focuses on future expectations. Discrepancies between implied and historical volatility can signal potential trading opportunities or mispricings in the options market.
Implied Volatility Indexes: Some exchanges calculate implied volatility indexes, such as the VIX (Volatility Index) in the U.S. These indexes track market expectations of future volatility and are widely used as indicators of market sentiment and risk appetite.
Understanding implied volatility is essential for options traders as it influences option prices and can impact trading strategies and risk management decisions. Traders often monitor changes in implied volatility to identify potential opportunities and manage portfolio risk effectively.
0 notes
Text
The mainland's foreign trade performance last month was worse than market expectations, and Hong Kong stocks further bottomed out in late trading. The Hang Seng Index opened 116 points lower at 16,978 points and continued its decline. It closed at the day's low of 16,721 points, down 373 points or 2.18%, slightly down 2 points for the week; the Technology Index fell 63 points or 1.8% to 3,474 points. Main board transaction volume was HK$106.2 billion.
The market is worried that the mainland will fall into deflation again, and it still needs to wait and see whether the data will improve further. Therefore, although the recent technical trend of Hong Kong stocks has improved, it has still failed to rise above the important resistance of the last high of 17,214 points. After the performance period, the performance of stocks was polarized. Resource stocks, oil stocks and Chinese telecommunications stocks continued to remain strong. Technology and Internet stocks such as Meituan and Tencent also saw improvements. However, some stocks, such as AIA, were relatively weak after performance. With the differentiation between strong and weak stocks, it is difficult for Hong Kong stocks to see a clear direction. You may wish to pick strong stocks for speculation. If the Hang Seng Index rises above the resistance of 17,214 points, I believe that strong stocks will further break through by then, driving the Hang Seng Index to the 250-DMA (17,866) level. According to an earlier forecast by Standard Chartered, Hong Kong stocks may rise to 18,100 points on the Hang Seng Index in the next 12 months.
European stock markets developed individually. Led by oil and mining stocks, British stocks rose 0.91%, while French and German stocks both fell more than 0.1%.
The situation in the Middle East took a turn for the worse. The market was worried about a head-on conflict between Israel and Iran. U.S. stocks came under significant pressure on Friday. After the Dow opened 139 points lower, it then surged 581 points to a low of 37,877 points. The S&P 500 index fell as much as 1.75%, led by technology. The stock-heavy Nasdaq fell 1.93%. , the U.S. stock market closed with the Dow still down 475 points, or 1.24%, at 37,983 points; the S&P Index fell 75 points, or 1.46%, at 5,123 points; the Nasdaq fell 267 points, or 1.62%, at 16,175 points.
All three major U.S. stock indexes posted declines for the second consecutive week. The Dow fell for a fifth straight session. Investors are paying close attention to the outlook for Federal Reserve policy and geopolitical tensions in the Middle East. The CEOs of JPMorgan Chase and BlackRock both expressed concerns about inflationary pressures in the United States. The CBOE Volatility Index (VIX), commonly known as the "fear gauge," surged. The VIX typically falls when the broader market rises and spikes when stocks plunge.
The U.S. dollar index rose 0.79% to 106.11, and the yen rose 0.44% to 152.59 per dollar. The British economy grew by 0.1% in February, in line with expectations, and has risen for two consecutive months. However, the pound still fell 1% to US$1.2427, and the euro fell by up to 0.96% to US$1.0623, a five-month low.
0 notes
Text
VIX and Volatility Have Historically Increased August through October
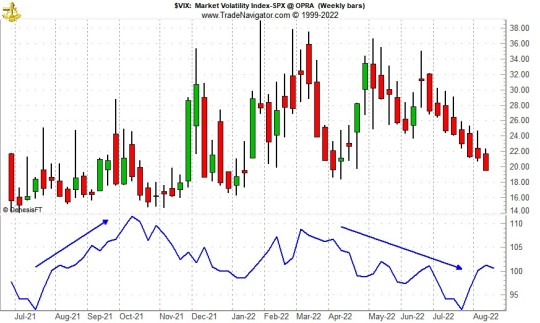
Historically speaking, the CBOE Volatility Index (VIX) tends to reach its seasonal low in late-July or early August and slowly begin climbing towards its seasonal high, usually in the month of October. This may be due to the fact that the two worst performing months of the year, August and September (by average performance) precede it. VIX’s seasonal pattern can be seen in the following chart.
October’s volatility peak is also visible when closing daily percent changes are analyzed. October has hosted the most daily moves in excess of 1%, 2%, 3%, 5%, 7% and even 10% since 1930. Do not fret over the ten times S&P 500 has moved more than 10% in a single day. Six of the ten occurrences were way back in the 1930’s. Only four have occurred more recently and out of those, two were actually positive days (10/13/2008 +11.58% and 10/28/2008 +10.79%). Only three of the ten days with moves in excess of 10% were negative days: 3/18/1935 –10.06%, 10/19/1987 –20.47% and 3/16/2020 –11.98%.
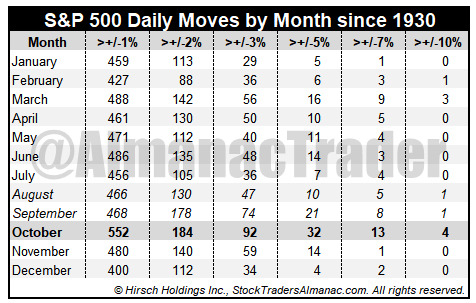
Putting all but the +/-1% moves table data into a bar chart adds a quick confirmation of October’s heightened volatility versus all other months. Volatility’s trend can also be observed as the frequency of sizable daily moves tends to decline from March through July then an increase in August lasting until October.

3 notes
·
View notes
Text
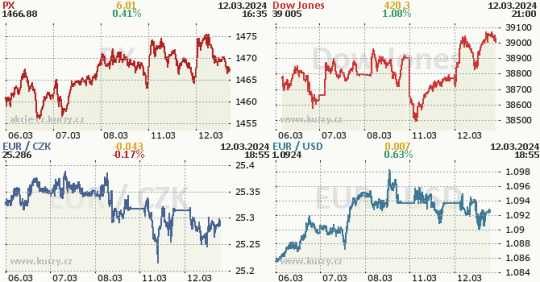
12. března: Tohle potřebujete vědět (nejen) o úterním obchodování na Wall Street
Index Dow, který zahrnuje akcie třiceti předních amerických podniků, si připsal 0,61 % a zakončil obchodování na 39 005,49 bodu. Širší index S&P 500 stoupl o 1,12 % na rekordních 5 175,27 bodu a index Nasdaq Composite, v němž je zastoupeno mnoho firem z odvětví vyspělých technologií, se zvýšil o 1,54 % na 16 265,64 bodu. Index volatility VIX spadl o 9,07 % na 13,84 bodu a výnos 10letých vládních…
View On WordPress
0 notes
Text

CBOE Volatility Index (VIX): What Does It Measure in Investing?
What Is the CBOE Volatility Index (VIX)?
The CBOE Volatility Index (VIX) is a real-time index that represents the market’s expectations for the relative strength of near-term price changes of the S&P 500 Index (SPX). Because it is derived from the prices of SPX index options with near-term expiration dates, it generates a 30-day forward projection of volatility. Volatility, or how fast prices change, is often seen as a way to gauge market sentiment, and in particular the degree of fear among market participants.
The index is more commonly known by its ticker symbol and is often referred to simply as “the VIX.” It was created by the CBOE Options Exchange and is maintained by CBOE Global Markets. It is an important index in the world of trading and investment because it provides a quantifiable measure of market risk and investors’ sentiments.
KEY TAKEAWAYS
The CBOE Volatility Index, or VIX, is a real-time market index representing the market’s expectations for volatility over the coming 30 days.
Investors use the VIX to measure the level of risk, fear, or stress in the market when making investment decisions.
Traders can also trade the VIX using a variety of options and exchange-traded products, or they can use VIX values to price derivatives.
The VIX generally rises when stocks fall, and declines when stocks rise.
How Does the CBOE Volatility Index (VIX) Work?
The VIX attempts to measure the magnitude of price movements of the S&P 500 (i.e., its volatility). The more dramatic the price swings are in the index, the higher the level of volatility, and vice versa. In addition to being an index to measure volatility, traders can also trade VIX futures, options, and ETFs to hedge or speculate on volatility changes in the index.
In general, volatility can be measured using two different methods. The first method is based on historical volatility, using statistical calculations on previous prices over a specific time period. This process involves computing various statistical numbers, like mean (average), variance, and finally, the standard deviation on the historical price data sets.
The second method, which the VIX uses, involves inferring its value as implied by options prices.
Options are derivative instruments whose price depends upon the probability of a particular stock’s current price moving enough to reach a particular level (called the strike price or exercise price).
Since the possibility of such price moves happening within the given time frame is represented by the volatility factor, various option pricing methods (like the Black-Scholes model) include volatility as an integral input parameter. Since option prices are available in the open market, they can be used to derive the volatility of the underlying security. Such volatility, as implied by or inferred from market prices, is called forward-looking implied volatility (IV).
Extending Volatility to Market Level
The VIX was the first benchmark index introduced by CCOE to measure the market’s expectation of future volatility. Being a forward-looking index, it is constructed using the implied volatilities on S&P 500 index options and represents the market’s expectation of 30-day future volatility of the S&P 500 Index, which is considered the leading indicator of the broad U.S. stock market.
Introduced in 1993, the VIX is now an established and globally recognized gauge of U.S. equity market volatility. It is calculated in real-time based on the live prices of the S&P 500 Index. Calculations are performed and values are relayed from 3 a.m. to 9:15 a.m., and from 9:30 a.m. to 4:15 p.m. EST. CBOE began the dissemination of the VIX outside of U.S. trading hours in April 2016.
Calculation of VIX Values
VIX values are calculated using the CBOE-traded standard SPX options, which expire on the third Friday of each month, and the weekly SPX options, which expire on all other Fridays. Only SPX options are considered whose expiry period lies within more than 23 days and less than 37 days.
While the formula is mathematically complex, it theoretically works as follows: It estimates the expected volatility of the S&P 500 Index by aggregating the weighted prices of multiple SPX puts and calls over a wide range of strike prices.
All such qualifying options should have valid nonzero bid and ask prices that represent the market perception of which options’ strike prices will be hit by the underlying stocks during the remaining time to expiry.
For detailed calculations with an example, one can refer to the section “The VIX Index Calculation: Step-by-Step” of the VIX white paper.
Evolution of the VIX
During its origin in 1993, VIX was calculated as a weighted measure of the implied volatility of eight S&P 100 at-the-money put and call options, when the derivatives market had limited activity and was in its growing stages.
As the derivatives markets matured, 10 years later, in 2003, the CBOE teamed up with Goldman Sachs and updated the methodology to calculate VIX differently. It then started using a wider set of options based on the broader S&P 500 Index, an expansion that allows for a more accurate view of investors’ expectations of future market volatility. A methodology was adopted that remains in effect and is also used for calculating various other variants of the volatility index.
VIX vs. S&P 500 Price
Volatility value, investors’ fear, and VIX values all move up when the market is falling. The reverse is true when the market advances—the index values, fear, and volatility decline.
The price action of the S&P 500 and the VIX often shows inverse price action: when the S&P falls sharply, the VIX rises—and vice versa.
Tip: As a rule of thumb, VIX values greater than 30 are generally linked to large volatility resulting from increased uncertainty, risk, and investors’ fear. VIX values below 20 generally correspond to stable, stress-free periods in the markets.
How to Trade the VIX
The VIX has paved the way for using volatility as a tradable asset, albeit through derivative products. CBOE launched the first VIX-based exchange-traded futures contract in March 2004, followed by the launch of VIX options in February 2006.
Such VIX-linked instruments allow pure volatility exposure and have created a new asset class. Active traders, large institutional investors, and hedge fund managers use the VIX-linked securities for portfolio diversification, as historical data demonstrate a strong negative correlation of volatility to the stock market returns—that is, when stock returns go down, volatility rises, and vice versa.
Like all indexes, one cannot buy the VIX directly. Instead, investors can take a position in VIX through futures or options contracts, or through VIX-based exchange traded products (ETPs). For example, the ProShares VIX Short-Term Futures ETF (VIXY) and the iPath Series B S&P 500 VIX Short-Term Futures ETN (VXXB) are two such offerings that track a certain VIX-variant index and take positions in linked futures contracts.
Active traders who employ their own trading strategies and advanced algorithms use VIX values to price the derivatives, which are based on high beta stocks. Beta represents how much a particular stock price can move with respect to the move in a broader market index. For instance, a stock having a beta of +1.5 indicates that it is theoretically 50% more volatile than the market. Traders making bets through options of such high beta stocks utilize the VIX volatility values in appropriate proportion to correctly price their options trades.
Following the popularity of the VIX, the CBOE now offers several other variants for measuring broad market volatility. Examples include the CBOE Short-Term Volatility Index (VIX9D), which reflects the nine-day expected volatility of the S&P 500 Index; the CBOE S&P 500 3-Month Volatility Index (VIX3M); and the CBOE S&P 500 6-Month Volatility Index (VIX6M). Products based on other market indexes include the Nasdaq-100 Volatility Index (VXN); the CBOE DJIA Volatility Index (VXD); and the CBOE Russell 2000 Volatility Index (RVX).
What Does the VIX Tell Us?
The CBOE Volatility Index (VIX) signals the level of fear or stress in the stock market—using the S&P 500 index as a proxy for the broad market—and hence is widely known as the “Fear Index.” The higher the VIX, the greater the level of fear and uncertainty in the market, with levels above 30 indicating tremendous uncertainty.
How Can an Investor Trade the VIX?
Like all indices, the VIX cannot be bought directly. However, the VIX can be traded through futures contracts and exchange traded funds (ETFs) and exchange traded notes (ETNs) that own these futures contracts.
Does the Level of the VIX Affect Option Premiums and Prices?
Yes, it does. Volatility is one of the primary factors that affect stock and index options’ prices and premiums. As the VIX is the most widely watched measure of broad market volatility, it has a substantial impact on option prices or premiums. A higher VIX means higher prices for options (i.e., more expensive option premiums) while a lower VIX means lower option prices or cheaper premiums.
How Can I Use the VIX Level to Hedge Downside Risk?
Downside risk can be adequately hedged by buying put options, the price of which depend on market volatility. Astute investors tend to buy options when the VIX is relatively low and put premiums are cheap. Such protective puts will generally get expensive when the market is sliding; therefore, like insurance, it’s best to buy them when the need for such protection is not obvious (i.e., when investors perceive the risk of market downside to be low).
What Is a Normal Value for the VIX?
The long-run average of the VIX has been around 21. High levels of the VIX (normally when it is above 30) can point to increased volatility and fear in the market, often associated with a bear market.
0 notes
Last Seen Blogs

thrifttokyo
Thrift Tokyo

all-airport-transfer
Untitled

kyahaku
Kyanite

lauradesire
Un désir.

vacaseca
vacaseca = Gustavo Jabbaz