#Natalya St. Clair
Photo
© Paolo Dala
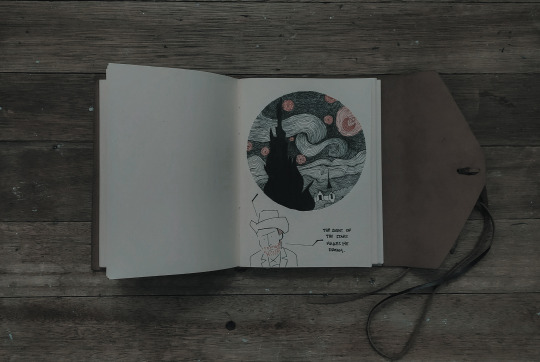
Illustration by Paolo Dala (2019)
Turbulence X Vincent Van Gogh
One of the most remarkable aspects of the human brain is its ability to recognize patters and describe them. Among the hardest patterns we’ve tried to understand is the concept of turbulent flow in fluid dynamics. The German Physicist Werner Heisenberg said:
“When I meet God I’m going to ask him two questions: Why relativity and why turbulence? I really believe he will have an answer for the first.”
As difficult as turbulence is to understand mathematically, we can use art to depict the way it looks.
In June 1889, Vincent van Gogh painted the view just before sunrise from the window of his room at the St. Paul de Mausole Asylum in Saint Rémy de Provence (where he admitted himself after mutilating his own ear in a psychotic episode). In the ‘Starry Night’, his circular brushstrokes crate a night sky filled whit swirling clouds and eddies of stars.
Van Gogh and other impressionists represented light in a different way than their predecessors, seeming to capture its motion... The effect is caused by luminance, the intensity of the light in the colors of the canvas. The more primitive part of our visual cortex, which sees light contrast, and motion, but not color, will ben two differently colored areas together if they have the same luminance; but out brains’ primate subdivision will the contrasting colors without blending. With these two interpretations happening at once, the light in many Impressionist works seems to pulse, flicker and radiate oddly...
Sixty (60) years later, Russian Mathematician Andrey Kolmogrov furthered our mathematical understanding of turbulence when he proposed that energy in a turbulent fluid at length R varies in proportion to the five-thirds (5/3) power of R. Experimental measurements show Kolmogorov was remarkably close to the way turbulent flow works, although a complete description of turbulence remains one of the unsolved problems in physics. A turbulent flow is self-similar if there is an energy cascade. In other words, big eddies transfer their energy to smaller eddies, which do likewise at other scales. Examples of this includes Jupiter’s ‘Great Red Spot’, cloud formations, and interstellar dust particles.
In 2004 using the Hubble Space Telescope, scientists saw the eddies of dust and gas around a star, and it reminded them of van Gogh’s ‘Starry Night’. This motivated scientists from Mexico, Spain, and England to study the luminance in van Gogh’s paintings in detail. They discovered that there is a distinct patter of turbulent fluid structures close to Kolmogorov’s Equation hidden in may of van Gogh’s paintings. The researchers digitized the paintings, and measured how brightness varies between any two pixels. From the curves measured for pixel separations, they concluded that paintings from van Gogh’s period of psychotic agitation behave remarkably similar to fluid turbulence. His ‘Self-portrait with a Pipe’, from a calmer period in van Gogh’s life, showed no sign of this correspondence. And neither did other artists’ work that seemed equally turbulent at first glance, like Munch’s ‘The Scream’.
While it’s too easy to say van Gogh’s turbulent genius enabled him to depict turbulence, it’s also far too difficult to accurately express the rousing beauty of the fact that in a period of intense suffering, van Gogh was somehow able to perceive and represent one of the most supremely difficult concepts nature has ever brought before mankind, and to unite his unique mind’s eye with the deepest mysteries of movement, fluid and, light.
Natalya St. Clair
The Unexpected Math behind van Gogh's ‘Starry Night’
#The Unexpected Math behind van Gogh's ‘Starry Night’#Natalya St. Clair#Ted-Ed#Starry Night#Vincent van Gogh#van Gogh#Art#Math#Science#Turbulence#Illustration#Stars#Journal#Pen#Ink
9 notes
·
View notes
Photo

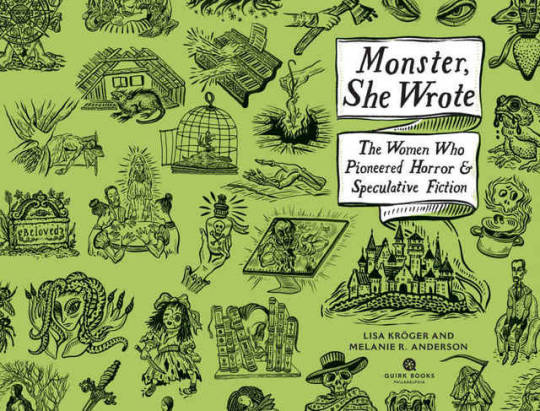


Monster, She Wrote: The Women Who Pioneered Horror and Speculative Fiction, by Lisa Kröger and Melanie R. Anderson, Quirk Books, 2019. Cover art and internal illustrations by Natalya Balnova, info: penguinrandomhouse.com.
Meet the women writers who defied convention to craft some of literature’s strangest tales, from Frankenstein to The Haunting of Hill House and beyond. Frankenstein was just the beginning: horror stories and other weird fiction wouldn’t exist without the women who created it. From Gothic ghost stories to psychological horror to science fiction, women have been primary architects of speculative literature of all sorts. And their own life stories are as intriguing as their fiction. Everyone knows about Mary Shelley, creator of Frankenstein, who was rumored to keep her late husband’s heart in her desk drawer. But have you heard of Margaret “Mad Madge” Cavendish, who wrote a science-fiction epic 150 years earlier (and liked to wear topless gowns to the theater)? If you know the astounding work of Shirley Jackson, whose novel The Haunting of Hill House was reinvented as a Netflix series, then try the psychological hauntings of Violet Paget, who was openly involved in long-term romantic relationships with women in the Victorian era. You’ll meet celebrated icons (Ann Radcliffe, V.C. Andrews), forgotten wordsmiths (Eli Colter, Ruby Jean Jensen), and today’s vanguard (Helen Oyeyemi). Curated reading lists point you to their most spine-chilling tales. Part biography, part reader’s guide, the engaging write-ups and detailed reading lists will introduce you to more than a hundred authors and over two hundred of their mysterious and spooky novels, novellas, and stories.
Contents:
Introduction
PART ONE: THE FOUNDING MOTHERS
Margaret Cavendish: Mad Madge
Ann Radcliffe: Terror over Horror
Mary Wollstonecraft Shelley: The Original Goth Girl
Regina Maria Roche: Scandalizing Jane Austen
Mary Anne Radcliffe: Purveyor of Guts and Gore
Charlotte Dacre: Exhibitor of Murder and Harlotry
PART TWO: HAUNTING TALES
Elizabeth Gaskell: Ghosts Are Real
Charlotte Riddell: Born Storyteller
Amelia Edwards: The Most Learned Woman
Paula E. Hopkins: The Most Productive Writer
Vernon Lee: Ghostwriter à la Garçonne
Margaret Oliphant: Voice for the Dead
Edith Wharton: The Spine-Tingler
PART THREE: CULT OF THE OCCULT
Marjorie Bowen: Scribe of the Supernatural
L. T. Meade: Maker of Female Masterminds
Alice Askew: Casualty of War
Margery Lawrence: Speaker to the Spirits
Dion Fortune: Britian’s Psychic Defender
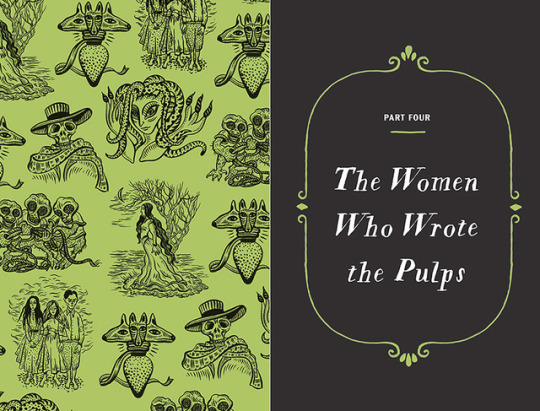
PART FOUR: THE WOMEN WHO WROTE THE PULPS
Margaret St. Clair: Exploring Our Depths
Catherine Lucille Moore: Space Vamp Queen
Mary Elizabeth Counselman: Deep South Storyteller
Gertrude Barrows Bennett: Seer of the Unseen
Everil Worrell: Night Writer
Eli Colter: Keeping the Wild West Weird
PART FIVE: HAUNTING THE HOME
Dorothy Macardle: Chronicler of Pain and Loss
Shirley Jackson: The Queen of Horror
Daphne du Maurier: The Dame of Dread
Toni Morrison: Haunted by History
Elizabeth Engstrom: Monstrosity in the Mundane
PART SIX: PAPERBACK HORROR
Joanne Fischmann: Recipes for Fear
Ruby Jean Jensen: Where Evil Meets Innocence
V.C. Andrews: Nightmares in the Attic
Kathe Koja: Kafka of the Weird
Lisa Tuttle: Adversary for the Devil
Tanith Lee: Rewriting Snow White
PART SEVEN: THE NEW GOTHS
Anne Rice: Queen of the Damned
Helen Oyeyemi: Teller of Feminist Fairy Tales
Susan Hill: Modern Gothic Ghost Maker
Sarah Waters: Welcome to the Dark SОance
Angela Carter: Teller of Bloody Fables
Jewelle Gomez: Afrofuturist Horrorist
PART EIGHT: THE FUTURE OF HORROR AND SPECULATIVE FICTION
The New Weird: Lovecraft Revisited and Revised
The New Vampire: Polishing the Fangs
The New Haunted House: Home, Deadly Home
The New Apocalypse: This Is the End (Again)
The New Serial Killer: Sharper Weapons, Sharper Victims
Glossary
Notes
Suggested Reading
Index
Acknowledgments
55 notes
·
View notes
Text
0 notes
Text
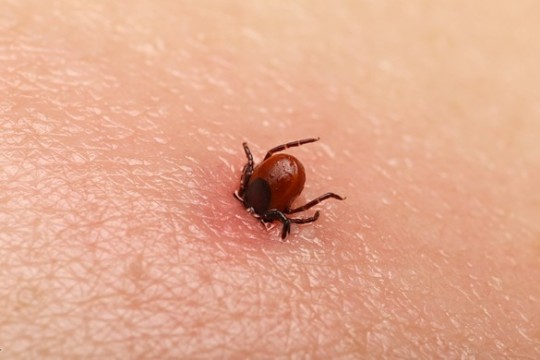
Maladie de Lyme, vers la fin de l’errance thérapeutique ?

Aksenova Natalya/shutterstock.com
La lutte contre la maladie de Lyme est au cœur du plan national dédié. Dernières actions dans ce cadre, la désignation de centres de référence. Lesquels devraient participer à l’élaboration de recommandations nationales de prise en charge des patients pour tout le territoire. Objectif, en finir avec l’errance diagnostique et thérapeutique des patients.
Où en est la lutte contre la maladie de Lyme, transmise par les tiques ? Le cinquième comité de pilotage du plan national de prévention et de lutte contre la maladie révèle une augmentation significative du nombre de nouveaux cas diagnostiqués en un an, avec 104 cas pour 100 000 habitants en 2018 contre 69 pour 100 000 en 2017. « Des conditions climatiques favorables au développement des tiques et la sensibilisation des professionnels de santé au diagnostic de cette maladie pourraient expliquer cette augmentation », souligne le ministère en charge de la Santé.
Autre nouvelle encourageante, 5 centres de référence pour la prise en charge des maladies vectorielles à tiques (CRMVT)* devront travailler pour mettre en œuvre la nouvelle organisation des soins. Les coordonnateurs de ces centres seront également invités à participer aux travaux d’actualisation des recommandations de la Haute autorité de Santé (HAS) « sous format unique et clair, connues de tous et appliquées », précise la DGS. Ce qui devrait permettre de « mettre fin à l’errance et à la souffrance des personnes malades »
A noter : tout citoyen peut signaler une piqûre de tique sur l’application nationale « Signalement Tique ». A ce jour, 15 000 signalements ont été effectués et environ 3 500 spécimens de tiques analysés.
*le CHU de Clermont-Ferrand associé au CHU de St Etienne, le CHU de Marseille, le CHU de Rennes, le CHU de Strasbourg associé au CHU de Nancy, le Groupe hospitalier intercommunal de Villeneuve-Saint-Georges associé au CHU de Créteil
0 notes
Video
youtube
The unexpected math behind Van Gogh's "Starry Night" - Natalya St. Clair
0 notes
Text
IntMath Newsletter: CSS matrix, Humble Pi, van Gogh
29 Aug 2019
In this Newsletter:
1. New on IntMath: CSS matrix math
2. Resources: Humble Pi, AnswerThePublic
3. Math in the news: Proof
4. Math movies: Parker, van Gogh
5. Math puzzle: Mystery object
6. Final thought: Dry leaves
1. New on IntMath: CSS matrix math
I recently gave a talk to a local meetup group on the mathematics behind CSS matrix. CSS stands for "cascading style sheets", and is the system where Web designers can set font sizes, colors, and also set sizes and vary shapes for objects like images and videos.
Matrices are used to transform geometric objects (scale, skew, rotate, translate and so on.) Computer games make extensive use of matrices to simulate depth, 3D objects and so on.
Here is the content of the talk. It explores how CSS transform is the result of matrix multiplication. Even if you're not interested in Web design, it's interesting to see another real-life application of matrices.
See CSS Matrix - a mathematical explanation
I also developed the following interactive graph applet that demonstrates the concepts in the talk.
This is an interactive graph where you can vary sliders to see how CSS matrix changes the size, shape and location of an object.
See CSS matrix interactive applet
2. Resources
(a) Humble Pi: A Comedy of Maths Errors
When I was teaching a group of engineering students some years ago, I went to my boss with an idea. I suggested we incorporate examples of cases where things went wrong, so students would learn the importance of accuracy and the safety issues that can arise out of sloppy and inaccurate mathematics.
He wasn't enthusiastic and squashed the idea, saying it would scare off students from choosing the degree. I felt it was a lost opportunity.
So I was interested when I came across the book "Humble Pi - A Comedy of Maths Errors" by Matt Parker.
Matt Parker's Humble Pi
This readable book was exactly what I had in mind when I approached my boss. Let's learn from cases where people made math errors, and see what the consequences were – not to apportion blame, but to learn what can go wrong.
We all make math errors, but usually the worst outcome is a drop in grade, or momentary embarrassment. The people working in science and engineering fields should be aware of why their math teachers insisted on accuracy.
So I suggested the book for the local library, and was pleasantly surprised how long I had to wait before I could read it (it turned out to be quite popular).
I recommend this book for any math student or teacher.
One of the videos below features Parker, covering some of the same errors detailed in the book.
Disclaimer: I have no connection with Matt Parker (other than through Twitter) and receive no commission.
(b) Teachers: Address the questions students are really asking
Some teachers see their job as simply giving out information, but there is no "value add" in that approach, especially since students can easily access such information in abundance.
One thing we can do better while teaching a topic is to actually address the questions students really have about that topic. One approach is to simply ask students what their questions are, and there are a lot of apps and sites that facilitate this process (e.g. Google Forms and Survey Monkey are both easy to use).
Another thing to consider is to look at the questions students are likely to ask, before you even start planning the lessons. AnswerThePublic is a good resource for this.
AnswerThePublic is a database of common questions that people ask about topics. It provides a rich source of ideas on how we might go about introducing a topic, and pre-empting the stumbling blocks.
See Answer the Public
Topics to try are:
Algebra (you'll see e.g. "How is algebra used in real life?", "Who invented algebra?", etc)
Calculus (e.g. "When does a limit exist?", "Where to start?", "How is it used in computer science?", etc)
Matrix (e.g. "When is a matrix orthogonal?", "Matrix when a^2 = a?", etc)
You can choose the "Data" tab at the top of each visualization to get easier-to-read lists of questions, and download the lot as a CSV (for Excel).
Sometimes in this resource you see questions that may seem quite odd, like "Does calculus cause kidney stones?", but "calculus" means "stone" and in medicine, it refers to a build-up of hard substances in the body. I get it on my teeth.
3. Math in the news
Story of the Gaussian correlation inequality proof
The title "Gaussian correlation inequality" sounds scary, but it goes something like this.
I have a dart board sitting on a rectangular shape, and assume I'm a good dart player. When I throw a lot of darts at it, I expect the accuracy of my throws to form a somewhat bell-shaped curve distribution. That is, most of the darts land somewhere close to the middle, and there are less dart holes as I go out from the middle.
The greater the circle overlaps the rectangle, the probability of striking both goes up.
The probability that a dart lands on both the circle and the rectangle is greater than or equal to the product of the individual probabilities.
At first, they didn't believe a German retiree had actually proved it.
See A Long-Sought Proof, Found and Almost Lost
4. Math Movies
(a) What Happens When Maths Goes Wrong?
This is a one-hour presentation by Matt Parker at the Royal Institution, London. It covers some interesting examples that are worth considering.
See What Happens When Maths Goes Wrong?
Parker is the Public Engagement in Mathematics Fellow at Queen Mary University of London.
(b) The unexpected math behind Van Gogh's "Starry Night"
Turbulence is one of the most tricky phenomena to model using mathematics. It is complicated and chaotic.
This video by Natalya St. Clair explores how Van Gogh incorporated turbulence in his art to give the impression of movement.
See: The unexpected math behind Van Gogh's "Starry Night"
5. Math puzzles
The puzzle in the last IntMath Newsletter asked about radii of mutually tangent circles. In fact, it turned out to be a 3x3 system of equations - it wasn't really a geometry question.
Correct answers with sufficient reasons were submitted by Russell, Nicola, Tomas and Thomas.
New math puzzle: Mystery object
This time, some investigation may be involved.
Mystery object
The above object was used to achieve a particular mathematical outcome – one that is still vitally important to this day. What is the object, where was it used, and what was the mathematical outcome?
(If you can't actually find it or figure it out, your speculation will prove interesting!)
You can leave your response here.
6. Final thought - what it could be like
Equatorial Singapore, where I live, is normally lush and green, and doesn't experience leaf falls as is normally the case for most places in Autumn.
However, this year we've had the driest and second hottest July on record, and practically no rain so far in August causing my local park to look like this:
Dry leaves and dead grass in Singapore.
Such dry and hot conditions are caused by a positive Indian Ocean dipole, the situation where the Western Indian Ocean is hotter than the Eastern part, causing hot droughts over Australia and most SE Asian countries.
These make ideal conditions for farmers in Indonesia to set off forest fires in order to plant more palm oil, so there's been many fire hot spots reported there.
Meanwhile, the dry season in the Amazon has been the excuse, along with President Bolsanaro's encouragement, for farmers there to burn vast amounts of the Earth's lungs for ever-expanding methane-producing cattle farms.
In the Arctic, fires across the tundra continue to burn, spewing even more carbon into the atmosphere.
These events are giving us an insight into how things will be if governments, companies and all of us fail to address our land use, our consumption, and our "economic growth at all costs" mentality.
We can stop it, but will we?
Until next time, enjoy whatever you learn.
Related posts:
Updated matrix interactive Here's an applet where you can investigate how matrix...
IntMath Newsletter: Resources, primes, matrix app and role models In this Newsletter: 1. Resources for the new school year...
Is a 1×1 matrix a scalar? A 1×1 matrix is often regarded as a scalar...
IntMath Newsletter: Piano trig applet, continued fractions In this Newsletter: 1. New applet: Piano note frequencies interactive...
from SquareCirclez https://ift.tt/2L6diKb
via IFTTT
from Blogger https://ift.tt/2Uf55q0
0 notes
Video
Music and math: The genius of Beethoven - Natalya St. Clair
0 notes
Link
0 notes
Text
The Unexpected Math Behind Van Gogh’s Starry Night
TED-Ed (https://ed.ted.com/lessons/the-unexpected-math-behind-van-gogh-s-starry-night-natalya-st-clair)
One of the hardest patterns we’ve tried to understand is the concept of turbulent flow in fluid dynamics. Art can be used to depict how turbulent flow looks.
In June 1889, Vincent van Gogh painted the view just before sunrise of his room at the Saint-Paul Asylum in Saint-Rémy-de-Provence where he’d admitted himself after mutilating his own ear.
In Starry Night, his circular brushstrokes create a night sky filled with swirling clouds and eddies of stars. Van Gogh and other Impressionists represented light in a different way than their predecessors - seeing to capture its motion, for instance, across sun-dappled waters.
The effect is caused by luminance - the intensity of light in the colours on the canvas. The more primitive part of our visual cortex, which sees light contrast and motion (but not colour), will blend two differently coloured areas together if they have the same luminance. But our brain’s primate subdivision sees the contrasting colours without blending. With these two interpretations happening at once, the light in many Impressionist works seems to pulse, flicker and radiate oddly. That’s how this and other Impressionist works use quickly executed and prominent brushstrokes to capture something strikingly real about how light moves.
60 years later, Russian mathematician Andrey Kolmogorov furthered our mathematical understanding of turbulence when he proposed that energy in a turbulent fluid at length r, varies in proportion to the 5/3 power of r. Experiments in turbulence show Kolmogorov was remarkably close to the way turbulent flow works - although a complete description of turbulence remains one of the unsolved problems in physics.
A turbulent flow is self-similar if there is an energy cascade. In other words, big eddies transfer their energy to smaller eddies, which do likewise at other scales. Examples of this include Jupiter’s Great Red Spot, cloud formations and interstellar dust particles. In 2004, using the Hubble Space Telescope, scientists saw the eddies of a distant cloud of dust and gas around a star and it reminded them of Van Gogh’s Starry Night. This motivated scientists from Mexico, Spain and England to study the luminance in Van Gogh’s paintings in detail. They discovered there is a distinct pattern of turbulent fluid structures, close to Kolmogorov’s equation, hidden in many of Van Gogh’s paintings.
The researchers digitized the paintings and measured how brightness varies between any two pixels. From the curves measured for pixel separations, they concluded that paintings from Van Gogh’s period of psychotic agitation, behave remarkably similar to fluid turbulence. His Self Portrait with a Pipe, from a calmer period in Van Gogh’s life, showed no sign of this correspondence and neither did other artists’ work that seemed equally turbulent at first glance like Mvnch’s The Scream.
0 notes
Text
Maladie de Lyme, vers la fin de l’errance thérapeutique ?
Aksenova Natalya/shutterstock.com
La lutte contre la maladie de Lyme est au cœur du plan national dédié. Dernières actions dans ce cadre, la désignation de centres de référence. Lesquels devraient participer à l’élaboration de recommandations nationales de prise en charge des patients. Objectif, en finir avec l’errance diagnostique et thérapeutique des patients.
Où en est la lutte contre la maladie de Lyme, transmise par les tiques ? Le cinquième comité de pilotage du plan national de prévention et de lutte contre la maladie révèle une augmentation significative du nombre de nouveaux cas diagnostiqués en un an, avec 104 cas pour 100 000 habitants en 2018 contre 69 pour 100 000 en 2017. « Des conditions climatiques favorables au développement des tiques et la sensibilisation des professionnels de santé au diagnostic de cette maladie pourraient expliquer cette augmentation », souligne le ministère en charge de la Santé.
Autre nouvelle encourageante, 5 centres de référence pour la prise en charge des maladies vectorielles à tiques (CRMVT)* devront travailler pour mettre en œuvre la nouvelle organisation des soins. Les coordonnateurs de ces centres seront également invités à participer aux travaux d’actualisation des recommandations de la Haute autorité de Santé (HAS) « sous format unique et clair, connues de tous et appliquées », précise la DGS. Ce qui devrait permettre de « mettre fin à l’errance et à la souffrance des personnes malades »
A noter : tout citoyen peut signaler une piqûre de tique sur l’application nationale « Signalement Tique ». A ce jour, 15 000 signalements ont été effectués et environ 3 500 spécimens de tiques analysés.
*le CHU de Clermont-Ferrand associé au CHU de St Etienne, le CHU de Marseille, le CHU de Rennes, le CHU de Strasbourg associé au CHU de Nancy, le Groupe hospitalier intercommunal de Villeneuve-Saint-Georges associé au CHU de Créteil
Retrouvez cet article sur DestinationSante.com
0 notes
Text
Two Words, “This moment”
youtube
I stumbled upon this episode after watching TedEd’s video about “The unexpected math behind Van Gogh's "Starry Night" - Natalya St. Clair” , saw a comment in the video talking about this episode. I searched about him right away on wiki, learning a summary of his life, and then watched this episode out of curiosity, and oh my ;-;
It does feel like it’s not fair for him to live his life like that, but then I read one comment in youtube,
“And now he lives on in his paintings for as long as humanity appreciates art.
So essentially for being pushed aside during his life, he has been granted immortality in death.“ - ProblmSolvd
Not many people have the privilege , and perhaps he knows and watches from the next life.
0 notes
Text
Addressing the Growing Need for Data Science Education | Getting Smart
See on Scoop.it - Obfuscation and The Veterans Administration
By Natalya St. Clair - As massive datasets accumulate, so does the need for people who can understand how to work with complex datasets and software.
0 notes
Photo
Did Shakespeare write his plays? - Natalya St. Clair and Aaron Williams http://bit.ly/2og6uz6
0 notes
Last Seen Blogs

cannedgifts-blog
Без названия

liquidgoldconcept
In-person and virtual clinical lactation education
just-another-aristocat
MadiRoo

heyyyyrw
Adulting...kind of...sort of!

gunkillerodin
Racoons are great friends.