#imaginary planetology
Photo
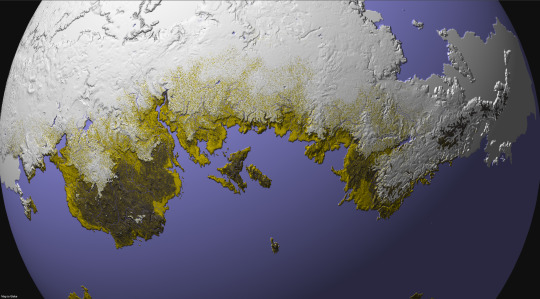
Some months ago, I created a series of maps and diagrams for @iguanodont‘s Birdbug worldbuilding project, representing the planet inhabited by their original species and its planetological data. This isn’t the first time I mapped out this planet, as I was also commissioned by Ripley back in 2020 back when I didn’t have nearly as much experience and knowledge as I do now. Two years later, I’ve been commissioned once again to revisit this world and its peculiarities.
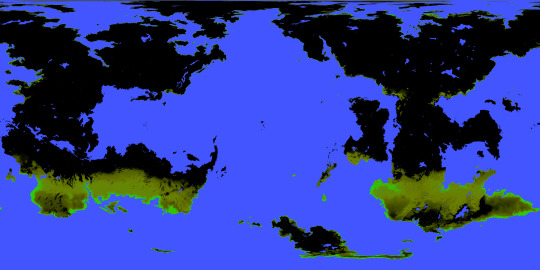
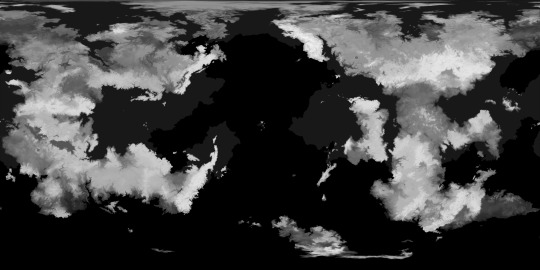
This first map (in Equirectangular projection and poles-centered perspective) depicts the elevation for this planet, with a color gradient applied to the data.
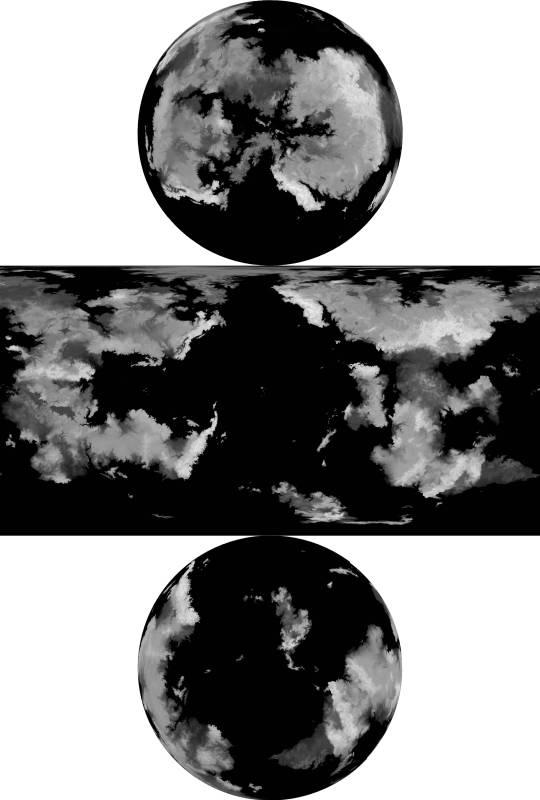
Here is the same elevation data, presented without the color gradient.
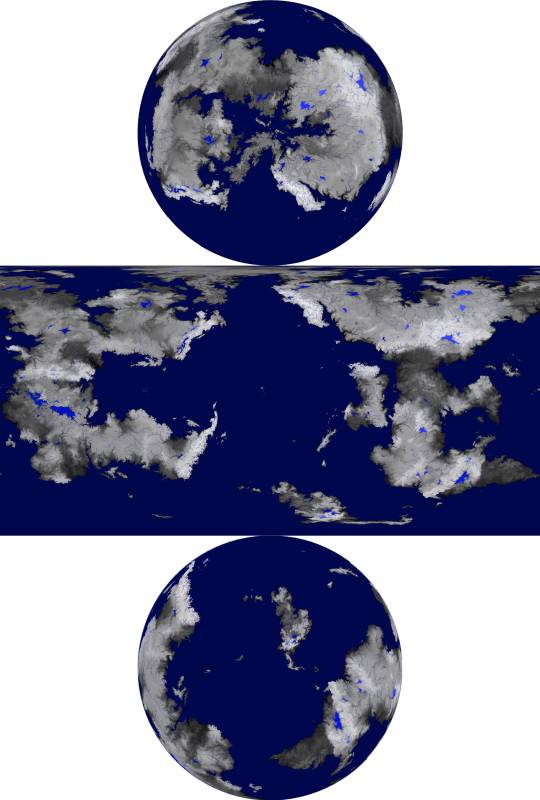
This time, the elevation is presented with bodies of liquid water included, such as rivers, oceans, and lakes.
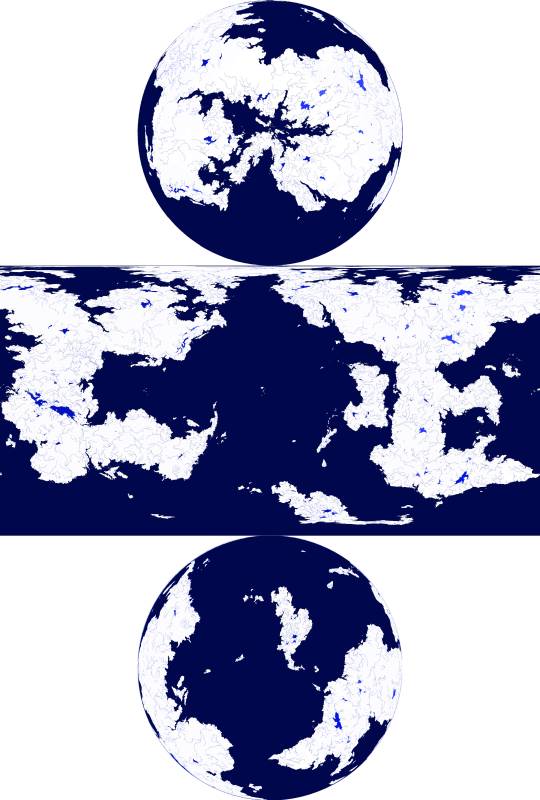
and in this one, the water is isolated from the other data, against a white background
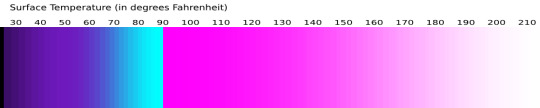
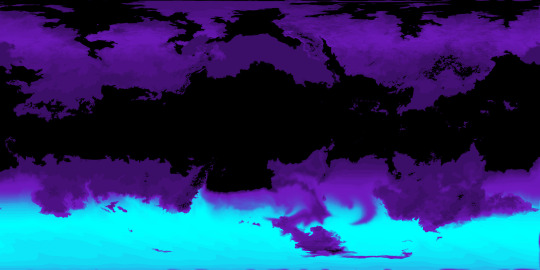
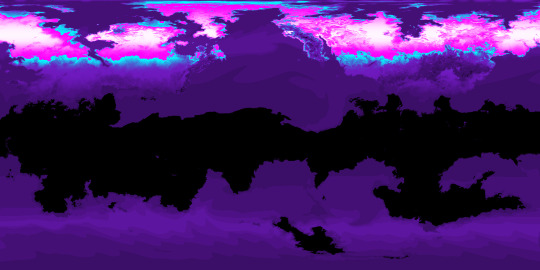
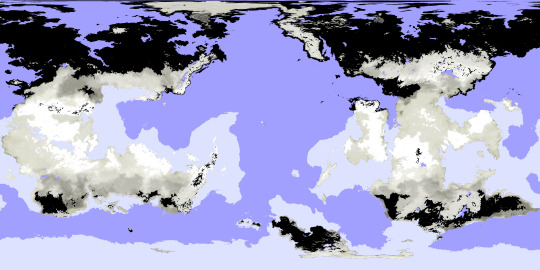
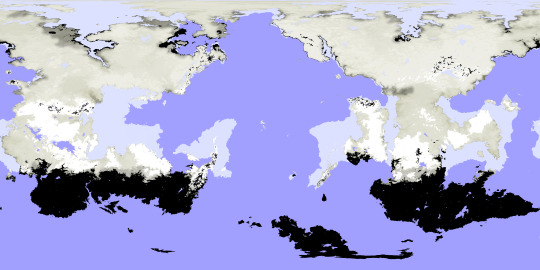
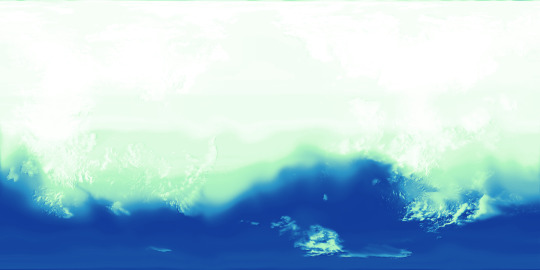
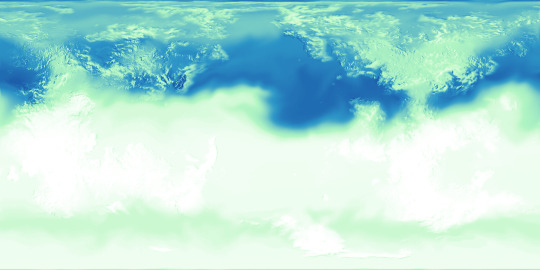
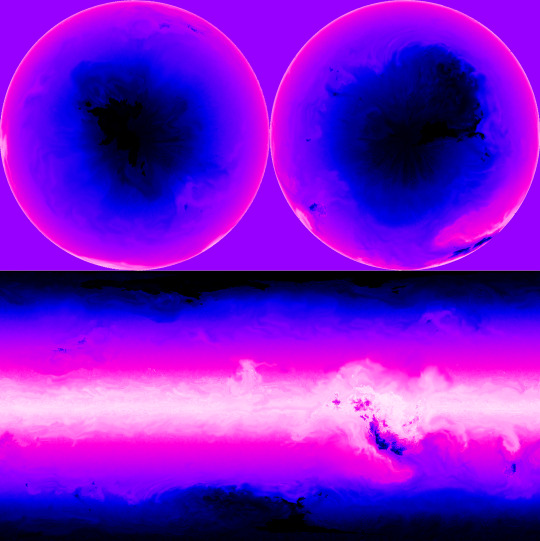
Next, there are the surface temperatures that occur on this planet, the key to which is shown above. The four maps below show the seasonal temperatures for land and sea, in order of Northern Spring Equinox, Northern Summer Solstice, Northern Autumn Equinox, and Northern Winter Solstice.
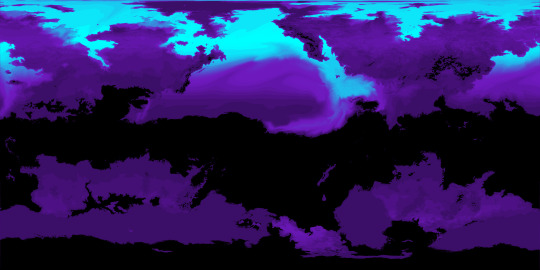
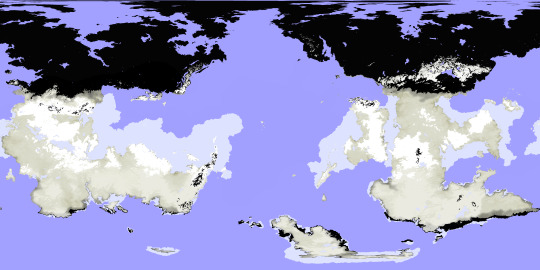
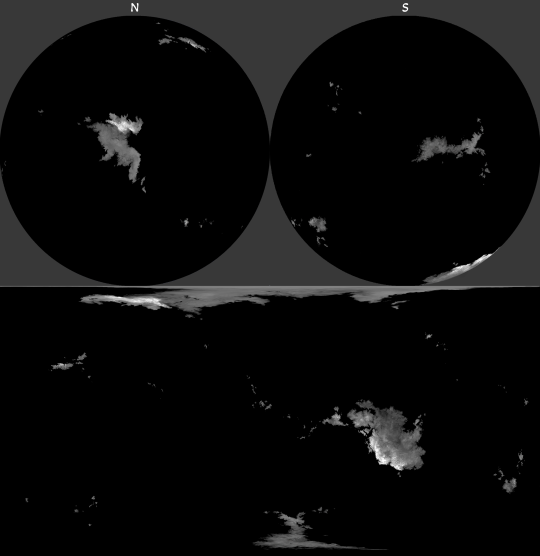
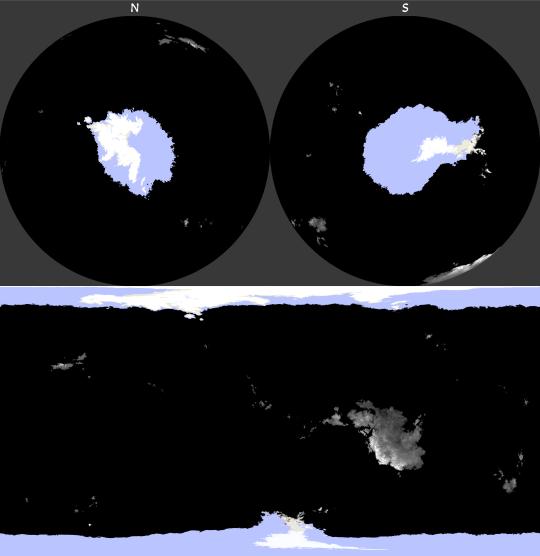
Correlating closely to the above data is the snow and ice cover, which is fairly extensive on this planet owing to its high obliquity and distance from its star. Land ice only occurs where the snow falls and is compacted year-round, but snow and sea ice can be much more seasonal.
Seasonal precipitation levels were another important phase of this project, and the below diagram shows those levels for a given latitude (y-axis) on a given date (x-axis), with a key attached.
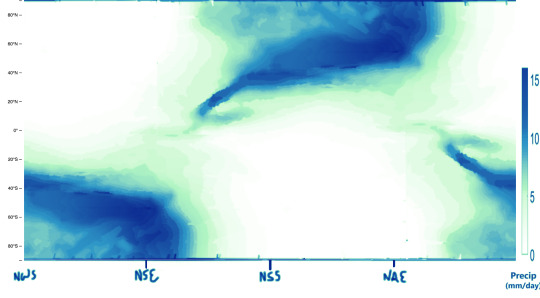
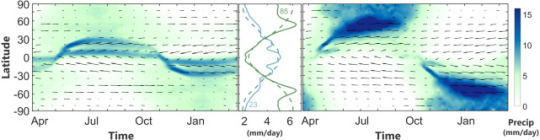
My reference for creating the above graphic is the figure below, which comes from a 2019 paper by A.H. Lobo and S. Bordoni titled “Atmospheric Dynamics of High Obliquity Planets”, and shows Earth’s precipitation levels compared to those of a planet with an 85° obliquity.
The following maps can now be better understood in light of these diagrams and keys.
-Northern Spring Equinox
-Northern Summer Solstice

-Northern Autumn Equinox

-Northern Winter Solstice
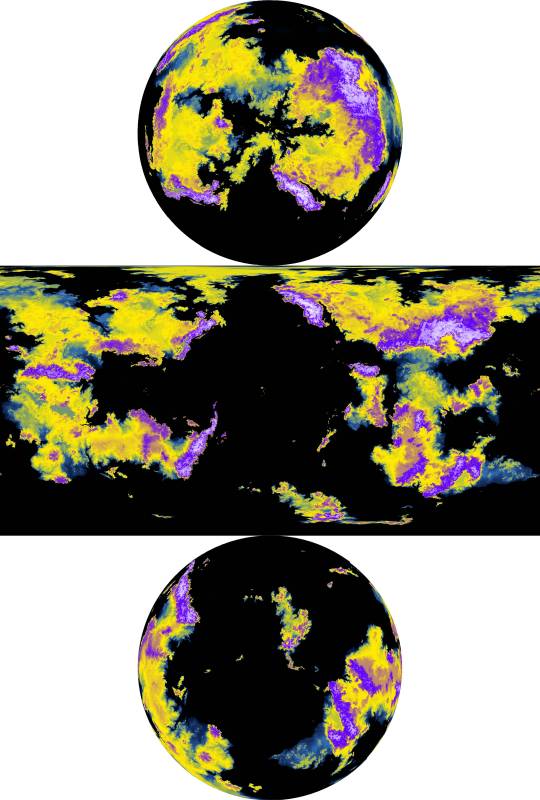
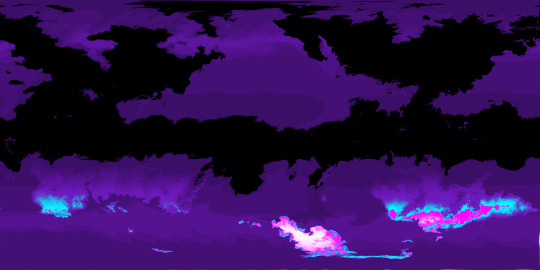
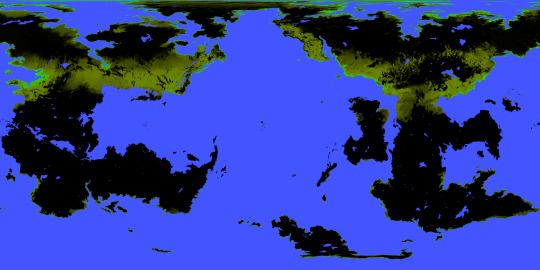
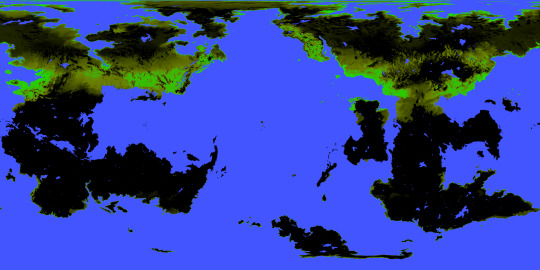
I was also tasked with mapping out the extent and density of this planet’s vegetation (or at least its alien equivalent), and from this you can see how wildly it varies by season, with very few year-round holdings. Precipitation is a major factor in where it is possible for plants to flourish, but snow cover and the extreme temperature swings limit it too. Near either pole, for example, within the space of a year temperatures soar far above Earth’s upper limits and also plummet below freezing; if either extreme were to be the annual norm for a region, some plants might adapt to those conditions, but because of the wild fluctuation any adaptations to one extreme would leave plants especially vulnerable to the other. These regions, then, remain barren regardless of rainfall or brief windows of mild temperatures, while areas with less wide temperature ranges allow for at least brief periods of flourishing.

Determining the surface temperatures for this planet required a lot of background work. The first piece of the puzzle for this was knowing the number of daily hours of sunlight for a given latitude and date, which is exemplified first in this diagram for Earth:
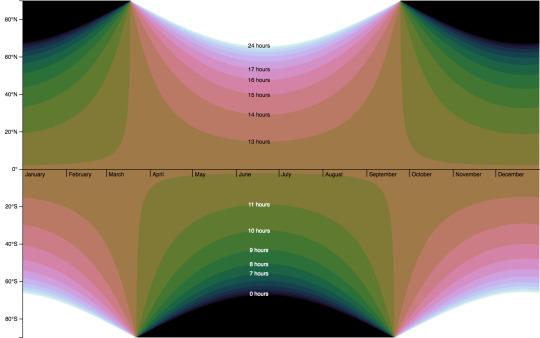
and then for the Birdbug planet, below. Since this planet rotates on an axis of 60 degrees, there are many more latitudes within range of either pole that experience periods of sunlight and darkness lasting longer than a day. The higher the latitude, the longer this period lasts, with the poles themselves experiencing either condition for half a year at a time.
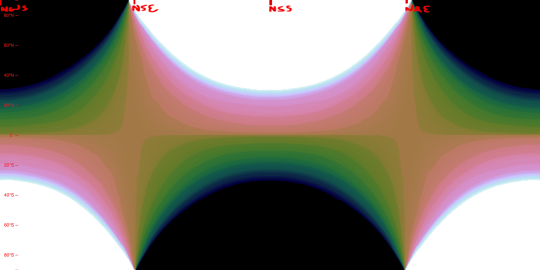
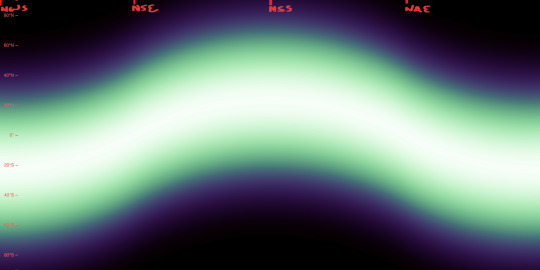
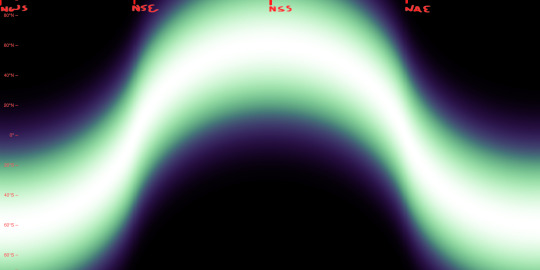
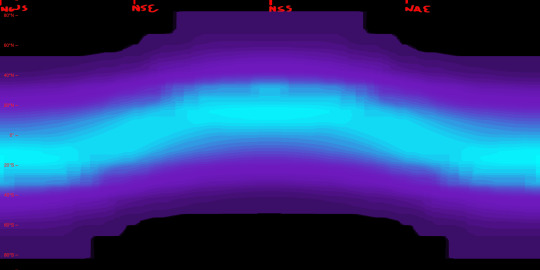
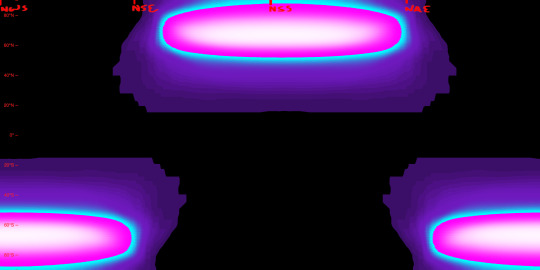
Another important factor is the height to which the sun is seen to rise (more scientifically, the angle at which the sun’s light hits parts of the planet’s surface), seen here first for Earth and then for the Birdbug planet. In these diagrams, white represents the sun reaching the zenith of the sky (meeting the surface at a 90° angle), and black represents the sun failing to appear above the horizon (meeting at an angle of 0° or below), while shades of green and purple stand in for angles between those extremes. For Earth and the Birdbug planet alike, the sun reaches the zenith within the bounds of either planet’s Tropic circles of latitude, and fails to rise at all only within the Polar circles of latitude; the difference in obliquity means that the Birdbug planet’s key circles of latitude are flipped compared to Earth’s.
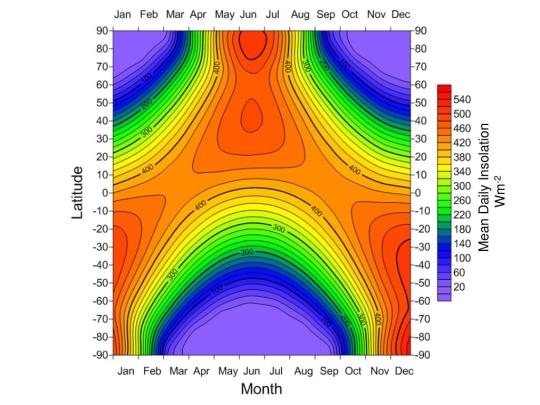
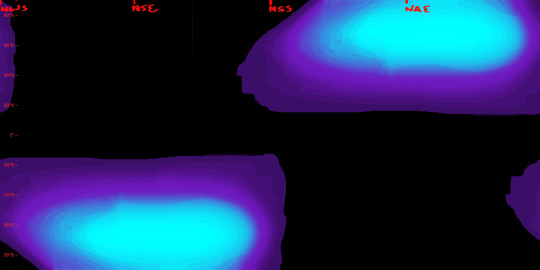
The duration of sunlight and the angle at which that sunlight is reaches the planet’s surface determine a planet’s Insolation, that is, the amount of solar energy it receives. The first image below is a preexisting diagram of Earth’s Insolation, where it is measured in watts per square meter. The next two images are my own attempts at replicating this data for Earth, and then for the Birdbug planet.
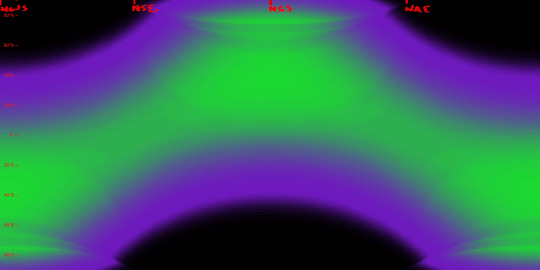
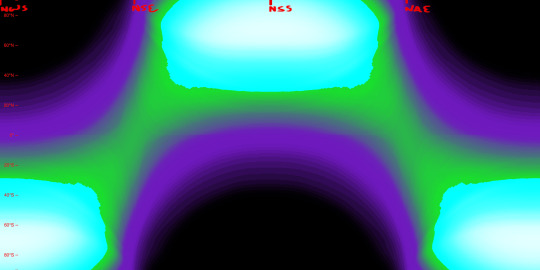
As seen in the diagrams above, Insolation on the Birdbug planet differs from Earth not only in its latitudinal distribution, but also in its sheer intensity at the higher latitudes. Compared to Earth there are twice as many latitudes for which the sun is shining longer than one rotational period, and many of those latitudes see the sun shine at a direct or nearly direct angle, whereas the Polar circles of latitude on Earth see the sun shine much more obliquely.
Below, we can see the data that all the above figures were instrumental in finding: that is, surface temperatures. The first image is a preexisting figure that measures Earth’s mean surface temperatures by date and latitude, and below that is my attempt at replicating the data by my own process.
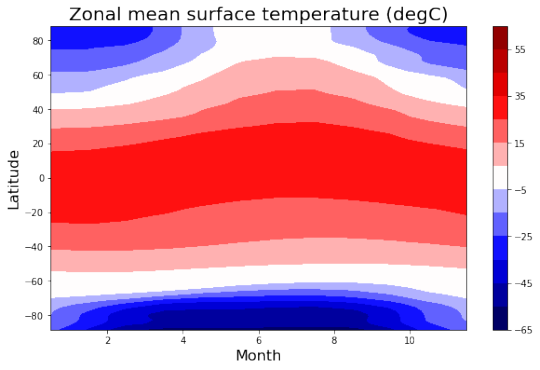
This is done not by just copying the seasonal Insolation data, but by also factoring in the yearly average for each latitude.
Above, we see the temperatures of the land by date and latitude, and below, we see the temperatures at the surface of the sea, which lag behind the land temperatures and remain comparatively mild.
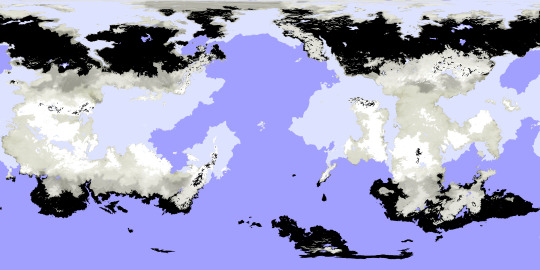
Lastly, here’s an image I created to combine the snow and ice cover as well as the vegetation extent and density, as of the Northern Spring Equinox. This, along with the elevation map also seen here, is what I uploaded to maptoglobe.com in order to produce the screenshot at the top of this post.
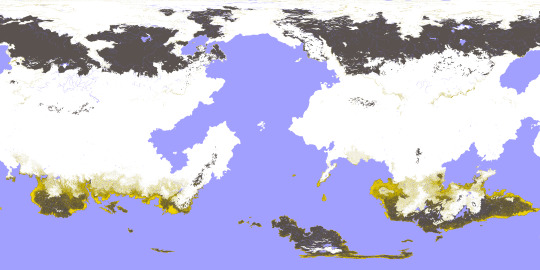
These maps and figures (except for the preexisting ones) were all created in Photopea. Higher resolution versions of many of these images can be seen in my dedicated Reddit posts, linked below:
reddit post one, reddit post two
2022
#mapmaking#imaginary maps#worldbuilding#major project#imaginary planetology#elevation#waterways#river systems#surface temperatures#ice and snow cover#sea ice#precipitation#vegetation#Insolation#high obliquity planets#explanatory diagrams#digital rendering#Photopea#Birdbug worldbuilding project#Birgs#Birgworld#2022#digital painting#extremely long post#Christopher Maida Artwork
616 notes
·
View notes
Text
The list of science branches from my friend
Branches of Science:
1. Astronomy - study of celestial objects
2. Astrology - study of celestial functions
3. Anatomy - study of body structure
4. Bacteriology - study of bacteria
5. Biology - study of life
6. Bibliology - study of books
7. Chemistry - study of substance properties
8. Chaology - study of chaos
9. Cosmology - study of universe
10. Criminology - study of crime
11. Demography - study of population
12. Demology - study of human behavior
13. Demonology - study of demons
14. Diabology - study of devils
15. Diplomatics -science of ancient writings
16. Dysteleology - study of useless organs
17. Ecclesiology - study of church affairs
18. Ecology - study of environment
19. Economics - study of material wealth
20. Egyptology - study of ancient egypt
21. Entomology - study of insects
22. Entozoology - study of parasites
23. Epidemiology - study of diseases
24. Epistemology - study of knowledge
25. Eschatology - study of final matters
26. Ethnology - study of culture
27. Ethnomethodology - communication
28. Ethology - study of natural character
29. Etymology - study of word's origin
30. Euthenics - science of living conditions
31. Exobiology - study of extraterrestrials
32. Folkloristics - study of folklore
33. Garbology - study of garbage
34. Gemmology - study of gems
35. Genesiology - study of heredity
36. Geogony - study of earth's formation
37. Geography - study of earth's surface
38. Geology - study of earth's crust
39. Geomorphogeny-landform origin studies
40. Geratology - study of decay
41. Gerocomy - study of old age
42. Gigantology - study of giants
43. Glaciology - study of ice age
44. Gloosology - study of language
45. Gnosiology - study of knowledge
46. Hagiology - study of saints
47. Hamartiology - study of sin
48. Heliology - study of the sun
49. Helmintology - study of worms
50. Hematology - study of blood
51. Heortology - study of religious feasts
52. Heresiology - study of heresies
53. Herpetology - reptiles and amphibians
54. Hierology - science of sacred matters
55. Historiology - study of history
56. Hydrobiology - study of aquatic life
57. Hydrology - study of water resources
58. Iconography - study of drawing symbols
59. Iconology - study of symbols
60. Ideology - science of ideas
61. Immunology - study of immunity
62. Irenology - study of peace
63. Kalology - study of beauty
64. Ktenology - science of killing
65. Lexicology -study of words and meaning
66. Lexigraphy - art of defintion of words
67. Linguistics - study of language
68. Liturgiology - study of church rituals
69. Mariology - study of Virgin Mary
70. Mathematics - study of numbers
71. Metaphysics - principles of nature
72. Metaphsycology - nature of the mind
73. Meteoritics - study of meteors
74. Microbiology - study of microscopics
75. Micropaleontology - micro fossil studies
76. Mineralogy - study of minerals
77. Musicology - study of music
78. Mythology - study of myths
79. Naology - study of church architecture
80. Nephology - study of clouds
81. Neurypnology - study of hypnotism
82. Neutrosophy - study of origins
83. Noology - science of intellect
84. Nymphology - study of nymphs
85. Oceanography - study of oceans
86. Ombrology - study of rains
87. Oneirology - study of dreams
88. Onomastics - study of proper names
89. Ontology - study of pure beings
90. Optics - study of light
91. Orthoepy-study of correct pronunciation
92. Orthography - study of spelling
93. Paleoanthropology-study of early human
94. Paraphsycology-bizarre phenomena
95. Pataphysics -study of imaginary solution
96. Patrology - study of early christianity
97. Pedagogics - study of teaching
98. Phenomenology - study of phenomena
99. Philology - study of ancient texts
100. Philosophy - science of wisdom
101. Planetology - study of planets
102. Polemology - study of war
103. Praxeology - study of efficient actions
104. Pseudology - art of lying
105. Pseudoptics - study of optical illusions
106. Psychognosy - study of mentality
107. Pyrgology - study of towers
108. Rheology - study of deformation
109. Scatology - study of obscene literature
110. Seismology - study of earthquakes
111. Semantolography - study of meanings
112. Semantology-science of word meaning
113. Semiotics - study of signs and symbols
114. Sexology - study of sexual behavior
115. Significs - science of meanings
116. Sindinology - study of shroud of Turin
117. Sitology - dietetics
118. Sociology - study of society
119. Soteriology - theological salvation
120. Spectrology - study of ghosts
121. Storiology - study of folk tales
122. Stratography - art in leading in army
123. Suicidology - study of suicide
124. Symbology - study of symbols
125. Synectics - processes of invention
126. Systematology - study of systems
127. Teratology - study of malformation
128. Thanatology - study of death
129. Thaumatology - study of miracles
130. Theology - study of religious doctrine
131. Toxicology - study of poisons
132. Uranography - descriptive astronomy
133. Uranology - study of the heavens
134. Vexillology - study of flags
135. Virology - study of virus
136. Volcanology - study of volcanoes
137. Zoochemistry - chemistry of animals
138. Zoology - study of animals
139. Zoosemiotics - animal communication
140. Zootaxy - science of classifying animals.
-GOOGLEDFACTS
#science#branches#science branches#branches of science#googlefacts#the things that you can study#for real
12 notes
·
View notes
Text
Finally!
There was a weird sound outside of the room where I was teaching today, and some students said it sounded like a Tardis. I had to make them repeat because I couldn't believe it. I've been giving assignments that were referring to "the imaginary planet Gallifrey" for years (I teach planetology among other topics) and there was never one student knowing where I picked up that name from. Finally some French students who know doctor who!
2 notes
·
View notes
Photo


Just getting around to posting these now that it's been weeks since I sent them in, but here's my second series of maps for @jayrockin‘s Runaway to the Stars project! This is the home planet of their Avian species of aliens, and being predominantly ocean-covered and having an obliquity of only 11 degrees, these factors result in a somewhat more stable, less seasonally variable climate than we see on Earth. Every image here is helpfully (hopefully) captioned, but for a quick summary, these maps represent the elevation data (with and without a color gradient and water systems); the seasonal ice extent (limited to the Equinoxes and an Annual Average since the Winter and Summer sea-ice extents aren’t that different and there’s very little land ice outside the poles); and maps showing the Average Annual Temperature, Total Annual Precipitation, a combination of the two along with a key, and, finally, a map broken down into distinct zones based on temperature and precipitation, ice cover, mountains, seasonality, and Continentality vs Oceanity, based loosely on the Trewartha climate classification system.
Digital Painting (Photopea)
2022
Higher resolution copies of these maps can be found in my Reddit post about this : )
#Mapmaking#Imaginary Maps#imaginary planetology#imaginary geography#worldbuilding#alien planet#Runaway to the Stars#diagrams#major project#commissioned works#fictional planets#seasonal ice extent#climate zones#climate map#temperature map#precipitation map#digital painting#Photopea#Christopher Maida Artwork
27 notes
·
View notes
Last Seen Blogs

koreyeet
HOLY SHIT GAY PEOPLE

kaivoleur
1 4 1 2

xelys-xlys
Xlys

looks-happy
Ostseekind

savv5678
Untitled