#digital rendering
Text

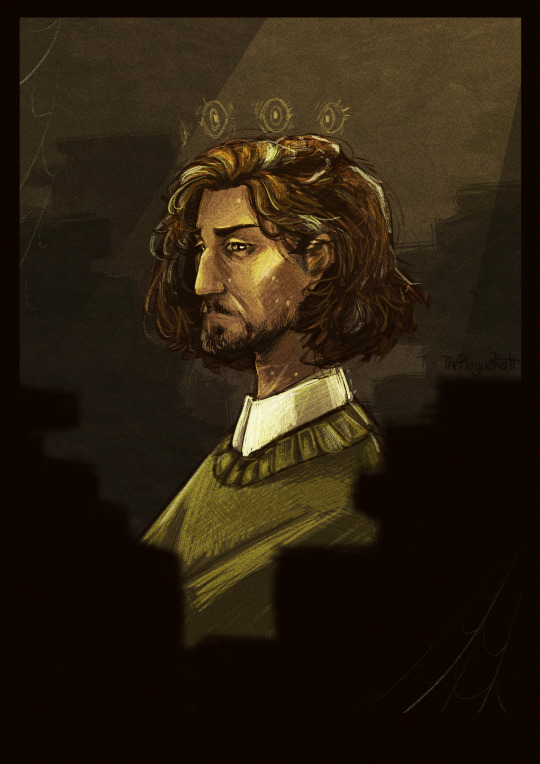
Wanted to properly draw Jon
#the magnus archives#tma jon#tma art#tma fanart#tma spoilers#kinda#the magnus archives fanart#digital art#digital rendering#digital drawing#the magnus pod#jonathan sims fanart#jonathan sims
3K notes
·
View notes
Text
Being meguca is suffering pink fluffy unicorns dancing on rainbows

#puella magi madoka magica#madoka magica#pmmm#fanart#illustration#digital rendering#madoka kaname#madoka magica fanart#what a great show#definitely no doomed yuri here#heehee...#*crying inside*#favorite show omg 😮
112 notes
·
View notes
Text


I had a fun conversation with some other cartoonists in a National Cartoonists Society open house Zoom a couple of months ago about the difference between traditional inking and "digital" inking. I mentioned always feeling a little weird calling it "inking" as, obviously, no "INK" is required in any way.
The idea sat in the back of my head until I also realized how often I draw myself at a drawing board I RARELY use anymore, and I figured I could combine the concepts and make Dandy the voice prodding the questions.
He's FAR less antagonistic than Skeezicks, who I used to use as the Anxiety Demon in the strip, but still able to get under my skin for the sake of comedy. Plus... I never get tired of drawing him. What can I say, it's my comic strip. I'm self-indulgent. lol
#inking#pen and ink#ink drawing#digital inking#digital rendering#drawing#drawing board#talking dog#cartoon#cartoon dog#verisimitude
77 notes
·
View notes
Photo
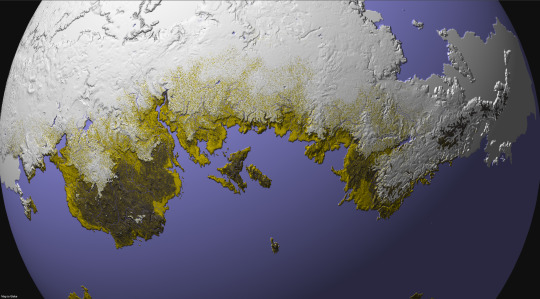
Some months ago, I created a series of maps and diagrams for @iguanodont‘s Birdbug worldbuilding project, representing the planet inhabited by their original species and its planetological data. This isn’t the first time I mapped out this planet, as I was also commissioned by Ripley back in 2020 back when I didn’t have nearly as much experience and knowledge as I do now. Two years later, I’ve been commissioned once again to revisit this world and its peculiarities.
This first map (in Equirectangular projection and poles-centered perspective) depicts the elevation for this planet, with a color gradient applied to the data.
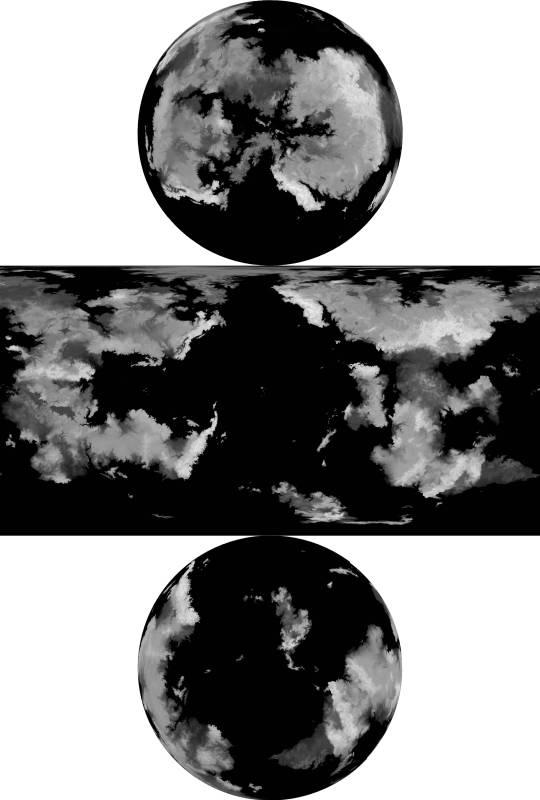
Here is the same elevation data, presented without the color gradient.
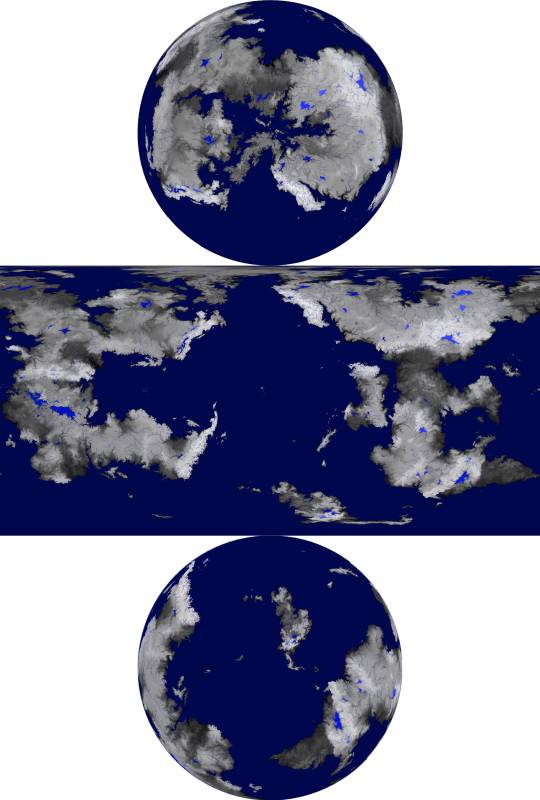
This time, the elevation is presented with bodies of liquid water included, such as rivers, oceans, and lakes.
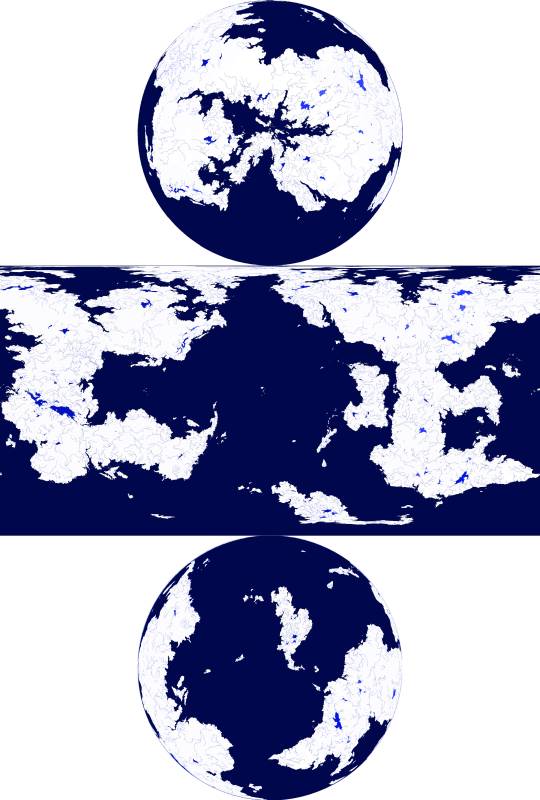
and in this one, the water is isolated from the other data, against a white background
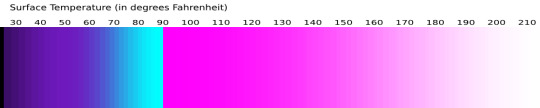
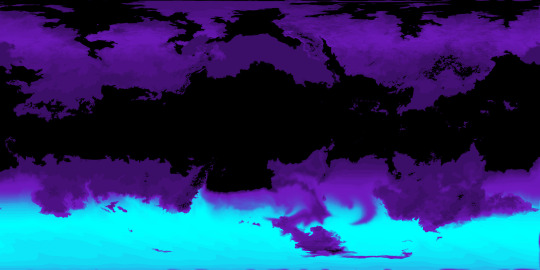
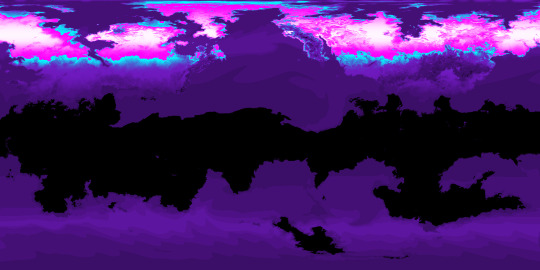
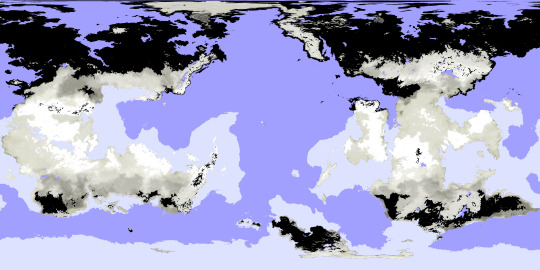
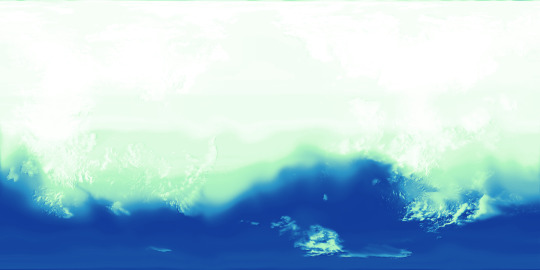
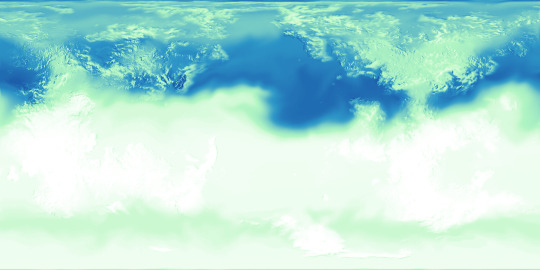
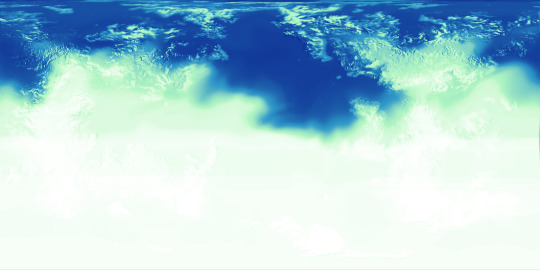
Next, there are the surface temperatures that occur on this planet, the key to which is shown above. The four maps below show the seasonal temperatures for land and sea, in order of Northern Spring Equinox, Northern Summer Solstice, Northern Autumn Equinox, and Northern Winter Solstice.
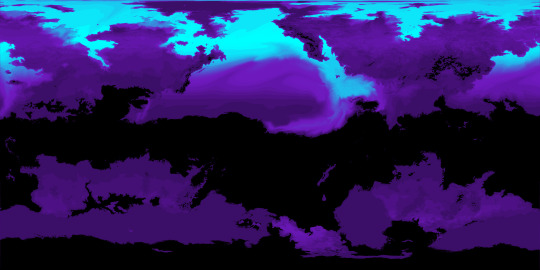
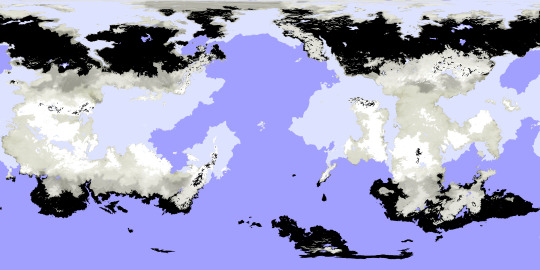
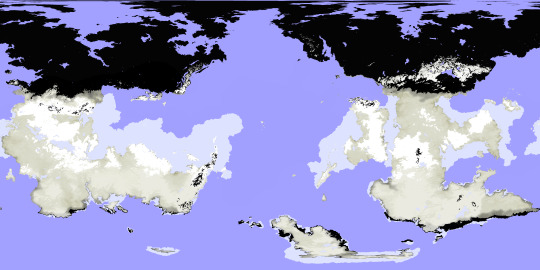
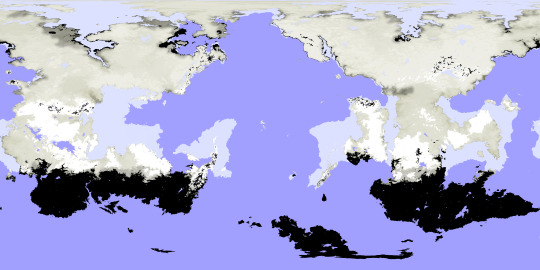
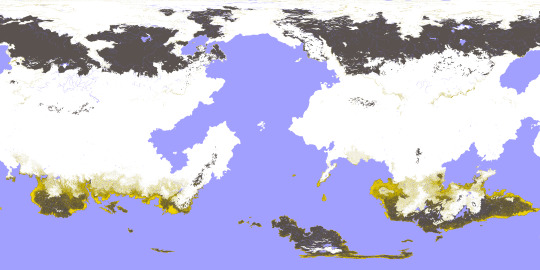
Correlating closely to the above data is the snow and ice cover, which is fairly extensive on this planet owing to its high obliquity and distance from its star. Land ice only occurs where the snow falls and is compacted year-round, but snow and sea ice can be much more seasonal.
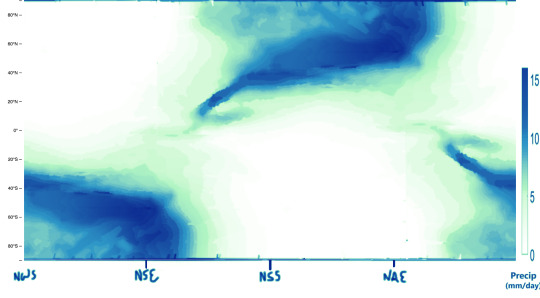
Seasonal precipitation levels were another important phase of this project, and the below diagram shows those levels for a given latitude (y-axis) on a given date (x-axis), with a key attached.
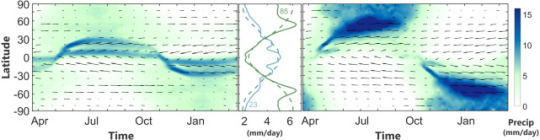
My reference for creating the above graphic is the figure below, which comes from a 2019 paper by A.H. Lobo and S. Bordoni titled “Atmospheric Dynamics of High Obliquity Planets”, and shows Earth’s precipitation levels compared to those of a planet with an 85° obliquity.
The following maps can now be better understood in light of these diagrams and keys.
-Northern Spring Equinox
-Northern Summer Solstice
-Northern Autumn Equinox

-Northern Winter Solstice
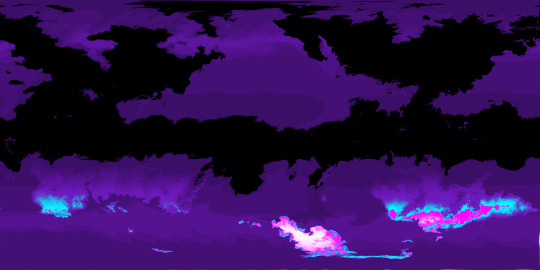
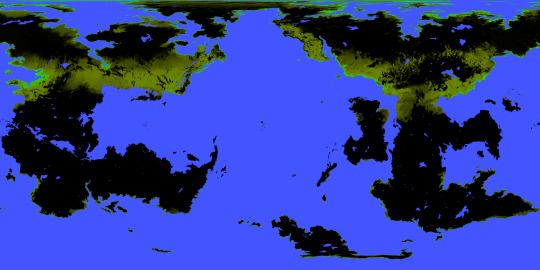
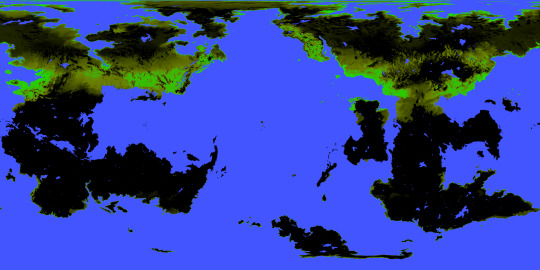
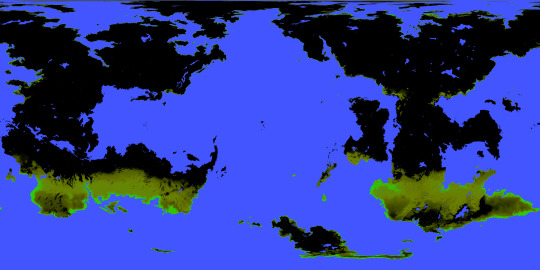
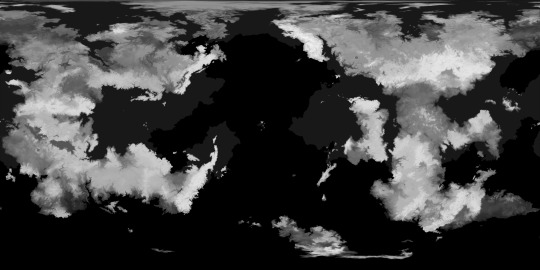
I was also tasked with mapping out the extent and density of this planet’s vegetation (or at least its alien equivalent), and from this you can see how wildly it varies by season, with very few year-round holdings. Precipitation is a major factor in where it is possible for plants to flourish, but snow cover and the extreme temperature swings limit it too. Near either pole, for example, within the space of a year temperatures soar far above Earth’s upper limits and also plummet below freezing; if either extreme were to be the annual norm for a region, some plants might adapt to those conditions, but because of the wild fluctuation any adaptations to one extreme would leave plants especially vulnerable to the other. These regions, then, remain barren regardless of rainfall or brief windows of mild temperatures, while areas with less wide temperature ranges allow for at least brief periods of flourishing.

Determining the surface temperatures for this planet required a lot of background work. The first piece of the puzzle for this was knowing the number of daily hours of sunlight for a given latitude and date, which is exemplified first in this diagram for Earth:
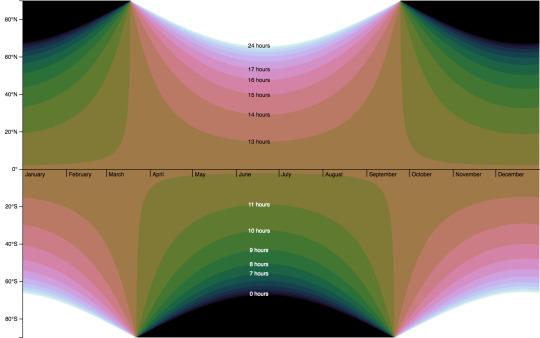
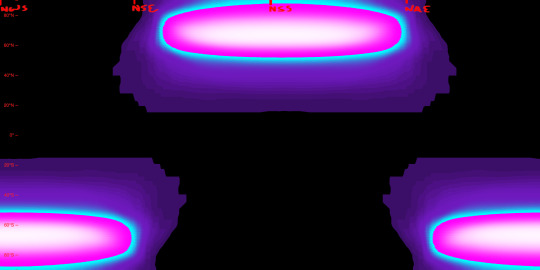
and then for the Birdbug planet, below. Since this planet rotates on an axis of 60 degrees, there are many more latitudes within range of either pole that experience periods of sunlight and darkness lasting longer than a day. The higher the latitude, the longer this period lasts, with the poles themselves experiencing either condition for half a year at a time.
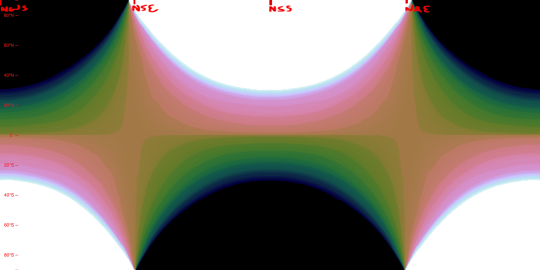
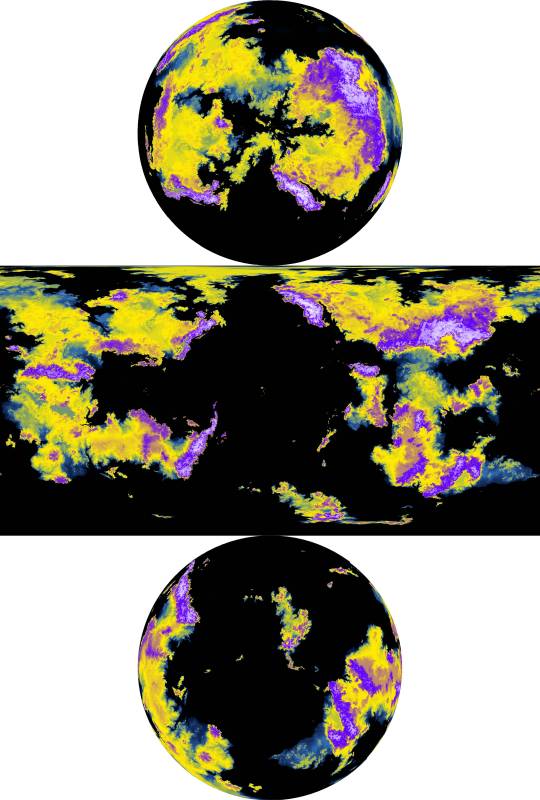
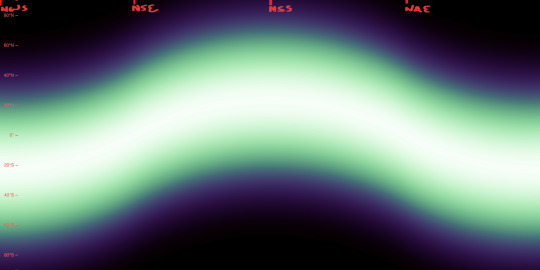
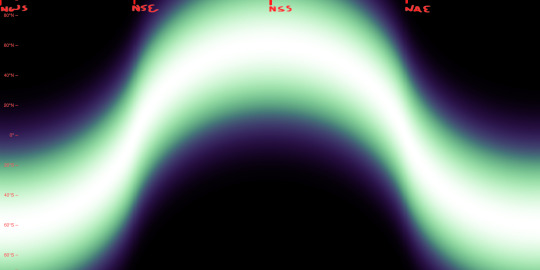
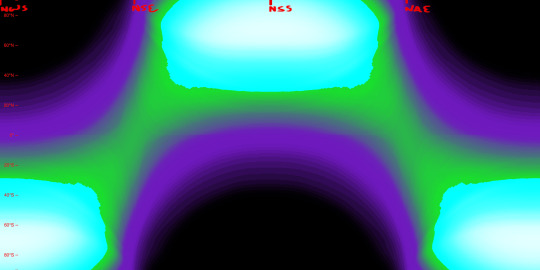
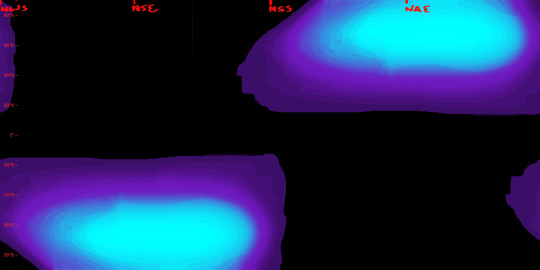
Another important factor is the height to which the sun is seen to rise (more scientifically, the angle at which the sun’s light hits parts of the planet’s surface), seen here first for Earth and then for the Birdbug planet. In these diagrams, white represents the sun reaching the zenith of the sky (meeting the surface at a 90° angle), and black represents the sun failing to appear above the horizon (meeting at an angle of 0° or below), while shades of green and purple stand in for angles between those extremes. For Earth and the Birdbug planet alike, the sun reaches the zenith within the bounds of either planet’s Tropic circles of latitude, and fails to rise at all only within the Polar circles of latitude; the difference in obliquity means that the Birdbug planet’s key circles of latitude are flipped compared to Earth’s.
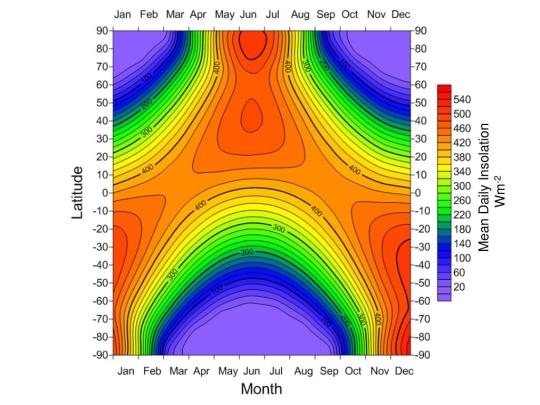
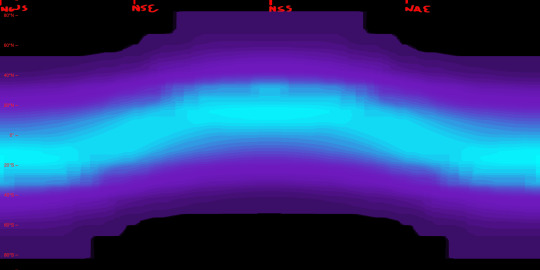
The duration of sunlight and the angle at which that sunlight is reaches the planet’s surface determine a planet’s Insolation, that is, the amount of solar energy it receives. The first image below is a preexisting diagram of Earth’s Insolation, where it is measured in watts per square meter. The next two images are my own attempts at replicating this data for Earth, and then for the Birdbug planet.
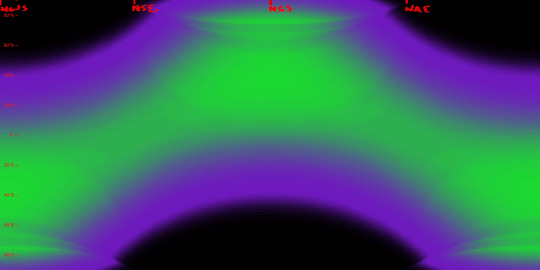
As seen in the diagrams above, Insolation on the Birdbug planet differs from Earth not only in its latitudinal distribution, but also in its sheer intensity at the higher latitudes. Compared to Earth there are twice as many latitudes for which the sun is shining longer than one rotational period, and many of those latitudes see the sun shine at a direct or nearly direct angle, whereas the Polar circles of latitude on Earth see the sun shine much more obliquely.
Below, we can see the data that all the above figures were instrumental in finding: that is, surface temperatures. The first image is a preexisting figure that measures Earth’s mean surface temperatures by date and latitude, and below that is my attempt at replicating the data by my own process.
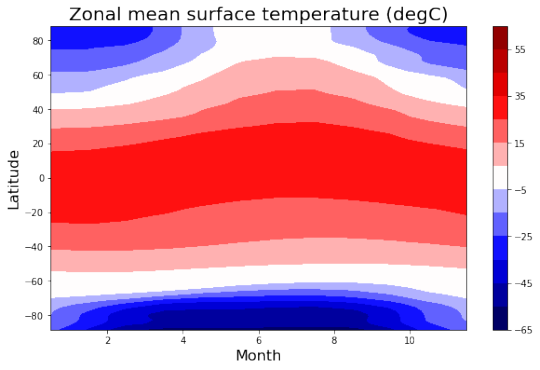
This is done not by just copying the seasonal Insolation data, but by also factoring in the yearly average for each latitude.
Above, we see the temperatures of the land by date and latitude, and below, we see the temperatures at the surface of the sea, which lag behind the land temperatures and remain comparatively mild.
Lastly, here’s an image I created to combine the snow and ice cover as well as the vegetation extent and density, as of the Northern Spring Equinox. This, along with the elevation map also seen here, is what I uploaded to maptoglobe.com in order to produce the screenshot at the top of this post.
These maps and figures (except for the preexisting ones) were all created in Photopea. Higher resolution versions of many of these images can be seen in my dedicated Reddit posts, linked below:
reddit post one, reddit post two
2022
#mapmaking#imaginary maps#worldbuilding#major project#imaginary planetology#elevation#waterways#river systems#surface temperatures#ice and snow cover#sea ice#precipitation#vegetation#Insolation#high obliquity planets#explanatory diagrams#digital rendering#Photopea#Birdbug worldbuilding project#Birgs#Birgworld#2022#digital painting#extremely long post#Christopher Maida Artwork
616 notes
·
View notes
Text

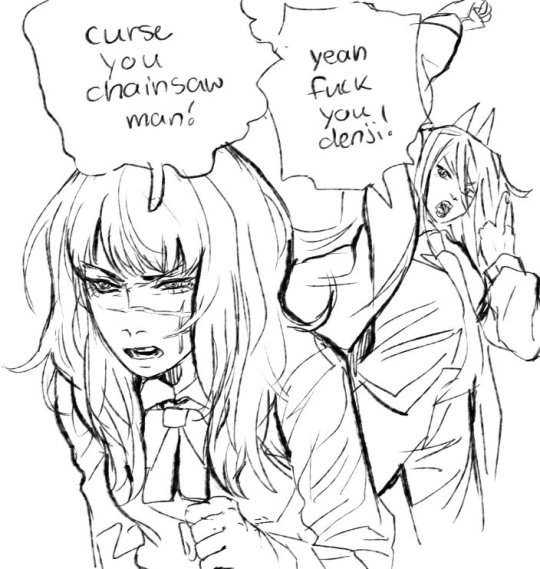
theyd be besties "the type to get into the meanest fights every other week"
insp @/yoshidop on tiktok
#power csm#chainsaw man#chainsaw man power#chainsaw man part 2#chainsaw man fanart#csm#chainsaw man yoru#art#illustration#artist#artwork#draw#fanart#digital art#anime artist#sketch#digital rendering#drawing rendering#digital drawing
356 notes
·
View notes
Text

BlackWidow
I rendered this a tad too much for my liking, I wanted it to be a tad more flat/rough looking.
#my art#art#digital art#digital painting#digital rendering#digital illustration#gothic horror#horror#skull#black widow#black widow spider#spider#fantasy#fictional#fantasy creature#fictional creature#monster design#creature design#artist on tumblr
495 notes
·
View notes
Text
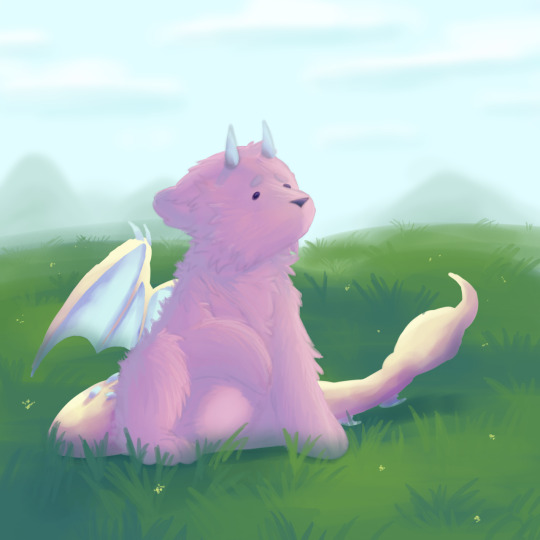
Look at him
Look at my son
9 notes
·
View notes
Text
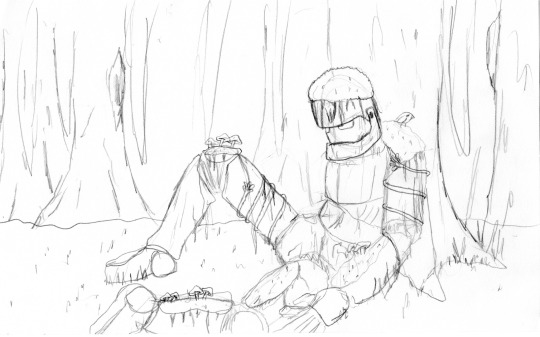
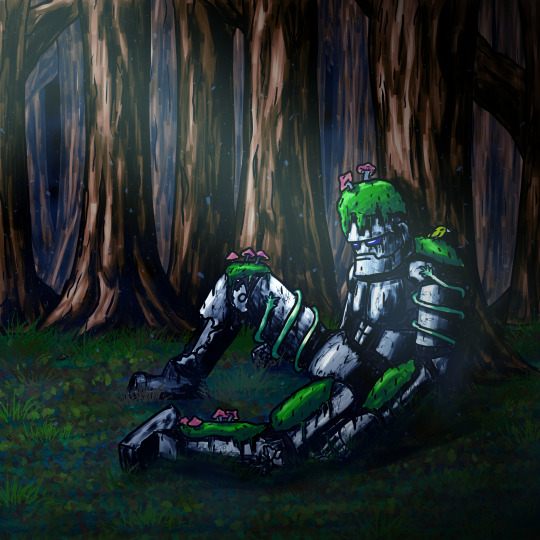
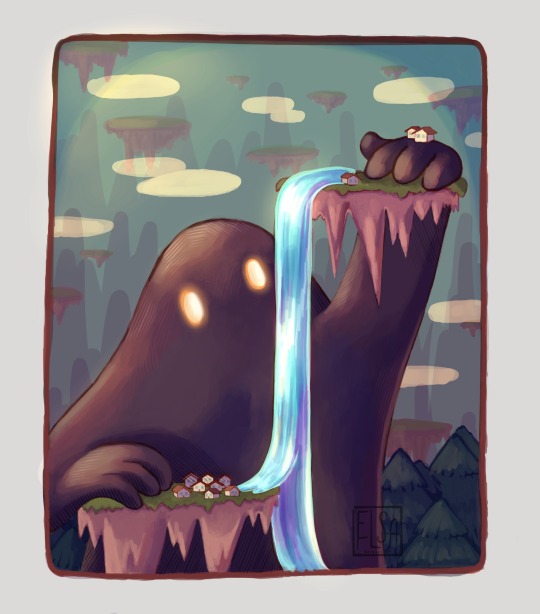
It is the start of a new year. 2024. Here is artwork that I did almost 10 years ago and the digital rendering of it that I did around mid 2023.
I should be back to my digital art in February. But still enjoying learning the fundamentals.
#learning artist#art improvement#pencil drawing#digital art#robot#forest#moss#digital rendering#new year#2024#goals#comparison#keep learning#life goals#improving#art practice#art#machine
7 notes
·
View notes
Photo
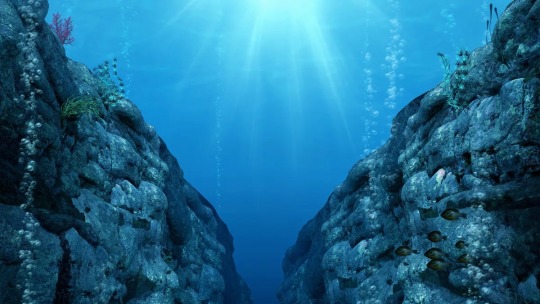
A digital rendering of the Mariana Trench, the deepest place in the Pacific Ocean and the world.
(Image credit: ratpack223 via Getty Images)
9 notes
·
View notes
Text
2 notes
·
View notes
Text

➽───────────────❥
" i just keep riding around again,
to these broken hearted beats, yeah. "
➽───────────────❥
➽───────────────❥
oh shit its the middle of the night when did that happen
uhh whoops
new favorite song btw:33
➽───────────────❥
in retrospect probably should have used a reference huh
this also isnt a character i just made shit up lmao
anyways heres a rendering practice i did, started as an attempt to prevent myself from having a breakdown but i got a wee bit too invested and spent about 4 hours on it < 33
➽───────────────❥
oh yeah and textless version :D

➽───────────────❥
#digital art#drawing#art#digital drawing#digital illustration#rendered#rendering practice#digital rendering#song#lyrics#lyric#attica riots#no hands#pink#bright colors#no hands attica riots#Spotify
2 notes
·
View notes
Text
I realized i never actualy drew Jon so here he is :3
#digital art#digital artist#digital rendering#digital illustration#the magnus archives#the magnus pod#tma art#tma fanart#tma spoilers#tma podcast#tma jon#jonathan sims#jon sims#the eye#jonathan sims fanart#the magnus archives fanart
711 notes
·
View notes
Text
14 notes
·
View notes
Text
Lonely Winter Rose
A digital rendering of a traditional painting that I recently made.

#Art#Traditional Art#Digital rendering#graphic design#artists on tumblr#Mixed Media#Floral art#Flower art#Rose Art
5 notes
·
View notes
Photo
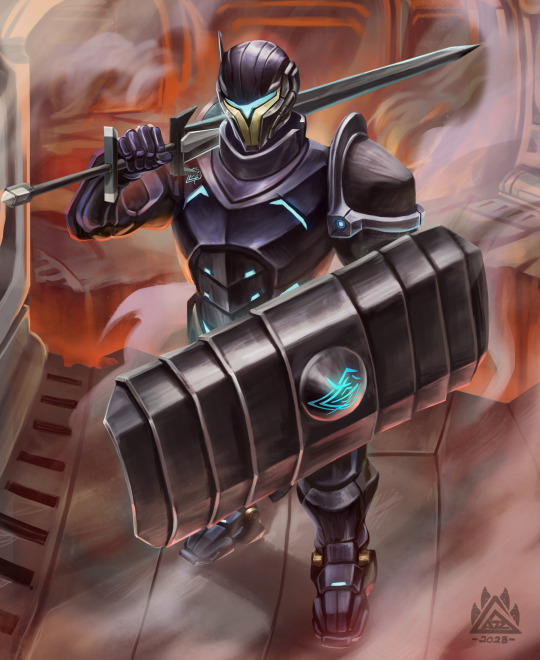
Knight of the Dangermeld
commission art
cool sci-fi character scene i was able to make!
#art#scifiart#digital art#noAI#myart#commission work#illustration#digital rendering#concept art#procreate
3 notes
·
View notes
Text
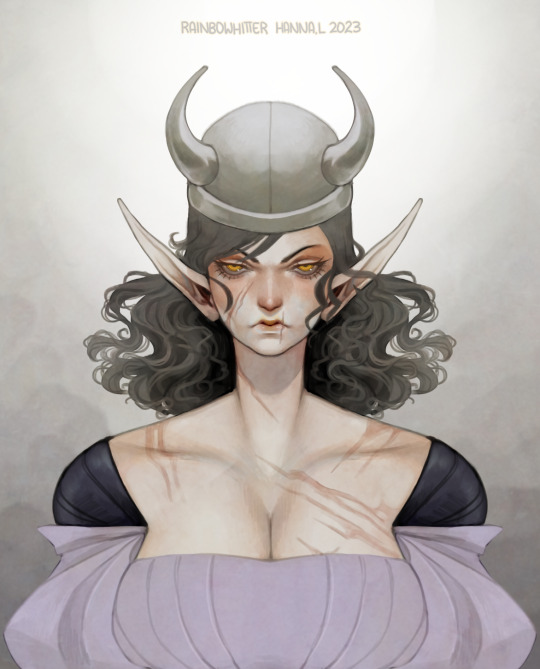
Angry bastard, aka one of the player characters from my campaign.
#my art#digital art#art#digital painting#digital rendering#character art#character design#dungeons & dragons#dnd character#dnd oc#dnd elf#elf#fantasy#fantasy creature#fantasy race#fantasy character#digital portrait#portrait#artist on tumblr#dnd barbarian
20 notes
·
View notes
Last Seen Blogs

klauseassoc
KLAUSE & ASSOC.

coisas-que-eu-gosto
Coisas que eu gosto

reidluvs
star

power-lemon
Sans titre
judgemental-goose
Land Of Stupid Main Characters