#chloroplasts autofluorescence
Photo

A maximum projection of the deconvolved Z-stack of moss Physcomitrium patens protonemal cells. Cell walls (in cyan) were stained live with calcofluor white. Chloroplasts autofluorescence is in Fall LUT.
By Ivan Radin (USA).
Olympus Image Of The Year Award
#ivan radin#photographer#united states#olympus image of the year award#deconvolved z-stack#moss physcomitrium patens protonemal cells#plant#calcofluor white#chloroplasts autofluorescence#fall lut#micro photography#nature
17 notes
·
View notes
Photo
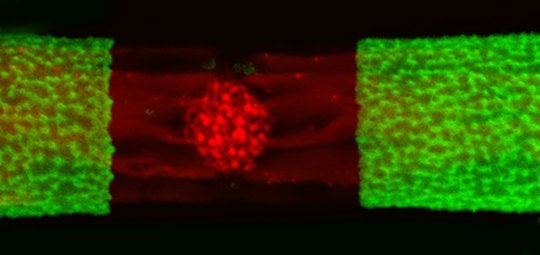
Image of the Week – September 11, 2017
CIL:41563 - http://www.cellimagelibrary.org/images/41563
Description: Confocal micrograph of a green alga, Penium margaritaceum. The cell wall is shown in green and the chloroplast is represented by autofluorescence. Honorable Mention, 2011 Olympus BioScapes Digital Imaging Competition®.
Authors: David Domozych and 2011 Olympus BioScapes Digital Imaging Competition®
Licensing: Attribution Non-Commercial No Derivatives: This image is licensed under a Creative Commons Attribution, Non-Commercial, No Derivatives License
22 notes
·
View notes
Text
Fwd: Postdoc: StockholmU_UppsalaU.MarineEndosymbiosis
Begin forwarded message: > From: [email protected] > Subject: Postdoc: StockholmU_UppsalaU.MarineEndosymbiosis > Date: 30 September 2019 at 06:14:09 BST > To: [email protected] > > > Joint postdoc position in Marine Microbiology with Emphasis on > Endosymbiosis in the Department of Ecology, Environment and Plant Sciences > at Stockholm University and in the Department of Organismal Biology at > Uppsala University (Sweden). > > See full description and how to apply here: > https://ift.tt/2mNOsWe > > Closing date: November 5, 2019 > > Project description: The position is associated with a project > on characterising an enigmatic marine endosymbiosis in the genus > Meringosphaera. Meringosphaera are single-celled eukaryotes that are > globally distributed and are considered photosynthetic based on consistent > observations of autofluorescent ‘green bodies’ and absence of feeding > behaviours. The autofluorescent bodies, however, have not been verified > as true chloroplasts by ultra-structure or genetic analysis. In fact, > no molecular data is available for Meringosphaera. The overarching goals > of this two year postdoctoral project are to characterize the genetic > integration and metabolic function of the photosynthesizing bodies of > Meringosphaera. A suite of single cell methods wil be employed including > halogenated in situ-hybridization (HISH)-secondary ion mass spectromtey > (HISH-SIMS), flow activated sorting (FACs) for single cell genome and > transcriptome sequencing, confocal laser scanning microscopy (CLSM). The > position is a collaborative project between the laboratories of Rachel > A Foster from SU and Fabien Burki from UU. > > Main responsibilities: The position involves sampling, imaging by CLSM, > and attempts for cultivation of Meringosphaera cells in enrichment > cultures. Additonally, managing the sample preparations for FACS, single > cell sequencing, and implementation of stable isotope experiments and > preparing and overseeing samples for nanoSIMS analyses. Training will > be provided when necessary. > > Qualification requirements: Postdoctoral positions are appointed primarily > for purposes of research. Applicants are expected to hold a Swedish > doctoral degree or an equivalent degree from another country. The selected > candidate must possess expertise and knowledge in microbial sampling as > well as identifying and handling small eukaryotic plankton. Experience > in culturing of microbial eukaryotes with background in eukaryotic > diversity and photosymbiosis will be seen as highly valuable. A suite of > methodologies will be used in the proposed work and hence the following > skills are desirable: use of basic and/or advanced microscopy platforms > (epi-fluorescence, CLSM), use and or understanding of FACS, basic > molecular based assays including kit based assays (e.g. nucleic acid > extractions, PCRs, genome amplification kits), library preparations > for bar-coding, and genome analysis. Previous experience with stable > isotopes, and in field expeditions (e.g. ocean-going cruises) are also > good qualifications but not necessary. The candidate should be interested, > motivated and flexible to move between the labs of Foster (SU) and Burki > (UU) as experiments will be carried out at both locations. Candidates > must be fluent in English. > > Assessment criteria: The PhD degree should have been completed no more > than three years before the deadline for applications. An older degree may > be acceptable under special circumstances, which may involve sick leave, > parental leave, clinical attachment, elected positions in trade unions, > or similar. In the appointment process, special attention will be given to > documented research skills as described in the qualification requirements > (e.g. assay development, cultivation, work with single celled eukaryotes, > various above mentioned single cell methods), and publication history. > > Terms of employment: The position involves full-time employment for a > maximum of two years, with the possibility of extension under special > circumstances. Start date as soon as possible, and no later than > 2019-12-31. > > Contact: Further information about the position can be obtained from > Dr. Rachel A. Foster, telephone: +46 8 16 12 07, [email protected] or > Dr. Fabien Burki, telephone: +46 18-471 27 79, [email protected]. > > This project is founded by a grant from SciLifeLab (www.scilifelab.se), > a Swedish national center for molecular biosciences with focus on health > and environmental research. The center combines frontline technical > expertise with advanced knowledge of translational medicine and molecular > bioscience. SciLifeLab is hosted by four Swedish universities (Karolinska > Institutet, KTH Royal Institute of Technology, Stockholm University and > Uppsala University) and collaborates with several other universities. > > > När du har kontakt med oss på Uppsala universitet med e-post > så innebär det att vi behandlar dina personuppgifter. För > att läsa mer om hur vi gör det kan du läsa här: > https://ift.tt/2HNlmKU > > E-mailing Uppsala University means that we will process your personal > data. For more information on how this is performed, please read here: > https://ift.tt/2Fl6lUE > > > [email protected] >
via IFTTT
0 notes
Text
Protein expression guided chemical profiling of living cells by the simultaneous observation of Raman scattering and anti-Stokes fluorescence emission
Anti-Stokes fluorescence excitation of fluorescent proteins
Despite several scattered reports on the anti-Stokes fluorescence emission from chloroplasts25, organic26,27 and inorganic dyes28, to the best of our knowledge, the anti-Stokes fluorescence excitation of FPs has never been reported before. To verify whether the anti-Stokes emission from FPs can be detected under Raman measuring conditions, we recorded the emission spectra of various FPs with a shorter emission peak than the continuous-wave (cw) 532 nm laser that we use for our Raman experiments (Fig. 2a). For the FPs with emission spectra much shorter than 532 nm, i.e. blue fluorescent protein (BFP, emission peak at 445 nm), almost no fluorescence signals can be detected. However, for FPs with a closer emission spectra to 532 nm, i.e. enhanced cyan fluorescent protein (ECFP, emission peak at 476 nm), monomer teal fluorescent protein (mTFP, emission peak at 492 nm) and green fluorescent protein (GFP, emission peak at 509 nm), an obvious fluorescence emission peak can be seen at the anti-Stokes side of the spectra. One point that is worth mentioning is the absence of resonance enhanced Raman peaks of the fluorescent protein chromophore at the Stokes region of the spectra. This proves that our anti-Stokes fluorescence excitation method will introduce minimum perturbation to the Stokes spectral window that is left for Raman measurements. Note that in Fig. 2a, the GFP spectrum has its intensity divided by 100 times, which means that it has a much stronger emission than all other FPs. The anti-Stokes fluorescence excitation process is a universal phenomenon that is not limited by the combination of excitation laser and FPs mentioned above. As long as the absorption peak of the FPs is within a certain range to the excitation laser, there is a huge flexibility for the choice of excitation wavelengths and FPs (Sup. 1). These facts already suggest that the fluorescing mechanism we report here is not a multiphoton excitation scheme of the ultraviolet absorption peak of FPs as one of our previous reports indicated29.
Figure 2
(a) The anti-Stokes fluorescence emission spectra of BFP, ECFP, mTFP and GFP. The spectral valley around 532 nm is due to the notch filter, and the weak remaining of Rayleigh scattering at 532 nm can still be seen at the centre of the spectral valley. Note that the excitation intensity for GFP is 100 times lower than the other FPs, because the emission spectrum for GFP would saturate otherwise. (b,c) shows the fluorescence response according to excitation intensity of ECFP and mTFP. Both of them shows a slope at around 1 in the log plot, which indicates the anti-Stokes excitation of FPs is a single-photon process. Standard deviation bars of each spot are from 3 repeated measurements. The blue region between 1~4 mW/μm2 excitation intensity is the common condition to measure the Raman spectra of cells.
To further identify the fluorescing mechanism of the FPs, we verified their fluorescence intensity response according to the excitation intensity. In Fig. 2b and c, the logarithm plot clearly showed a slope at around 1 for both ECFP and mTFP (GFP is not tested because its fluorescence signal easily saturates). This result is a strong evidence that both ECFP and mTFP are excited in a single photon excitation manner, even though their emission peaks are at the wavelength region shorter than the excitation laser light. It is especially worth mentioning that a cw laser can be used for the anti-Stokes fluorescence excitation of FPs, thus the same principle can be readily adaptable to any existing fluorescence microscopes to increase the number of imaging channels26.
Hybrid fluorescence-Raman imaging of cells
After demonstrating the feasibility of anti-Stokes fluorescence excitation in purified FP systems, next is to apply the method for the hybrid fluorescence-Raman imaging of HeLa cells that express different FP fusion constructs. Cross-talk free anti-Stokes fluorescence image and cytochrome c, protein and lipid Raman image HeLa cells were successfully obtained from HeLa cells transfected with histone-ECFP (Fig. 3a∼e) and B4GalT1-mTFP (Fig. 3f∼j). Histone is the protein that help pack the DNA inside cell nucleus30. B4GalT1 encodes the β-1,4-galactosyltransferase 1 that helps the synthesis of poly-N-acetyllactosamine, and localise in the trans-Golgi network31. The fluorescence contrast in Fig. 3a and f corresponded well to those of histone and B4GalT1, i.e. cell nucleus and Golgi body respectively. The presented spectra have been processed by SVD denoising, and the anti-Stokes fluorescence images were composed by using the denoised hyperspectral dataset. The different colour spectra presented in Fig. 3e and j were selected from a representative pixel within the corresponding colour images (Fig. 3a∼d and f∼i) of the hyperspectral datasets. To verify whether the anti-Stokes excitation of FPs bring unexpected effects to the fluorescence image, we have also compared the two anti-Stokes fluorescence image with the standard wide-field Stokes fluorescence image of the specimen. The result proved that although the fluorescing mechanism is different, both FP imaging methods give almost identical imaging contrast (Fig. 4). However, slight differences in FP localisation can be observed between the two B4GalT1-mTFP images (Fig. 4f). This is because the standard fluorescence image was taken before the hybrid fluorescence-Raman image, and the movement of Golgi bodies within the short time was recorded. This result also highlights the importance of hybrid imaging. Since living cells are dynamic samples that constantly change their morphology and chemical state, if any time lag exists between the fluorescence and Raman measurements, the accuracy of further chemical analyses according to FP expression pattern would be significantly lowered. Our hybrid imaging technique ensures that the fluorescence and Raman data are fully synchronised, and eliminate such uncertainties.
Figure 3
(a∼e) are the anti-Stokes fluorescence image (a), resonance enhanced 750 cm−1 cytochrome c Raman image (b), 1680 cm−1 amide I Raman image that shows protein contrast (c), 2852 cm−1 CH2 stretch Raman image that shows long chain lipids (d), and the hybrid spectrum taken from a random pixel of the corresponding contrasts (e). Cyan is the spectrum with strong CFP emission, green is with strong cytochrome c contrast, magenta from strong protein contrast and red from strong lipid contrast. Note that all these information are acquired within a single scan of the sample. (f∼j) are the respective images and spectrum of B4GalT1-mTFP labelled HeLa cells as described earlier. All 3 repeats of successfully transfected histone-ECFP HeLa cells and all 6 repeats of successfully transfected B4GalT1-mTFP HeLa cells showed successful combination of fluorescence and Raman imaging as shown here. Also, please note that the presented spectra are without fluorescence background subtraction, but the Raman images are with background subtraction calculations. The width of all images are 40 µm.
Figure 4
(a,b) are the respective anti-Stokes fluorescence image and wide field normal fluorescence image of histone-ECFP labelled HeLa cells, and (c) is the colour merged image of (a), red channel, and (b), green channel. (d–f) are the respective anti-Stokes fluorescence image, wide field normal Stokes fluorescence image and colour merged image of B4GalT1-mTFP labelled HeLa cells. (d) is the red channel and (e) is the green channel in (f). (a,d) shows much lower background signal than (b,e) because the anti-Stokes images are taken in a slit-scan manner, which uses a slit to reject out-of-focus background signals, while (b,e) are wide field images without any restrictions in the detection path. It is worth noting that some of the Golgi bodies are displaced between (d,e), as clearly shown by the white arrows in (f). (f) is merged by optimising the contrast overlap in the top left and bottom right cell. The width of all images are 40 µm.
Another concern regarding the anti-Stokes excitation of FPs in live-cell imaging is how the Stokes emission tail of the anti-Stokes fluorescence emission (Fig. 2) would influence the Raman spectra in the hybrid fluorescence-Raman hyperspectral dataset. To address this issue, first, we compare the spectra taken at the subcellular region with and without anti-Stokes fluorescence signals (Fig. 3e and j, spectra in cyan vs. the spectra with other colours). In histone-ECFP transfected cells (Fig. 3e), the spectrum in cyan showed a very weak anti-Stokes fluorescence peak that is barely stronger than the other spectra at the anti-Stokes side. At the Stokes side, the overall background for the spectrum in cyan is almost identical to the cytosol spectrum (in magenta) across 500~3000 cm−1, indicating that Stokes ECFP emission tail has negligible effect to the Raman spectra. In the case of B4GalT1-mTFP transfected cells (Fig. 3j), the spectrum in cyan shows a much stronger anti-Stokes fluorescence emission than ECFP in Fig. 3e. Due to the strong anti-Stokes fluorescence intensity, even at the Stokes side, the spectrum in cyan has a significantly higher background than the cytosol spectrum (in magenta), which is around the level of the mitochondria spectrum (in green). This indicates that for ECFP and mTFP, the influence of their Stokes emission tail to the cell Raman spectra is at most around the level of autofluorescence background fluctuation in the cells, which can be easily eliminated by background subtraction algorithms. To more convincingly demonstrate the small effect of the Stokes emission tail of the FPs, we compared the hyperspectral images constructed by the anti-Stokes fluorescence emission band, cytochrome c Raman band and fluorescence background at the silent region of the Raman spectra (Sup. 2). The completely distinct imaging contrast between the anti-Stokes fluorescence contrast and Stokes fluorescence background contrast clearly demonstrate that the main contributor for the two fluorescence signals come from different origins. The high similarity of the Stokes fluorescence background contrast to mitochondria, imaged by the cytochrome c contrast, further suggests that the main contributor of the Stokes fluorescence background is indeed autofluorescence32.
To minimise the background influence on the Raman images, the Stokes region of the hyperspectral dataset were extracted and an automated autofluorescence background subtraction method33 was applied before the Raman images were reconstructed (Fig. 3b∼d and g∼i). The cytochrome c, protein and lipid Raman images in Fig. 3 all correspond well to our previously reported Raman images of the corresponding vibrational modes34,35, with minimal cross-talk from the anti-Stokes fluorescence image of the same hyperspectral dataset. This indicates that our hybrid fluorescence-Raman imaging technique indeed provides authentic fluorescence and Raman information for further analysis. The proper combination of FPs and excitation laser is the key of this technique. For example, even under the 532 nm anti-Stokes excitation scheme, the fluorescence signal from GFP is so strong that it overwhelms the Stokes region of the spectra and severe fluorescence signal contamination can be seen in the Raman images (Sup. 3). However, as demonstrated in Sup. 1, by using a different excitation wavelength, it is still possible to use any FP of interest for hybrid imaging. Beside FPs, we have also verified that our method can be applied to chemical probes such as CellTracker (Sup. 4). The hybrid fluorescence-Raman imaging technique is therefore a universal technique that can be applied to most fluorescence imaging studies of living cells to provide the general chemical state of the cell.
The chemical analysis of stem cells according to Oct-4 expression
Being able to image fluorescence and Raman contrasts at the same time means that the setup enables us to correlate the chemical profile of the cell to its protein expression pattern for the first time. Since our previous studies have successfully visualised the chemical evolution of stem cells throughout their differentiation process4,36, here we use stem cell differentiation again as the model system to verify whether our technique is sensitive enough to detect the chemical difference between stem cells across subtle differentiation steps. Transcription factor Oct-4 play a key role in maintaining stem cell pluripotency37. Mouse embryonic stem (ES) cells cultured in medium with leukaemia inhibitory factor (LIF) maintains pluripotency and show high expression level of Oct-4. Once LIF is removed from culture medium, ES cells begin to differentiate with reduced Oct-4 expression37. Here, we established a reporter gene system that uses Oct-4 promoter to drive TFP expression. For ES cells containing the reporter, TFP fluorescence emission would be observed before differentiation, and disappear after they lose their pluripotency38.
The hybrid Raman-fluorescence imaging of ES cells containing the reporter was conducted after LIF was removed from the culture medium for 3 days to let the cells enter their early stage of differentiation. The hyperspectral hybrid fluorescence-Raman datasets of the ES cells again showed negligible cross-talk between the fluorescence and Raman images (Fig. 5a∼e). However, this time a clear photobleach effect of the mTFP signal can be seen (Fig. 5a). Considering the really low absorption cross-section of mTFP under this off-peak illumination condition, such obvious photobleaching phenomenon was unexpected. The reason behind the unexpected photobleaching rate might be due to the overlap of the incident laser to both the absorption and emission spectra, which resulted in the stimulated cycling between the fluorophore excited state and ground state. It is possible to reduce the laser intensity to minimise such effect (Sup. 5), but the signal-to-noise ratio of the Raman spectra will also decrease, thus reduce the quality of the chemical information presented in the Raman spectra. Comparing the anti-Stokes fluorescence image and transmission optical image of the ES cells (Fig. 5a and f), we show that the ES cells have come to the differentiation stage that even within the same colony, part of the cells has already lost their pluripotency (hence the inactivation of Oct-4) and the other part of the cells are still in the course of differentiating (hence the expression of mTFP through an active Oct-4 promoter).
Figure 5
(a∼e) are the anti-Stokes fluorescence image (a), resonance enhanced 750 cm−1 cytochrome c Raman image (b), 1680 cm−1 amide I Raman image that shows protein contrast (c), 2852 cm−1 CH2 stretch Raman image that shows long chain lipids (d), and the hybrid spectrum taken from a random pixel that strong anti-Stokes fluorescence signal can be seen in the field of view of mouse ES cells transfected with pOct4-mTFP. (f) shows the wide field optical image of the ES cells. By comparing (a,f), it is clear that some cells in the colony express Oct-4 while the others do not. (g,h) shows the DAPC result for ES cells expressing (Oct-4+) and not expressing (Oct-4−) Oct-4 using linear (g) and quadratic (h) discrimination algorithms. Each spot represents the averaged spectrum from one cell. DAPC is able to roughly discriminate ES cells with different Oct-4 expression pattern with a 25.71% and 16.67% error rate in (g) and a 8.57% and 8.33% error rate in (h). (i) shows the F1 vector that represents the most dominant spectral difference between the Oct-4+ and Oct-4− groups. The width of all images are 40 μm.
Since our new hybrid setup can simultaneously acquire the Raman spectra of these ES cells, we continued to verify whether the Stokes Raman spectra is sensitive enough to identify the subtle chemical difference between these ES cells with different expression pattern of Oct-4, but at close differentiation steps. The spectral analysis method we choose for the purpose is the discriminant analysis of principle components (DAPC)39,40. The linear discrimination plot showed a 25.71% error rate to correctly categorise an Oct-4 expressing (Oct-4+) cell, and a 16.67% error rate to correctly categorise an Oct-4 non-expressing (Oct-4−) cell (Fig. 5g); while the quadratic discrimination plot showed a 8.57% error rate to correctly categorise an Oct-4+ cell, and a 8.33% error rate to correctly categorise an Oct-4− cell (Fig. 5h). To further confirm the statistical significance of the result, we applied Wilks’ lambda test to our result and got a p-value of 0.0087%. This demonstrates that our method can indeed guide Raman spectroscopy to discriminate the tiny chemical shift related to the on-and-off of a specific gene, in this case Oct-4. Furthermore, during DAPC calculation, an F1-vector is drawn between the centres of the two groups in the PC hyper-space. This F1-vector is considered to represent the largest spectral difference in between the two groups after all the meaningful PCs have been taken into account (Fig. 5i). The F1-vector is basically fluorescence background free, suggesting that the fluorescence emission tail at the Stokes region is not the key factor that separates the 2 groups. However, considering that some biomolecules may be more abundant in Oct-4+ cells and others more abundant in Oct-4− cells, the spectral profile of the F1 vector would be a mix of positive and negative Raman spectral components from these differences, making the F1 vector difficult to interpret. More chemical details might be revealed with the further advancements in multivariate spectral analysis techniques to help resolve the detailed spectral components in the F1 vector.
Chemical analysis of the fluorescence labelled sub-cellular compartments
Besides the chemical profiling of living cells according to protein expression pattern, another important application of the hybrid imaging technique is to use FPs as a guide for the chemical analysis of living cells. Here, we use the hybrid fluorescence-Raman images of histone and B4GalT1 labelled HeLa cells in Fig. 3 as example. First, about the histone-labelled HeLa cell in Fig. 3a, the averaged Raman spectra within and outside of the labelled cell nuclei in Fig. 3a can be easily extracted (Fig. 6a). For the averaged Raman spectra of the non-fluorescing compartment, the pure culture medium spectra that does not contain any cellular information are excluded to ensure we are comparing the spectral content within the cellular region. It is not difficult to see that even though cell nuclei are considered to have a significant difference in its nucleic acid content compared with cytosol, the general morphology of the nucleus spectrum is still somehow similar to the averaged spectrum of the out-of-nucleus region (Fig. 6a). The detailed chemical differences can be more easily identified by calculating the difference spectrum. By subtracting the nucleus spectrum with the out-of-nucleus spectrum (Fig. 6b), we can easily identify that the cytochrome c Raman bands (750 cm−1, 1132 cm−1, 1587 cm−1) and lipid Raman bands (1266 cm−1, 1302 cm−1, the sharp 1656 cm−1 peak, 2852 cm−1) point to the negative direction, while the protein Raman bands (1004 cm−1, the broad 1656 cm−1 band, 2950 cm−1) and nucleic acid Raman band (780 cm−1) points towards the positive direction. The result corresponds to our general understanding that cell nucleus is rich in protein and nucleic acid content, while having less cytochrome c and lipid content than the other cellular compartments.
Figure 6
(a) Compares the averaged Raman spectra in the histone-ECFP expressing region and the other cellular area in Fig. 3a. The histone-ECFP expressing region is basically equivalent to cell nuclei. Their spectral difference is shown in (b). The * mark labels the negative cytochrome c peaks, while L, P, N labels the lipid, protein and nucleic acid Raman peaks, respectively. (c) compares the averaged Raman spectra in B4GalT1-mTFP expressing region and the other cellular area in Fig. 3f. The B4GalT1-mTFP expressing region is basically equivalent to Golgi body. Their spectral difference is shown in (d). The Ls label the lipid Raman peaks that could also be identified in (b). (e) Shows the Raman spectrum of a lipid droplet in the hyperspectral dataset of Fig. 3f∼j. All spectral features seen in (d) can be seen in (e), causing the spectral difference difficult to extract by multivariate analysis means.
Next, we used the same method to analyse the chemical content of Golgi body in living cells. It is worth mentioning that no unsupervised multivariate spectral analysis is able to discriminate Golgi body from its surroundings yet. The averaged Raman spectrum of the fluorescing compartment in B4GalT1-mTFP expressing cells (Fig. 3f) and the non-fluorescing area were calculated (Fig. 6c). Again, the two spectra look highly similar to each other at the first glance. To visualise the subtle chemical difference, the difference spectrum between the Golgi body and the other compartments is calculated (Fig. 6d). The broad background in the difference spectrum most likely originates from the mTFP fluorescence tail in the Stokes region, and the wave-like structure below 1100 cm−1 is most likely due to the spectral profile of the notch filter. Such wave-like spectral pattern does not appear when the spectral difference is below 15 CCD counts (Sup. 6). Above 1100 cm−1, the spectral profile clearly shows the spectrum of lipids. The 1266 cm−1, 1302 cm−1, 1656 cm−1, and 2852 cm−1 Raman bands can all be seen in the negative spectral component in the nuclei difference spectra as well (Fig. 6b). Together with the 1440 cm−1 Raman band, these can all be assigned to lipid bands. Since the spectral difference is similar to the Raman spectrum of lipid droplets (Fig. 6e), but at a much lower contrast, it is very difficult to extract the information by multivariate analysis means. Repeat experiments show consistent lipid-like difference spectrum for Golgi body analysis, while many of them also exhibit the Raman spectral features of cytochrome c (Sup. 6). This indicates that Golgi body might also have a tendency to attach to mitochondria in HeLa cells.
— Nature Scientific Reports
#Nature Scientific Reports#Protein expression guided chemical profiling of living cells by the simul
0 notes
Last Seen Blogs

leoegolopez-blog
#TeamFood #FoodPorn #TeamiWasInThe212

xxelijahxxscottxx
Elijah Scott

mailena
mai ⟡

explore-gotland-blog
Explore Gotland

bastigod
harbinger of snos