#mcc 2.3
Photo


dream: that’s 21 thousand dollars that goes to a really good cause… and to anybody out there who has a loved one or they themselves are suffering from cancer - or have in the past, hearts out to you guys and your family and everything. It’s an amazing cause- oh god I'm about to cry *forced laughter*-- but yeah! yeah! a lot of money for a good cause.. and yeah I love you guys :)
#dreamwastaken#dreamblr#tw cancer#mcc 2.3#mcc#mygifs#vicea's#he actually is my favorite boy#dialogue
2K notes
·
View notes
Text
MCC 14 Viewer Stats
For larger images, more detailed numbers, and more info on how I did this please click here! (Google Slides)
So, what exactly did you collect?
Viewership numbers over time were the only variable collected. In total, numbers for 36 of the 37 participants streaming on twitch were included.
How as this information collected?
With a python program and twtich api! it checked for updates in viewer numbers every 10 seconds.
Hey, didn’t 40 people participate? Why only 36?
It did not occur to me that anyone would be streaming on youtube so I had nothing set up to grab those numbers :( I also mispelled katherineelizabeth’s name so she didn’t get recorded either. the admin stream was not included because i didn’t know about it (fake fan)
NOW, THE NUMBERS! :D
NOTE: Four teams were disadvantaged due to the erorr. Blue Bats (katherineelizabeth), Aqua Axolotls (solidarity), Purple Pandas (grian), and Red Rabbits (vikkstar123)
NOTE: All calculations were done with data between start and end times only.
Total MCC Viewership Over Time
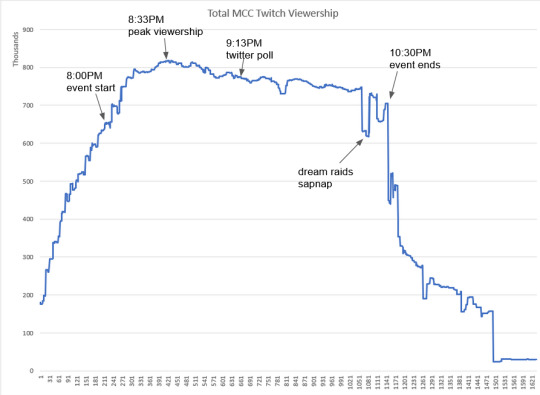
Viewership peaked at 8:33PM (BST) with 818,638 total viewers on twitch (sans the admin stream and katherineelizabeth). This was during TGTTASAWAF, the second game played. Half of participants had gone offline by 10:47PM, around 15 minutes after the MCC winners were announced. Median viewership was 767,720 and average was 758,468.86.
Viewership by Team Over Time
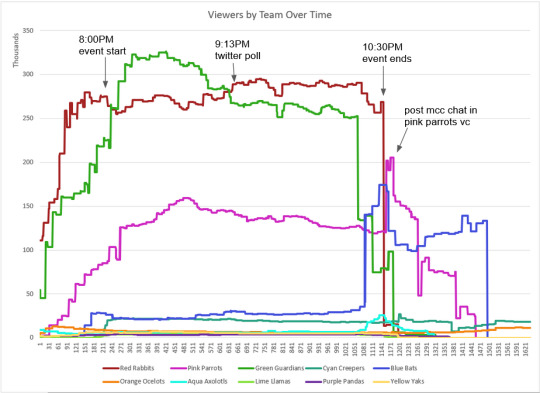
10:30PM: Tommy and Tubbo go offline at the same time resulting in major drop off for Red Rabbits. Tommy raids Wilbur, who later raids Philza. Twenty minutes to the end of the event Dream goes offline, raiding Sapnap, resulting in the large drop off for Green Guardians and the spike for Blue Bats
Viewership by Streamer Over Time

Looking at this graph is the closest I’ve gotten to understanding why Tommy said “Dream only has 100k?” RIP to the 20 or so people making up the band of color at the bottom.
Viewership Breakdown at Peak by Individual
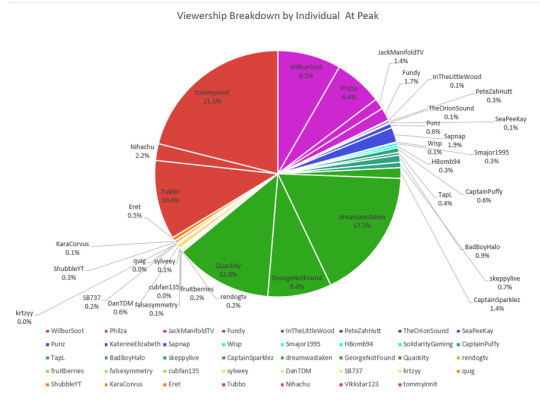
It’s neat to see who people choose to watch when a lot of their CC’s are live, which you can really see here.
Viewership Breakdown at Peak VS Survey Data
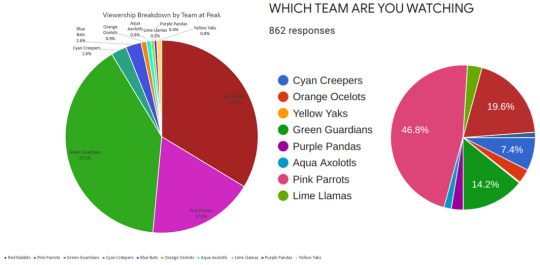
Thank you to @420technoblazeit for giving permission to reference their survey!
The differences are as follows: (in order of greatest diff. to least)
Pink Parrots: -29.0% (46.8% vs 17.8%)
Green Guardians: +25.7% (14.1% vs 39.3%)
Red Rabbits: +14.1% (19.6% vs 33.7%)
Cyan Creepers: -4.8% (7.4% vs 2.6%)
Lime Llamas: -2.7% (3.2% vs 0.5%)
Orange Ocelots: -2.2% (3.1% vs 0.9%)
Purple Pandas: -2.3% (2.7% vs 0.4%)
Blue Bats: +1.4% (1.2% vs 2.6%)
Aqua Axolotls: -0.8% (1.6% vs 0.8%)
Yellow Yaks: +0.6% (0.2% vs 0.8%)
This is really interesting! It’s solid evidence towards the observed theory that MCYT Tumblr vs MCYT Twitter is significant, especially in which CC’s they prefer.
Peak Viewership by Streamer

Top Five
1. TommyInnit: 197,770
2. DreamWasTaken: 141,855
3. Sapnap: 134,415
4. Quackity: 130,694
5. Tubbo: 93,016
Bottom Five
32. Sylveey: 663
33. KaraCorvus: 662
34. Cubfan135: 506
35. Krtzyy: 383
36. Quig: 362
See link at top for detailed list of peak numbers!
Median Viewership by Streamer
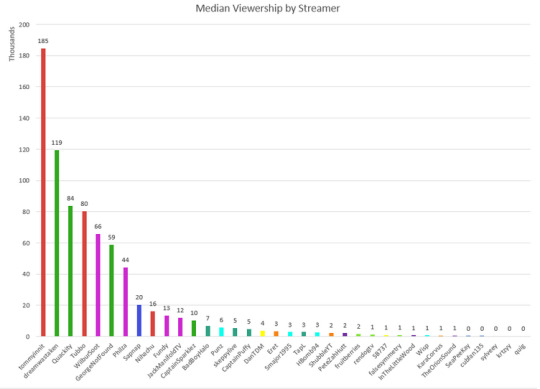
I honestly don’t know if median is a good measurement for this, but it was very similar to average viewership (only two people change position).
Thank you for reading!!
If you have any suggestions or critique please lay it on me! I am an amateur and did this entirely for fun, so I know there are probably better ways to do things. I hope to make my data collection for MCC 15 more comprehensive :]
#this took a very long time but it was worth it! glad to see it all together finally#if anyone wants the raw data i can get that for you#minecraft championships#mcc#mcc 14#minecraft#minecraft statistics#dream smp#dsmp
19 notes
·
View notes
Link
First Time Home Buyer Programs for Veterans
Numerous programs exist to help veterans and service members who are first-time buyers with their closing costs and other expenses.
Indeed, it’s perfectly possible for those who are eligible for VA home loans to become homeowners with very little — or even nothing — in the way of savings.
Check today's VA rates by completing this quick online form.
Advantages of VA home loans for first-time buyers
The most famous housing benefit associated with the VA loan program is the zero down payment requirement. That can be hugely valuable for first time home buyers.
But it’s just one of a whole range of advantages that come with a VA home loan. Here are some more.
Low mortgage rates for VA loans
According to the Ellie Mae Origination Report, in September 2020, the average rate for a 30-year, fixed-rate mortgage backed by the VA was just 2.78%. That compares with 3.02% for conventional loans (ones not backed by the government) and 3.01% for FHA loans.
So VA home loans have lower rates. And that wasn’t just a one-time fluke. VA mortgage rates are lower on average than those for other loans — month after month, year after year.
Lower funding fees for first-time buyers
When you buy a home with a VA loan, you need to pay a funding fee. However, you can choose to pay it on closing or add it to your loan so you pay it down with the rest of your mortgage.
But, as a first-time buyer, you get a lower rate. For you, it’s 2.3% of the loan amount (instead of 3.6% for repeat purchasers) if you make a down payment between zero and 5%.
That’s $2,300 for every $100,000 borrowed, which can be wrapped into the loan amount. It’s a savings of $1,300 per $100,000 versus repeat buyers.
Put down more and your funding fee drops whether or not you’re a first-time buyer. So it’s 1.65% if you put down 5% or more, and 1.4% if you put down 10% or more.
Although it might seem like just another fee, the VA funding fee is well worth the cost since it buys you the significant financial benefits of a VA home loan.
No mortgage insurance for VA loans
Mortgage insurance is what non-VA borrowers usually have to pay if they don’t have a 20 percent down payment. Private mortgage insurance typically takes the form of a payment on closing, along with monthly payments going forward.
That’s no small benefit since mortgage insurance can represent a significant amount of money. For example, FHA home buyers pay over $130 per month on a $200,000 loan — for years.
Mortgage insurance vs funding fee
Let’s do a side-by-side comparison of the mortgage insurance vs. funding fee costs of a $200,000 loan:
VA Loan FHA Loan Payable on closing $4,600* $3,500 Payable monthly $0 $133 per month** Paid after five years (60 months) $4,600 $11,500
*First-time buyer rate with zero down payment: 2.3%. $200,000 x 2.3% = $4,600
** $200,000 loan x 0.8% annual mortgage insurance = $1,600 per year. That’s $8,000 over five years. $1,600 divided by 12 months = $133.33 every month
It’s clear that mortgage insurance can be a real financial burden — and that the funding fee is a great deal for eligible borrowers.
Better yet, that makes a difference to your buying power. Because, absent mortgage insurance, you’re $133 a month better off. And that means you can afford a higher home purchase price with the same housing expenses.
Ready to buy a home? Start here.
Types of first-time homebuyer programs for VA loans
You may find two main types of assistance as a first-time buyer:
Down payment or closing cost assistance
Mortgage credit certificates
Down payment and closing cost assistance
There are thousands of down payment assistance programs (DAPs) across the United States and that includes at least one in each state. Many states have several.
Each DAP is independent and sets its own rules and offerings. So, unfortunately, we can’t say, “You’re in line to get this …” because “this” varies so much from program to program.
Some help with closing costs as well and down payments. Some give you a low-interest loan that you pay down in parallel with your main mortgage. Others give “forgivable” loans that you don’t pay back — providing you stay in the home for a set period. And some give outright grants: effectively gifts.
Mortgage credit certificates (MCCs)
The name pretty much says it all. In some states, the housing finance agency or its equivalent issues mortgage credit certificates (MCCs) to homebuyers — especially first-time ones — that let them pay less in federal taxes.
The Federal Deposit Insurance Corporation explains on its website (PDF):
“MCCs are issued directly to qualifying homebuyers who are then entitled to take a nonrefundable federal tax credit equal to a specified percentage of the interest paid on their mortgage loan each year. These tax credits can be taken at the time the borrowers file their tax returns. Alternatively, borrowers can amend their W-4 tax withholding forms from their employer to reduce the amount of federal income tax withheld from their paychecks in order to receive the benefit on a monthly basis.”
In other words, MCCs allow you to pay less federal tax. And that means you can afford a better, more expensive home than the one you could get without them.
Speak with a mortgage specialist today.
Dream Makers program
Unlike most DAPs, the Dream Makers Home Buying Assistance program from the PenFed Foundation is open only to those who’ve provided active duty, reserve, national guard, or veteran service.
You must also be a first-time buyer, although that’s defined as those who haven’t owned their own home within the previous three years. And you may qualify if you’ve lost your home to a disaster or a divorce.
But this help isn’t intended for the rich. Your income must be equal to or less than 80% of the median for the area in which you’re buying. However, that’s adjustable according to the size of your household. So if you have a spouse or dependents, you can earn more.
It’s all a bit complicated. So it’s just as well that PenFed has a lookup tool (on the US Dept. of Housing and Urban Development (HUD’s) website) that lets you discover the income limits and median family income where you want to buy.
What help does the Dream Makers program offer?
You’ll need a mortgage pre-approval or pre-qualification letter from an established lender to proceed. But then you stand to receive funds from the foundation as follows:
“The amount of the grant is determined by a 2-to-1 match of the borrower’s contribution to their mortgage in earnest deposit and cash brought at closing with a maximum grant of $5,000. The borrower must contribute a minimum of $500. No cash back can be received by the borrower at closing.”
So supposing you have $2,000 saved. The foundation could add $4,000 (2-to-1 match), giving you $6,000. In many places, that might easily be enough to see you become a homeowner.
You don’t have to use that money for a VA loan. You could opt for an FHA or conventional mortgage. But, given the advantages that come with VA loans, why would you?
The Dream Makers program is probably the most famous of those offering assistance to vets and service members. But there are plenty of others, many of which are locally based.
For example, residents of New York should check out that state’s Homes for Veterans program. That can provide up to $15,000 for those who qualify, whether or not they’re first-time buyers.
Start your home buying journey here.
State-By-State Home Buyer Assistance Programs
We promised to tell you how to find those thousands of DAPs — and the MCC programs that are available in many states.
It takes a little work to find all the ones that might be able to help you. But you should be able to track them down from the comfort of your own home, online and over the phone.
A good place to start is the HUD local homebuying programs lookup tool. Select the state where you want to buy then select a link and look for “assistance programs.”
Your best starting point is probably the state’s housing finance office though it might be called something slightly different. You should find details of programs or just a list of counties with phone numbers. Call the number where you want to buy, explain your situation and ask for advice. It’s their agents’ jobs to point you to local, state, or national programs that can help you.
If you look in the right place, you could secure some very worthwhile financial help to assist you in buying your first home.
Check today's VA rates by completing this quick online form.
https://ift.tt/3mr1lhX
2 notes
·
View notes
Text
Annular Cooler Market 2022 | Industry Size, Share, Demand And Growth Analysis Report Till 2028
The study on Annular Cooler Market with its type and application sales analysis is very essential for all the decision-makers or strategists operating in this industry. The report is made by analysts with deep industry knowledge and experience. The global, regional, and country annual sales and revenue has been studied for the historical years and estimated for the current year. With the help of analytical tools, primary interviews, and data triangulation the report is enriched with quality data. The qualitative data on the upcoming industry trends with market triggers and risks are covered as a separate section in this comprehensive report.
As understood and analyzed in the global Annular Cooler market report the growth CAGR in the year 2022 to 2028 is showing a promising inclination. The macro and microeconomic conditions are studied and forecast data is anticipated.
Click here to get a FREE Sample PDF Copy of the Annular Cooler Market Research Report @ https://www.decisiondatabases.com/contact/download-sample-59913
As per this report analysis, the Annular Cooler market is expected to show a CAGR (revenue) of xx% between the forecast years and the global market size can cross USD XX million by the end of 2028, growing from USD XX million in the year 2022. This report specifically covers the global market share (sales as well as revenue) of key companies in the Annular Cooler business, as mentioned in a separate Chapter 3.
Regionally, the Annular Cooler market data is studied under the below-mentioned regions and countries – Americas covering (United States, Canada, Mexico, Brazil), APAC covering (China, Japan, Korea, Southeast Asia, India, Australia), Europe covering (Germany, France, UK, Italy, Russia, Spain), Middle East & Africa covering (Egypt, South Africa, Israel, Turkey, and other GCC Countries).
This research study gives a comprehensive overview of market share and growth opportunities of the Annular Cooler market as per type and application. The report also covers key manufacturers’ profiles with sales and gross margin data.
The key manufacturers covered in this report: Breakdown data in Chapter 3.
Metso Outotec
JP Steel Plantech Co.
Hunan Zhongye Changtian Heavy Industry Technology Co., Ltd.
MCC North Engineering Technology Co., Ltd.
Tangshan Ruitai Machinery Co., Ltd.
Northern Heavy Industry Group Co., Ltd.
Chaoyang Heavy Machine Metallurgical Industry Co., Ltd.
Hebei Huatong Heavy Industry Machinery Manufacturing Co., Ltd.
Others
To inquire about report customization, feel free to reach out to our team of expert analysts @ https://www.decisiondatabases.com/contact/ask-questions-59913
This study considers the Annular Cooler value and volume generated from the sales of the following segments:
Segmentation by type: breakdown data from 2017 to 2022, in Section 2.3; and forecast to 2028 in section 11.7.
Sintering Annular Cooler
Pellet Annular Cooler
Segmentation by application: breakdown data from 2017 to 2022, in Section 2.4; and forecast to 2028 in section 11.8.
Sintering Work
Pellet Engineering
The latest developments of the industry and the sales channel, manufacturing process along with the manufacturing cost study is covered in the report.
Key Questions Answered –
What will be the Annular Cooler market CAGR and size between 2022-2028?
Who are the top/leading players of the Annular Cooler market?
What changes are expected in the Annular Cooler market in the next six years?
Which are the top product and leading applications of the Annular Cooler market?
What are the leading market drivers and major risks factors for the Annular Cooler market?
Which region/country leads and foresees highest growth in the next six years?
Purchase the Complete Global Annular Cooler Market Research Report @ https://www.decisiondatabases.com/contact/buy-now-59913
About Us:
DecisionDatabases.com is a global business research report provider, enriching decision makers and strategists with qualitative statistics. DecisionDatabases.com is proficient in providing syndicated research reports, customized research reports, company profiles, and industry databases across multiple domains. Our expert research analysts have been trained to map clients’ research requirements to the correct research resource leading to a distinctive edge over its competitors. We provide intellectual, precise, and meaningful data at a lightning speed.
For more details:
DecisionDatabases.com
E-Mail: [email protected]
Phone: +91-93077-28237
Website || Official Blog || Insights Analysis
0 notes
Text
Synthetic and Bio-based PMMA (Polymethyl Methacrylate) Market Insights, Forecast to 2027
Synthetic and Bio-based PMMA (Polymethyl Methacrylate) market is segmented by region (country), players, by Type, and by Application. Players, stakeholders, and other participants in the global Synthetic and Bio-based PMMA (Polymethyl Methacrylate) market will be able to gain the upper hand as they use the report as a powerful resource. The segmental analysis focuses on revenue and forecast by region (country), by Type and by Application in terms of revenue and forecast for the period 2016-2027. For Japan market, this report focuses on the Synthetic and Bio-based PMMA (Polymethyl Methacrylate) market size by players, by Type, and by Application, for the period 2016-2027. The key players include the global and local players which play important roles in Japan.
Segment by Type General PMMA Heat Resistant PMMA Impact Resistant PMMA
Download FREE Sample of this Report @
https://www.24chemicalresearch.com/download-sample/102036/global-japan-synthetic-biobased-pmma-2027-154
Segment by Application Construction Photoelectricity Lighting Transportation
By Region North America U.S. Canada Europe Germany France U.K. Italy Russia Asia-Pacific China Japan South Korea India Australia Taiwan Indonesia Thailand Malaysia Philippines Vietnam Latin America Mexico Brazil Argentina Middle East & Africa Turkey Saudi Arabia U.A.E
By Company Mitsubishi Chemical Advent International Chi Mei Arkema Sumitomo Chemical LG MMA Double Elephant Optical Material Kuraray Plaskolite Asahi Kasei PTTGM Shanghai Jingqi Zhongmeng Longxin Lotte MCC
Get the Complete Report & TOC @
https://www.24chemicalresearch.com/reports/102036/global-japan-synthetic-biobased-pmma-2027-154
Table of content
1 Study Coverage
1.1 Synthetic and Bio-based PMMA (Polymethyl Methacrylate) Product Introduction
1.2 Market by Type
1.2.1 Global Synthetic and Bio-based PMMA (Polymethyl Methacrylate) Market Size Growth Rate by Type
1.2.2 General PMMA
1.2.3 Heat Resistant PMMA
1.2.4 Impact Resistant PMMA
1.3 Market by Application
1.3.1 Global Synthetic and Bio-based PMMA (Polymethyl Methacrylate) Market Size Growth Rate by Application
1.3.2 Construction
1.3.3 Photoelectricity
1.3.4 Lighting
1.3.5 Transportation
1.4 Study Objectives
1.5 Years Considered
2 Executive Summary
2.1 Global Synthetic and Bio-based PMMA (Polymethyl Methacrylate) Market Size, Estimates and Forecasts
2.1.1 Global Synthetic and Bio-based PMMA (Polymethyl Methacrylate) Revenue 2016-2027
2.1.2 Global Synthetic and Bio-based PMMA (Polymethyl Methacrylate) Sales 2016-2027
2.2 Global Synthetic and Bio-based PMMA (Polymethyl Methacrylate), Market Size by Region: 2016 VS 2021 VS 2027
2.3 Synthetic and Bio-based PMMA (Polymethyl Methacrylate) Historical Market Size by Region (2016-2021)
2.3.1 Global Synthetic and Bio-based PMMA (Polymethyl Methacrylate) Retrospective Market Scenario in Sales by Region: 2016-2021
2.3.2 Global Synthetic and Bio-based PMMA (Polymethyl Methacrylate) Retrospective Market Scenario in Revenue by Region: 2016-2021
2.4 Synthetic and Bio-based
CONTACT US:
North Main Road Koregaon Park, Pune, India - 411001.
International: +1(646)-781-7170
Asia: +91 9169162030
Follow Us On linkedin :-
https://www.linkedin.com/company/24chemicalresearch/
0 notes
Text
Global Microcrystalline Cellulose (MCC) Market by Player, Region, Type, Application and Sales Channel 2021-2030
The global Microcrystalline Cellulose (MCC) market was valued at $XX million in 2020, and Researcher analysts predict the global market size will reach $XX million by the end of 2030, growing at a CAGR of XX% between 2021 and 2030.
Since the COVID-19 virus outbreak in December 2019, the disease has spread to all countries and territories around the world and 2 international conveyances. The global impacts of COVID-19 are already starting to be felt, and will significantly affect this industry in 2020 and 2021.
Download FREE Sample of this Report @ https://www.grandresearchstore.com/report-sample/global-microcrystalline-cellulose-2021-2030-741
This report analyses the impact of COVID-19 on this industry. COVID-19 can affect the global market in 3 ways: by directly affecting production and demand, by creating supply chain and market disruption, and by its financial impact on enterprises and financial markets.
This report provides detailed historical analysis of global market for Microcrystalline Cellulose (MCC) from 2015-2020, and provides extensive market forecasts from 2021-2030 by region/country and subsectors. It covers the sales volume, price, revenue, gross margin, historical growth and future perspectives in the Microcrystalline Cellulose (MCC) market.
Leading players of Microcrystalline Cellulose (MCC) including:
Asahi Kasei
FMC
JRS
Mingtai
Accent Microcell
Wei Ming Pharmaceutical
Juku Orchem Private Limited
BLANVER
Anhui Sunhere Pharmaceutical
Linghu Xinwang Chemical
Shandong Guangda
Huzhou Zhanwang Pharmaceutical
Jining Six Best Excipients
Aoda Pharmaceutical
QuFuShi Medical
Ahua Pharmaceutical
Qufu Tianli
Xinda biotchnology
Rutocel
Avantor Performance Materials
DFE Pharma
Foodchem International
Gujarat Microwax
JRS Pharma
Market split by Type, can be divided into:
Refined Cotton-Based MCC
Wood Pulp-Based MCC
Market split by Application, can be divided into:
Pharmaceutical
Food & Beverage
Cosmetics & Personal Care
Others
Market split by Sales Channel, can be divided into:
Direct Channel
Distribution Channel
Market segment by Region/Country including:
North America (United States, Canada and Mexico)
Europe (Germany, UK, France, Italy, Russia and Spain etc.)
Asia-Pacific (China, Japan, Korea, India, Australia and Southeast Asia etc.)
South America (Brazil, Argentina and Colombia etc.)
Middle East & Africa (South Africa, UAE and Saudi Arabia etc.)
If you have any special requirements, please let us know and we can provide you the customized report as you want.
Get the Complete Report & TOC @ https://www.grandresearchstore.com/chemicals-and-materials/global-microcrystalline-cellulose-2021-2030-741
Table of content
Table of Contents
Chapter 1 Microcrystalline Cellulose (MCC) Market Overview
1.1 Microcrystalline Cellulose (MCC) Definition
1.2 Global Microcrystalline Cellulose (MCC) Market Size Status and Outlook (2015-2030)
1.3 Global Microcrystalline Cellulose (MCC) Market Size Comparison by Region (2015-2030)
1.4 Global Microcrystalline Cellulose (MCC) Market Size Comparison by Type (2015-2030)
1.5 Global Microcrystalline Cellulose (MCC) Market Size Comparison by Application (2015-2030)
1.6 Global Microcrystalline Cellulose (MCC) Market Size Comparison by Sales Channel (2015-2030)
1.7 Microcrystalline Cellulose (MCC) Market Dynamics (COVID-19 Impacts)
1.7.1 Market Drivers/Opportunities
1.7.2 Market Challenges/Risks
1.7.3 Market News (Mergers/Acquisitions/Expansion)
1.7.4 COVID-19 Impacts on Current Market
1.7.5 Post-Strategies of COVID-19 Outbreak
Chapter 2 Microcrystalline Cellulose (MCC) Market Segment Analysis by Player
2.1 Global Microcrystalline Cellulose (MCC) Sales and Market Share by Player (2018-2020)
2.2 Global Microcrystalline Cellulose (MCC) Revenue and Market Share by Player (2018-2020)
2.3 Global Microcrystalline Cellulose (MCC) Average Price by Player (2018-2020)
2.4 Players Competition Situation & Trends
2.5 Conclusion of Segment by Player
Chapter 3 Microcrystalline Cellulose (MCC) Market Segment Analysis by Type
3.1 Global Microcrystalline Cellulose (MCC)
CONTACT US:
276 5th Avenue, New York , NY 10001,United States
International: (+1) 646 781 7170 / +91 8087042414
Email: [email protected]
Follow Us On linkedin :- https://www.linkedin.com/company/grand-research-store/
0 notes
Text
Global Technology licensing Market CAGR, Volume and Value 2020-2026
Summary – A new market study, “Global Technology licensing Market Growth (Status and Outlook) 2020-2025”has been featured on WiseGuyReports.
According to this study, over the next five years the Technology licensing market will register a xx%% CAGR in terms of revenue, the global market size will reach $ xx million by 2025, from $ xx million in 2019. In particular, this report presents the global revenue market share of key companies in Technology licensing business, shared in Chapter 3.
This report presents a comprehensive overview, market shares, and growth opportunities of Technology licensing market by product type, application, key manufacturers and key regions and countries.
This study specially analyses the impact of Covid-19 outbreak on the Technology licensing, covering the supply chain analysis, impact assessment to the Technology licensing market size growth rate in several scenarios, and the measures to be undertaken by Technology licensing companies in response to the COVID-19 epidemic.
Also Read: https://www.einpresswire.com/article/525197282/global-technology-licensing-market-2020-segmentation-demand-growth-trend-opportunity-and-forecast-to-2025
Segmentation by type: breakdown data from 2015 to 2020 in Section 2.3; and forecast to 2025 in section 10.7.
Intellectual Property Rights
Product Design
Trademark
Segmentation by application: breakdown data from 2015 to 2020, in Section 2.4; and forecast to 2025 in section 10.8.
Equipment
Chemical
Medical
Electronics
Others
Also Read: https://industrytoday.co.uk/manufacturing/jams-and-preserves-market--global-industry-analysis-and-opportunity-and-forecast-2020-to-2025
This report also splits the market by region: Breakdown data in Chapter 4, 5, 6, 7 and 8.
Americas
United States
Canada
Mexico
Brazil
APAC
China
Japan
Korea
Southeast Asia
India
Australia
Europe
Germany
France
UK
Italy
Russia
Middle East & Africa
Egypt
South Africa
Israel
Turkey
GCC Countries
The report also presents the market competition landscape and a corresponding detailed analysis of the major vendor/manufacturers in the market. The key manufacturers covered in this report: Breakdown data in in Chapter 3.
Also Read: http://www.marketwatch.com/story/global-female-fertility-and-pregnancy-rapid-test-industry-analysis-size-market-share-growth-trend-and-forecast-to-2026-2020-12-21
Chevron Phillips Chemical
Versalis
MCC
IBM
GE
Huntsman
Huawei
Qualcomm
Mitsui Chemicals
Samsung
JNC Group
Sinopec
Honeywell UOP
ExxonMobil
BASF
DuPont
Johnson Matthey
Sumitomo Chemical
Shell
LyondellBasell
Also Read: http://www.marketwatch.com/story/global-erp-solutions-industry-analysis-size-market-share-growth-trend-and-forecast-to-2025-2020-11-10
In addition, this report discusses the key drivers influencing market growth, opportunities, the challenges and the risks faced by key players and the market as a whole. It also analyzes key emerging trends and their impact on present and future development.
Research objectives
To study and analyze the global Technology licensing market size by key regions/countries, type and application, history data from 2015 to 2019, and forecast to 2025.
To understand the structure of Technology licensing market by identifying its various subsegments.
Focuses on the key global Technology licensing players, to define, describe and analyze the value, market share, market competition landscape, SWOT analysis and development plans in next few years.
To analyze the Technology licensing with respect to individual growth trends, future prospects, and their contribution to the total market.
Also Read: http://www.marketwatch.com/story/ai-in-fintech-market-2020-global-trend-segmentation-and-opportunities-forecast-to-2026-2020-10-14
To share detailed information about the key factors influencing the growth of the market (growth potential, opportunities, drivers, industry-specific challenges and risks).
To project the size of Technology licensing submarkets, with respect to key regions (along with their respective key countries).
To analyze competitive developments such as expansions, agreements, new product launches and acquisitions in the market.
To strategically profile the key players and comprehensively analyze their growth strategies.
About Us:
Wise Guy Reports is part of the Wise Guy Research Consultants Pvt. Ltd. and offers premium progressive statistical surveying, market research reports, analysis & forecast data for industries and governments around the globe.
Contact Us:
NORAH TRENT
Ph: +162-825-80070 (US)
Ph: +44 2035002763 (UK)
0 notes
Text
Global Technology licensing Market Research Report 2020-2025
Summary - A new market study, titled “Global Technology licensing Market Growth (Status and Outlook) 2020-2025” has been featured on
According to this study, over the next five years the Technology licensing market will register a xx%% CAGR in terms of revenue, the global market size will reach $ xx million by 2025, from $ xx million in 2019. In particular, this report presents the global revenue market share of key companies in Technology licensing business, shared in Chapter 3.
ALSO READ:
https://www.einpresswire.com/article/525197282/global-technology-licensing-market-2020-segmentation-demand-growth-trend-opportunity-and-forecast-to-2025
This report presents a comprehensive overview, market shares, and growth opportunities of Technology licensing market by product type, application, key manufacturers and key regions and countries.
This study specially analyses the impact of Covid-19 outbreak on the Technology licensing, covering the supply chain analysis, impact assessment to the Technology licensing market size growth rate in several scenarios, and the measures to be undertaken by Technology licensing companies in response to the COVID-19 epidemic.
Segmentation by type: breakdown data from 2015 to 2020 in Section 2.3; and forecast to 2025 in section 10.7.
Intellectual Property Rights
Product Design
Trademark
Segmentation by application: breakdown data from 2015 to 2020, in Section 2.4; and forecast to 2025 in section 10.8.
Equipment
Chemical
Medical
Electronics
Others
This report also splits the market by region: Breakdown data in Chapter 4, 5, 6, 7 and 8.
Americas
United States
Canada
Mexico
Brazil
APAC
China
Japan
Korea
Southeast Asia
India
Australia
Europe
Germany
France
UK
Italy
Russia
Middle East & Africa
Egypt
South Africa
Israel
Turkey
GCC Countries
The report also presents the market competition landscape and a corresponding detailed analysis of the major vendor/manufacturers in the market. The key manufacturers covered in this report: Breakdown data in in Chapter 3.
Chevron Phillips Chemical
Versalis
MCC
IBM
GE
Huntsman
Huawei
Qualcomm
Mitsui Chemicals
Samsung
JNC Group
Sinopec
Honeywell UOP
ExxonMobil
BASF
DuPont
Johnson Matthey
Sumitomo Chemical
Shell
LyondellBasell
In addition, this report discusses the key drivers influencing market growth, opportunities, the challenges and the risks faced by key players and the market as a whole. It also analyzes key emerging trends and their impact on present and future development.
Research objectives
To study and analyze the global Technology licensing market size by key regions/countries, type and application, history data from 2015 to 2019, and forecast to 2025.
To understand the structure of Technology licensing market by identifying its various subsegments.
Focuses on the key global Technology licensing players, to define, describe and analyze the value, market share, market competition landscape, SWOT analysis and development plans in next few years.
To analyze the Technology licensing with respect to individual growth trends, future prospects, and their contribution to the total market.
To share detailed information about the key factors influencing the growth of the market (growth potential, opportunities, drivers, industry-specific challenges and risks).
To project the size of Technology licensing submarkets, with respect to key regions (along with their respective key countries).
To analyze competitive developments such as expansions, agreements, new product launches and acquisitions in the market.
To strategically profile the key players and comprehensively analyze their growth strategies.
FOR MORE DETAILS:
https://www.wiseguyreports.com/reports/5760298-global-technology-licensing-market-growth-status-and-outlook-2020-2025
About Us:Wise Guy Reports is part of the Wise Guy Research Consultants Pvt. Ltd. and offers premium progressive statistical surveying, market research reports, analysis & forecast data for industries and governments around the globe.
Contact Us:
NORAH TRENT
Ph: +162-826-80070 (US)
Ph: +44 203 500 2763 (UK)
0 notes
Text
Bihar assembly elections to take place in 3 phases, results on November 10

The Election Commission of India on Friday declared that decisions for 243 administrative get together seats in Bihar will happen in three stages In stage 1, 71 gathering voting demographics in 16 regions will decide on 28 October. In the second stage 94 get together constituncies in 17 regions will decide on 3 November and in the last stage 78 congregations in 15 areas will decide on 7 November.
The outcomes will be announced on 10 November.
Bihar, which has a 243-part gathering, will be the primary significant state to hold races during the pandemic.
Not in excess of 1,000 citizens will be permitted at a surveying station—down from as far as possible, said the Commission when it proclaimed Covid security measures in August. Because of these rules, the quantity of surveying stalls in Bihar will cross the 100,000 imprint this time while it was 65,337 out of 2015, educated the CEC Sunil Arora. Citizens will go through temperature checks and they should wear facemasks that they need to eliminate quickly for distinguishing proof. Electors will get gloves at the hour of marking, register, and squeezing the EVM button. Surveying time has been expanded by 1 hour and will occur between 7 am and 6 pm.
More than 700,000 hand sanitiser units, about 4.6 million covers, 600,000 PPE packs, 670,000 units of faces-shields, 2.3 million (sets of) hand gloves have been organized. In excess of 72 million single-use hand gloves have been orchestrated citizens, said the CEC.
With this declaration, the Model Code of Conduct (MCC) has likewise come into power.
0 notes
Video
dream’s optimism really cut through his distraught here
#dreamwastaken#dreamblr#HIM IMMEDIATELY TRYING TO MAINTAIN HIS POSITIVE MINDSET LOL#mcc 2.3#live blogging#this reminds me of that 'two wolves inside of you' thing i made a while ago#when he was being competitive and taunting george but then immediately encouraged him bc he felt bad LUL
764 notes
·
View notes
Text
Top 5 Ultimate South African Experiences
South Africa isn’t called the rainbow nation for no reason – it is literally a melting pot of colourful cultures, interesting languages, delicious flavours and diverse experiences. There’s simply so much to see and do that it can be a bit daunting if you’re planning a visit. That’s why we’ve curated our top 5 ultimate South African experiences for you to ensure you get to experience the best our country has to offer in 2020.
4×4 Wine Tasting Experience
If you’re in Cape Town and a lover of fine wine, then the Winelands should be top of your activities list. Known the world over as some of the best value-for-money wines located in the most picturesque locations, the Winelands cannot be missed. Luckily, this doesn’t necessarily mean you need to arrange an entire day trip out to the smaller outer-lying regions of Stellenbosch and Franschhoek.
Klein Constantia, located within the Constantia Wine Valley in Cape Town, is one of the oldest wineries in the area. This scenic 146-hectare wine estate features a tasting room open year-round, and we’ve curated a special tour to give you an insider’s perspective of the wine estate’s vineyards and property on a custom-built safari-style 4×4 land cruiser.
Venture out to a beautiful lookout deck, where the tasting room manager will explain the history and heritage of the estate over a bottle of the estate MCC (local sparkling wine). After the bubbles, you’ll make your way down to the cellar and barrel room for a cellar tour and specially tutored wine tasting in ‘Dougies Dungeon’, the MCC maturation cellar specially designed for private tastings like this one. The tasting will include a sample of the world-famous Vin de Constance, known to be the sweet wine of choice for many historical figures including Napolean, Churchill and the Queen of England. At the end of the experience, there will be snacks and canapés to compliment the wine before making your way back to town.
Wine & Food
Book Tour
4×4 Wine Tasting Experience
Explore a historic Constantia wine estate by 4x4, followed by a full wine tasting and delicious canapés as you look over the breathtakingly beautiful valley below.
From / person
2 - 3 hours

Cape Peninsula Fynbos Foraging & Picnic with the Penguins
The Cape Peninsula is exceedingly beautiful and offers a window to some of the most fascinating biodiversity on the planet. From the fynbos on the mountainside to the marine life of the ocean rock pools, there is endless beauty all around you. On this unique adventure, you’ll learn about indigenous edibles as you find them in nature and learn how to forage for them in a sustainable way. Once you’ve finished foraging, you’ll end off the day by stopping at Boulder’s Beach – home to a colony of thousands of African penguins. African Penguins used to be known as jackass penguins because of their distinctive braying, and they’re the only penguins found on the continent. The penguins first came to False Bay in 1983 from Dyer Island, which is near Gansbaai. While the penguins are here all year, summer time is definitely the best time to tick this off the top 5 ultimate South African experiences list.
Rates include: Pickup and drop-off from your accommodation in and around Cape Town, private guide/driver, all entrance and activity fees as stated, foraging experience, 3 course meal with paired local wines.
Enquire Now
Sunset Sundowners on a Private Yacht
Is your out of office set? Are you ready to enter true ‘holiday mode’? Then treat yourself to something truly luxurious and special with our Private Luxury Sunset Cruise . It’s anchors away from Cape Town’s iconic Victoria and Alfred Waterfront, where the private yacht will set sail. The yacht will then head along the coast of the city, floating across the azure blue waters of the Atlantic from where you can enjoy watching the sunset along the horizon with the Cape mountains as a spectacular backdrop. You’ll be served a sundowner cocktail and delectable canapés. The 3-hour ocean excursion is the perfect complement to end off any day tour or visit to the Mother City. If you’re celebrating a special occasion, note that the cruise can accommodate up to 8 guests.
Rates include: Pickup and drop-off from your accommodation in and around Cape Town, private guide/driver, activities as stated, sundowner cocktails and canapés.
Bucket List
Book Tour
Private Luxury Sunset Cruise
Relax and enjoy unbelievable views of Cape Town from the comfort of a 12.8m luxury motor yacht.
From / person
3 Hour Private Experience
The Joburg Experience
Johannesburg, Jozi, the city of gold or ‘Egoli’: call it what you will, this city is vibrant and full of energy, brimming with exciting activities.
Rooftop Yoga in Berea with Stephen Heyman
Start your day by doing revitalising Rooftop Yoga in the suburb of Berea as a backdrop with Stephen Heyman as your instructor. Stephen is originally from Belgium and found a new home in South Africa since 2006. Until recently he was working in the corporate world, traveling around Africa to start up new offices for a Belgian supply chain company. He then decided to trade in his desk for a yoga mat to start teaching yoga to corporate companies and bring some welcome exercise and stress relief to offices in Johannesburg.
Cradle of Humankind Visit With Historian
Next up, head to the ‘Cradle of Humankind’, a World Heritage Site located about an hour outside of Johannesburg or Pretoria. This paleoanthropological site currently occupies 47,000 hectares, where the Sterkfontein Caves were the site of the discovery of a 2.3-million-year-old fossil, Australopithecus africanus (nicknamed “Mrs. Ples”), found in 1947 by Robert Broom and John T. Robinson.
Taste of Yeoville with Diana Nje
Complete a full day with an evening stroll with one of our local guides through the heart and heritage of Rockey Street in Yeoville. The walk includes some spectacular views, forgotten Victorian architecture and rich political heritage, to accompany the tasting journey. We break the meals up by including a lovely market exploration that has a predominantly West African influence.
Enquire Now
Hidden Gems Winelands Tour
Do you want to escape the crowds and go off the beaten track? Then our Hidden Gems Winelands Tour could be just the kind of breakaway you might be needing. We’ve rounded up some local speciality spots that are frequented by those in the know. Start off the day in the Stellenbosch region with a wine tasting of the hearty, historic reds of Muratie Wines. This historical, cobwebbed cellar is tucked away in the exquisite Knorhoek Valley and run as a family business under the stewardship of owner Rijk Melck. Next, you’ll head further into Stellenbosch, toward the naturally-formed amphitheatre between the Helderberg and Stellenbosch mountain ranges to visit Keermont Vineyards, a boutique wine estate known for their Syrah and their white blend, Companion. After a tasty lunch, explore the foothills of the Klein Drakenstein Mountains just outside Franschhoek with a visit to Lynx Wines – one of the smallest wine estates in the valley – to taste the reds that made the winery famous before ending off the day at the prestigious Oldenburg estate. Located in the mountains in an area known as Banghoek, this boutique winery offers Cabernet Sauvignon, Cabernet Franc, Syrah, Merlot, Chardonnay and Chenin Blanc.
Rates include: Pickup and drop-off from accommodation in and around Cape Town with private guide/driver, 4 wine tastings
Rates exclude: Lunch, additional beverages and gratuity
*Please note that because these are small production, boutique wineries this itinerary is subject to change and may include a different winery than stated based on availability.
Wine & Food
Book Tour
Hidden Gems Wine Tour
This exclusive tour will take you to the wine estates less well known, but producing some of the most sought-after wines the region has to offer.
From / person
Full Day Private Tour
If you would like to experience one of these top 5 ultimate South African experiences, speak to one of the Explore Sideways experts. We proudly curate and convene private tours for local and international visitors, and look forward to giving you a trip of a lifetime!
Planning a trip?
Want to know more or have any questions, let an Explore Sideways expert help you plan an experience you will never forget!
Speak To An Expert
.vc_custom_1543998934175{background-color: #012730 !important;}.vc_custom_1543999557705{padding-right: 50px !important;padding-left: 50px !important;}
The post Top 5 Ultimate South African Experiences appeared first on Explore Sideways.
0 notes
Text
Industrial and Institutional (I&I) Cleaning Market Growth, Size, Share, Trends and Forecast till 2024
LCD Photoresists Market report is predicted to gain better growth in coming years 2019 to 2024. This Industrial and Institutional (I&I) Cleaning market report provides extensive analysis of top-vendors, regional development, progressive trends, and countless growth statistics of Industrial and Institutional (I&I) Cleaning market. Additionally, emerging opportunities and revenue forecast (2019-2024) allows easy decision-making for all readers worldwide.

About LCD Photoresists
LCD photoresists is a large class of photoresist. Their main ingredients include resins, photosensitive agents, solvents and additives, and other components, mainly Color resist, Black Matrix Resist, Overcoat Resist, Photo Spacer and others.
Color resists
Color resists, generally known as photoresist(s), are used to form color filter layers of LCD panels consisted of red, green and blue colors, they are key materials in determining color saturation and contrast for displays.
Covered in this report
According to this study, over the next five years the LCD Photoresists market will register a 2.8% CAGR in terms of revenue, the global market size will reach US$ 1340 million by 2024, from US$ 1130 million in 2019. In particular, this report presents the global market share (sales and revenue) of key companies in LCD Photoresists business, shared in Chapter 3.
This report presents a comprehensive overview, market shares, and growth opportunities of LCD Photoresists market by product type, application, key manufacturers and key regions and countries.
This study considers the LCD Photoresists value and volume generated from the sales of the following segments:
Segmentation by product type: breakdown data from 2014 to 2019, in Section 2.3; and forecast to 2024 in section 11.7.
Color Resists(RGB)
Black Matrix(BM)
Segmentation by application: breakdown data from 2014 to 2019, in Section 2.4; and forecast to 2024 in section 11.8.
Telephone
PC
TV
Tablet
Laptop
The report also presents the market competition landscape and a corresponding detailed analysis of the major vendor/manufacturers in the market. The key manufacturers covered in this report: Breakdown data in in Chapter 3.
JSR
Toyo Ink
SUMITOMO(Dongwoo)
Chimei
MCC
NSCC
LG Chemical
DNP
Daxin
Everlight Chemical
Looking for more information on this market? Request a free sample report
Key Topics Covered:
1 Scope of the Report
2 Executive Summary
3 Global LCD Photoresists by Players
4 LCD Photoresists by Regions
5 Americas
6 APAC
7 Europe
8 Middle East & Africa
9 Market Drivers, Challenges and Trends
10 Marketing, Distributors and Customer
11 Global LCD Photoresists Market Forecast
12 Key Players Analysis
13 Research Findings and Conclusion
For more information about this report visit https://www.decisiondatabases.com/ip/40998-lcd-photoresists-market-analysis-report
About DecisionDatabases.com:
DecisionDatabases.com is a global business research reports provider, enriching decision makers and strategists with qualitative statistics. DecisionDatabases.com is proficient in providing syndicated research report, customized research reports, company profiles and industry databases across multiple domains.
Our expert research analysts have been trained to map client’s research requirements to the correct research resource leading to a distinctive edge over its competitors. We provide intellectual, precise and meaningful data at a lightning speed.
If you are interested in more information, please contact our media team at [email protected]
Contacts
DecisionDatabases.com
Phone: 9028057900
Website: http://www.decisiondatabases.com/
#Industrial and Institutional (I&I) Cleaning Market Report#Industrial and Institutional (I&I) Cleaning Industry Outlook#Industrial and Institutional (I&I) Cleaning Market Share#Industrial and Institutional (I&I) Cleaning Market Size#Industrial and Institutional (I&I) Cleaning Market Forecast#Industrial and Institutional (I&I) Cleaning Industry Sales#Industrial and Institutional (I&I) Cleaning Market Growth#Industrial and Institutional (I&I) Cleaning Market Opportunities
0 notes
Text
Global Tank Container Market Insights and Forecast to 2027
Tank Container market is segmented by Type, and by Application. Players, stakeholders, and other participants in the global Tank Container market will be able to gain the upper hand as they use the report as a powerful resource. The segmental analysis focuses on production capacity, revenue and forecast by Type and by Application for the period 2016-2027.
Download FREE Sample of this Report @ https://www.grandresearchstore.com/report-sample/global-tank-container-2027-201
Segment by Type
Reefer/Heated Tank Container
Super – Insulted Tank Container
Swap Body Tank Container
Common Tank Container
Segment by Application
Chemical Industry
Food and Berage Industry
Energy Industry
By Company
Welfit Oddy
UBH International
Suretank
Nantong CIMC
SINGAMAS (CN)
Nttank
CXIC Group
MCC TianGong (Tianjin)
Yucai Dongte
Production by Region
North America
Europe
China
Japan
Consumption by Region
North America
U.S.
Canada
Europe
Germany
France
U.K.
Italy
Russia
Asia-Pacific
China
Japan
South Korea
India
Australia
Taiwan
Indonesia
Thailand
Malaysia
Philippines
Vietnam
Latin America
Mexico
Brazil
Argentina
Middle East & Africa
Turkey
Saudi Arabia
U.A.E
Get the Complete Report & TOC @
https://www.grandresearchstore.com/machines/global-tank-container-2027-201
Table of content
1 Study Coverage
1.1 Tank Container Product Introduction
1.2 Market by Type
1.2.1 Global Tank Container Market Size Growth Rate by Type
1.2.2 Reefer/Heated Tank Container
1.2.3 Super – Insulted Tank Container
1.2.4 Swap Body Tank Container
1.2.5 Common Tank Container
1.3 Market by Application
1.3.1 Global Tank Container Market Size Growth Rate by Application
1.3.2 Chemical Industry
1.3.3 Food and Berage Industry
1.3.4 Energy Industry
1.4 Study Objectives
1.5 Years Considered
2 Global Tank Container Production
2.1 Global Tank Container Production Capacity (2016-2027)
2.2 Global Tank Container Production by Region: 2016 VS 2021 VS 2027
2.3 Global Tank Container Production by Region
2.3.1 Global Tank Container Historic Production by Region (2016-2021)
2.3.2 Global Tank Container Forecasted Production by Region (2022-2027)
2.4 North America
2.5 Europe
2.6 China
2.7 Japan
3 Global Tank Container Sales in Volume & Value Estimates and Forecasts
3.1 Global Tank Container Sales Estimates and Forecasts 2016-2027
3.2 Global Tank Container Revenue Estimates and Forecasts 2016-2027
3.3 Global Tank Container Revenue by Region: 2016 VS 2021 VS 2027
3.4 Global Top Tank Container Regions by Sales
3.4.1 Global Top Tank Container Regions by Sales (2016-2021)
3.4.2 Global Top Tank Container Regions by Sa
If You Have Any Question Related To This Report Contact Us @
https://www.grandresearchstore.com/enquire-now/global-tank-container-2027-201
CONTACT US:
276 5th Avenue, New York, NY 10001, United States
International: +1(646)-781-7170 / +91 8087042414
Email: [email protected]
0 notes
Text
Global Drug Delivery Systems Market Size and Share By Industry Demand, Worldwide Research, Prominent Players, Emerging Trends, Investment Opportunities and Revenue Expectation till 2027
The global “Drug Delivery Systems Market” is projected to reach USD 45.20 billion by 2027, exhibiting a CAGR of 6.8% during the forecast period. Increasing prevalence of multiple chronic conditions (MCCs) worldwide is expected to be the leading factor driving the growth of this market, finds Fortune Business Insights

in its report, titled “Drug Delivery Systems Market Size, Share & Industry Analysis, By Type (Inhalation, Transdermal, Injectables and Others), By Device Type (Conventional and Advanced), By Distribution Channel (Hospital Pharmacies, Retail Pharmacies, and Others) and Regional Forecast, 2020-2027”.
MCCs refer to the existence of more than one chronic condition in an individual. According to a study published by the World Economic Forum (WEF), 33% of adults around the world suffer from a combination of MCCs such as cardiovascular disease with diabetes and depression or even cancer. Precision Drug Delivery Systems can play a crucial role in managing these conditions as they are able to administer drugs at the exact location of the disease. As incidence of chronic conditions rises, the demand for these systems is likely to spike in the coming years.
Get Request a Sample Copy of the Drug Delivery Systems Report:
https://www.fortunebusinessinsights.com/enquiry/sample/drug-delivery-systems-market-103070
Major Drug Delivery Systems Market Key players covered in the report include:
Pfizer Inc.(U.S)
West Pharmaceutical Services, Inc.(U.S)
Medtronic (Ireland)
Baxter International Inc. (S)
BD (Becton, Dickinson and Company)(U.S)
Ypsomed (Switzerland)
Nemera (France)
Gerresheimer AG (Germany)
3M (S)
Drug Delivery Systems Market Analysis 2021:
Regional Analysis
North America to Hold Dominant Lead in the Market; Europe to Follow Closely
Among regions, North America is expected to dominate this market share during the forecast period owing to the active adoption of advanced drug delivery systems, especially for care of the elderly populace. Besides this, increased funding for medical R&D activities is also feeding the growth of this market. In 2019, the market size in the region was at USD 10.65 billion.
In Europe, the top growth driver is the rising prevalence of chronic diseases, coupled with the presence of large pharmaceutical companies, especially in Ireland, UK, Germany, and France. The market in Asia-Pacific is expected to be fueled by the expanding patient pool in India and China and the spreading awareness of the advantages of Drug Delivery Systems in the region.
As per the report findings, the market value was at USD 26.08 billion in 2019. The report also offers the following information:
Comprehensive analysis of the impact of COVID-19 outbreak on the market;
Detailed assessment of the market trends, drivers, and restraints;
In-depth examination of the regional dynamics and competitive environment shaping the market; and
Careful study of all the possible market segments.
Market Opportunity
Coronavirus Pandemic to Create Multiple Opportunities in the Market
The drug delivery systems market growth is set to enter an animated period on account of the exponential spread of the COVID-19 infection. With the absence of a vaccine, healthcare professionals have been forced to rely on curative measures to alleviate the suffering of COVID-19 patients. In such dire circumstances, there is growing reliance on efficient drug delivery mechanisms to provide quick treatment for the disease. Moreover, the situation has generated several innovation opportunities for companies. For instance, in May 2020, UK-based Senzer Drug Delivery Systems announced that it was working on creating inhalable targeted antivirals for COVID-19. Similar efforts are being made at the University of Texas at Austin where an innovative inhaled formulation of niclosamide is being developed to treat COVID-19 symptoms. Thus, the outbreak of the coronavirus pandemic has renewed the interest in drug delivery research and innovation.
Click here to for a more detailed short-term and long-term impact analysis of COVID-19 on this market.
Please visit: https://www.fortunebusinessinsights.com/drug-delivery-systems-market-103070
Competitive Landscape
Growing Investments in Innovation by Companies to Foster Healthy Competition
Commanding presence of large pharmaceutical and medical devices companies is emerging as the chief feature of competition in this market. These companies are making strategic investments in elevating their innovation capacities to bring out novel Drug Delivery Systems for patients and physicians.
Industry Developments:
December 2019: US-based Insulet Corporation released its flagship Omnipod DASH
Insulin Management System in the Netherlands and the UK. The novel insulin delivery device is designed to provide insulin delivery non-stop for three days, removing the need for daily injections for diabetics. It also features a touchscreen for patients to manage their condition on their own.
February 2019: Finland-domiciled Orion Corporation collaborated with Propeller Health to integrate Orion’s Easyhaler® product line with Propeller’s digital therapeutics platform. The inhaler range from Orion is designed for patients suffering from COPD and asthma. The connection between the two will be enabled by a custom-built sensor which will be synched with a mobile app.
Have Any Query? Ask Our Experts:
https://www.fortunebusinessinsights.com/enquiry/speak-to-analyst/drug-delivery-systems-market-103070
Table of Content:
1 Drug Delivery Systems Market Overview
1.1 Drug Delivery Systems Product Overview
1.2 Drug Delivery Systems Market Segment by Type
1.3 Global Drug Delivery Systems Market Size by Type (2015-2027)
1.3.1 Global Drug Delivery Systems Market Size Overview by Type (2015-2027)
1.3.2 Global Drug Delivery Systems Historic Market Size Review by Type (2015-2021)
1.3.2.1 Global Drug Delivery Systems Sales Market Share Breakdown by Type (2015-2027)
1.3.2.2 Global Drug Delivery Systems Market Share Breakdown by Type (2015-2027)
1.3.2.3 Global Drug Delivery Systems Average Selling Price (ASP) by Type (2015-2027)
1.3.3 Global Drug Delivery Systems Market Size Forecast by Type (2021-2027)
1.3.3.1 Global Drug Delivery Systems Sales Market Share Breakdown by Application (2021-2027)
1.3.3.2 Global Drug Delivery Systems Revenue Market Share Breakdown by Application (2021-2027)
1.3.3.3 Global Drug Delivery Systems Average Selling Price (ASP) by Application (2021-2027)
1.4 Key Regions Market Size Segment by Type (2015-2021)
1.4.1 North America Drug Delivery Systems Sales Breakdown by Type (2015-2027)
1.4.2 Europe Drug Delivery Systems Sales Breakdown by Type (2015-2027)
1.4.3 Asia-Pacific Drug Delivery Systems Sales Breakdown by Type (2015-2027)
1.4.4 Latin America Drug Delivery Systems Sales Breakdown by Type (2015-2027)
1.4.5 Middle East and Africa Drug Delivery Systems Sales Breakdown by Type (2015-2027)
2 Global Drug Delivery Systems Market Competition by Company
2.1 Global Top Players by Drug Delivery Systems Sales (2015-2021)
2.2 Global Top Players by Drug Delivery Systems Revenue (2015-2021)
2.3 Global Top Players Drug Delivery Systems Average Selling Price (ASP) (2015-2021)
2.4 Global Top Company Drug Delivery Systems Manufacturing Base Distribution, Sales Area, Product Type
2.5 Drug Delivery Systems Market Competitive Situation and Trends
2.5.1 Drug Delivery Systems Market Growth Rate (2015-2021)
2.5.2 Global 5 and 10 Largest Company by Drug Delivery Systems Sales and Revenue in 2019
2.6 Global Top Company by Company Type (Tier 1, Tier 2 and Tier 3) (based on the Revenue in Drug Delivery Systems as of 2019)
2.7 Date of Key Company Enter into Drug Delivery Systems Market
2.8 Key Company Drug Delivery Systems Product Offered
2.9 Mergers and Acquisitions, Expansion
3 Global Drug Delivery Systems Status and Outlook by Region (2015-2027)
3.1 Global Drug Delivery Systems Market Size and CAGR by Region: 2015 VS 2021 VS 2027
3.2 Global Drug Delivery Systems Market Size Market Share by Region (2015-2021)
3.2.1 Global Drug Delivery Systems Sales Market Share by Region (2015-2021)
3.2.2 Global Drug Delivery Systems Revenue Market Share by Region (2015-2021)
3.2.3 Global Drug Delivery Systems Sales, Revenue, Price and Gross Margin (2015-2021)
3.3 Global Drug Delivery Systems Market Size Market Share by Region (2021-2027)
3.3.1 Global Drug Delivery Systems Sales Market Share by Region (2021-2027)
3.3.2 Global Drug Delivery Systems Revenue Market Share by Region (2021-2027)
3.3.3 Global Drug Delivery Systems Sales, Revenue, Price and Gross Margin (2021-2027)
3.4 North America Drug Delivery Systems Market Size By Growth (2015-2027)
3.4.1 North America Drug Delivery Systems Revenue By Growth (2015-2027)
3.4.2 North America Drug Delivery Systems Sales By Growth (2015-2027)
3.5 Asia-Pacific Drug Delivery Systems Market Size By Growth (2015-2027)
3.5.1 Asia-Pacific Drug Delivery Systems Revenue By Growth (2015-2027)
3.5.2 Asia-Pacific Drug Delivery Systems Sales By Growth (2015-2027)
3.6 Europe Drug Delivery Systems Market Size By Growth (2015-2027)
3.6.1 Europe Drug Delivery Systems Revenue By Growth (2015-2027)
3.6.2 Europe Drug Delivery Systems Sales By Growth (2015-2027)
3.7 Latin America Drug Delivery Systems Market Size By Growth (2015-2027)
3.7.1 Latin America Drug Delivery Systems Revenue By Growth (2015-2027)
3.7.2 Latin America Drug Delivery Systems Sales By Growth (2015-2027)
3.8 Middle East and Africa Drug Delivery Systems Market Size By Growth (2015-2027)
3.8.1 Middle East and Africa Drug Delivery Systems Revenue By Growth (2015-2027)
3.8.2 Middle East and Africa Drug Delivery Systems Sales By Growth (2015-2027)
4 Global Drug Delivery Systems by Application
4.1 Drug Delivery Systems Segment by Application
4.1.1 Residential
4.1.2 Commercial
4.2 Global Drug Delivery Systems Sales by Application: 2015 VS 2021 VS 2027
4.3 Global Drug Delivery Systems Historic Sales by Application (2015-2021)
4.4 Global Drug Delivery Systems Forecasted Sales by Application (2021-2027)
4.5 Key Regions Drug Delivery Systems Market Size by Application
4.5.1 North America Drug Delivery Systems by Application
4.5.2 Europe Drug Delivery Systems by Application
4.5.3 Asia-Pacific Drug Delivery Systems by Application
4.5.4 Latin America Drug Delivery Systems by Application
4.5.5 Middle East and Africa Drug Delivery Systems by Application
5 North America Drug Delivery Systems Market Size by Country (2015-2027)
5.1 North America Market Size Market Share by Country (2015-2021)
5.1.1 North America Drug Delivery Systems Sales Market Share by Country (2015-2021)
5.1.2 North America Drug Delivery Systems Revenue Market Share by Country (2015-2021)
5.2 North America Market Size Market Share by Country (2021-2027)
5.2.1 North America Drug Delivery Systems Sales Market Share by Country (2021-2027)
5.2.2 North America Drug Delivery Systems Revenue Market Share by Country (2021-2027)
5.3 North America Market Size By Growth by Country
5.3.1 U.S. Drug Delivery Systems Market Size By Growth (2015-2027)
5.3.2 Canada Drug Delivery Systems Market Size By Growth (2015-2027)
6 Europe Drug Delivery Systems Market Size by Country (2015-2027)
6.1 Europe Market Size Market Share by Country (2015-2021)
6.1.1 Europe Drug Delivery Systems Sales Market Share by Country (2015-2021)
6.1.2 Europe Drug Delivery Systems Revenue Market Share by Country (2015-2021)
6.2 Europe Market Size Market Share by Country (2021-2027)
6.2.1 Europe Drug Delivery Systems Sales Market Share by Country (2021-2027)
6.2.2 Europe Drug Delivery Systems Revenue Market Share by Country (2021-2027)
6.3 Europe Market Size By Growth by Country
6.3.1 Germany Drug Delivery Systems Market Size By Growth (2015-2027)
6.3.2 France Drug Delivery Systems Market Size By Growth (2015-2027)
6.3.3 U.K. Drug Delivery Systems Market Size By Growth (2015-2027)
6.3.4 Italy Drug Delivery Systems Market Size By Growth (2015-2027)
6.3.5 Russia Drug Delivery Systems Market Size By Growth (2015-2027)
7 Asia-Pacific Drug Delivery Systems Market Size by Country (2015-2027)
7.1 Asia-Pacific Market Size Market Share by Country (2015-2021)
7.1.1 Asia-Pacific Drug Delivery Systems Sales Market Share by Country (2015-2021)
7.1.2 Asia-Pacific Drug Delivery Systems Revenue Market Share by Country (2015-2021)
7.2 Asia-Pacific Market Size Market Share by Country (2021-2027)
7.2.1 Asia-Pacific Drug Delivery Systems Sales Market Share by Country (2021-2027)
7.2.2 Asia-Pacific Drug Delivery Systems Revenue Market Share by Country (2021-2027)
7.3 Asia-Pacific Market Size By Growth by Country
7.3.1 China Drug Delivery Systems Market Size By Growth (2015-2027)
7.3.2 Japan Drug Delivery Systems Market Size By Growth (2015-2027)
7.3.3 South Korea Drug Delivery Systems Market Size By Growth (2015-2027)
7.3.4 India Drug Delivery Systems Market Size By Growth (2015-2027)
7.3.5 Australia Drug Delivery Systems Market Size By Growth (2015-2027)
7.3.6 Taiwan Drug Delivery Systems Market Size By Growth (2015-2027)
7.3.7 Indonesia Drug Delivery Systems Market Size By Growth (2015-2027)
7.3.8 Thailand Drug Delivery Systems Market Size By Growth (2015-2027)
7.3.9 Malaysia Drug Delivery Systems Market Size By Growth (2015-2027)
7.3.10 Philippines Drug Delivery Systems Market Size By Growth (2015-2027)
Continue…
About Us:
Fortune Business Insights
offers expert corporate analysis and accurate data, helping organizations of all sizes make timely decisions. We tailor innovative solutions for our clients, assisting them to address challenges distinct to their businesses. Our goal is to empower our clients with holistic market intelligence, giving a granular overview of the market they are operating in.
Our reports contain a unique mix of tangible insights and qualitative analysis to help companies achieve sustainable growth. Our team of experienced analysts and consultants use industry-leading research tools and techniques to compile comprehensive market studies, interspersed with relevant data.
At Fortune Business Insights
, we aim at highlighting the most lucrative growth opportunities for our clients. We, therefore, offer recommendations, making it easier for them to navigate through technological and market-related changes. Our consulting services are designed to help organizations identify hidden opportunities and understand prevailing competitive challenges.
Contact Us:
Fortune Business Insights Pvt. Ltd.
308, Supreme Headquarters,
Survey No. 36, Baner,
Pune-Bangalore Highway,
Pune -411045, Maharashtra, India.
US: +1 424 253 0390
UK: +44 2071 939123
APAC: +91 744 740 1245
Related Reports :
N95 Grade Medical Protective Masks Market
N95 Grade Medical Protective Masks Market Size
N95 Grade Medical Protective Masks Market Share
N95 Grade Medical Protective Masks Market Trends
N95 Grade Medical Protective Masks Market Growth
N95 Grade Medical Protective Masks Market Analysis
N95 Grade Medical Protective Masks Market Business Opportunities
N95 Grade Medical Protective Masks Market Key Players
N95 Grade Medical Protective Masks Market Demand
N95 Grade Medical Protective Masks Market Competitive Landscape
N95 Grade Medical Protective Masks Market Segments
N95 Grade Medical Protective Masks Market Overview
N95 Grade Medical Protective Masks Industry
N95 Grade Medical Protective Masks Market Stastistic
N95 Grade Medical Protective Masks Market Devlopment Strategy
N95 Grade Medical Protective Masks Market Future Growth
N95 Grade Medical Protective Masks Market Research Methodology
N95 Grade Medical Protective Masks Market Drivers
N95 Grade Medical Protective Masks Market Manufacturers
N95 Grade Medical Protective Masks Market Revenue
N95 Grade Medical Protective Masks Market Growth Analysis
N95 Grade Medical Protective Masks Market Search Analysis
N95 Grade Medical Protective Masks Market Condition
N95 Grade Medical Protective Masks Market Covid Effect
N95 Grade Medical Protective Masks Market CAGR Value
N95 Grade Medical Protective Masks Market Updates
from NeighborWebSJ https://ift.tt/34LMesJ
via IFTTT
from WordPress https://ift.tt/2TsPWoz
via IFTTT
0 notes
Text
Global Technology licensing Market Audience, Geographies and Key Players 2020-2026
Summary – A new market study, “Global Technology licensing Market Growth (Status and Outlook) 2020-2025”has been featured on WiseGuyReports.
According to this study, over the next five years the Technology licensing market will register a xx%% CAGR in terms of revenue, the global market size will reach $ xx million by 2025, from $ xx million in 2019. In particular, this report presents the global revenue market share of key companies in Technology licensing business, shared in Chapter 3.
Also Read: https://www.einpresswire.com/article/525197282/global-technology-licensing-market-2020-segmentation-demand-growth-trend-opportunity-and-forecast-to-2025
This report presents a comprehensive overview, market shares, and growth opportunities of Technology licensing market by product type, application, key manufacturers and key regions and countries.
This study specially analyses the impact of Covid-19 outbreak on the Technology licensing, covering the supply chain analysis, impact assessment to the Technology licensing market size growth rate in several scenarios, and the measures to be undertaken by Technology licensing companies in response to the COVID-19 epidemic.
Also Read: https://industrytoday.co.uk/manufacturing/jams-and-preserves-market--global-industry-analysis-and-opportunity-and-forecast-2020-to-2025
Segmentation by type: breakdown data from 2015 to 2020 in Section 2.3; and forecast to 2025 in section 10.7.
Intellectual Property Rights
Product Design
Trademark
Also Read: http://www.marketwatch.com/story/global-female-fertility-and-pregnancy-rapid-test-industry-analysis-size-market-share-growth-trend-and-forecast-to-2026-2020-12-21
Segmentation by application: breakdown data from 2015 to 2020, in Section 2.4; and forecast to 2025 in section 10.8.
Equipment
Chemical
Medical
Electronics
Others
Also Read: http://www.marketwatch.com/story/global-erp-solutions-industry-analysis-size-market-share-growth-trend-and-forecast-to-2025-2020-11-10
This report also splits the market by region: Breakdown data in Chapter 4, 5, 6, 7 and 8.
Americas
United States
Canada
Mexico
Brazil
APAC
China
Japan
Korea
Southeast Asia
India
Australia
Europe
Germany
France
UK
Italy
Russia
Middle East & Africa
Egypt
South Africa
Israel
Turkey
GCC Countries
Also Read: http://www.marketwatch.com/story/ai-in-fintech-market-2020-global-trend-segmentation-and-opportunities-forecast-to-2026-2020-10-14
The report also presents the market competition landscape and a corresponding detailed analysis of the major vendor/manufacturers in the market. The key manufacturers covered in this report: Breakdown data in in Chapter 3.
Chevron Phillips Chemical
Versalis
MCC
IBM
GE
Huntsman
Huawei
Qualcomm
Mitsui Chemicals
Samsung
JNC Group
Sinopec
Honeywell UOP
ExxonMobil
BASF
DuPont
Johnson Matthey
Sumitomo Chemical
Shell
LyondellBasell
In addition, this report discusses the key drivers influencing market growth, opportunities, the challenges and the risks faced by key players and the market as a whole. It also analyzes key emerging trends and their impact on present and future development.
Research objectives
To study and analyze the global Technology licensing market size by key regions/countries, type and application, history data from 2015 to 2019, and forecast to 2025.
To understand the structure of Technology licensing market by identifying its various subsegments.
Focuses on the key global Technology licensing players, to define, describe and analyze the value, market share, market competition landscape, SWOT analysis and development plans in next few years.
To analyze the Technology licensing with respect to individual growth trends, future prospects, and their contribution to the total market.
To share detailed information about the key factors influencing the growth of the market (growth potential, opportunities, drivers, industry-specific challenges and risks).
To project the size of Technology licensing submarkets, with respect to key regions (along with their respective key countries).
To analyze competitive developments such as expansions, agreements, new product launches and acquisitions in the market.
To strategically profile the key players and comprehensively analyze their growth strategies.
About Us:
Wise Guy Reports is part of the Wise Guy Research Consultants Pvt. Ltd. and offers premium progressive statistical surveying, market research reports, analysis & forecast data for industries and governments around the globe.
Contact Us:
NORAH TRENT
Ph: +162-825-80070 (US)
Ph: +44 2035002763 (UK)
0 notes
Last Seen Blogs

wodbrew
World of Darkness Memes, Meta, & Homebrew

torogao
My Fetishes Are Better Than Yours.

stupendousdeputyvoidparty
Untitled

mohammedmerriam-blog
Essential Natual Skin Care Tips For Travel

kayal01
Untitled