
matallo
Carlos Matallín
I'm a 28 year old geek from Valencia living in Madrid. I'm a web enthusiast, passionate about technology and design. I climb mountains, too.Currently I work as Front-end engineer at CARTO.Follow me @matallo
833 posts
Don't wanna be here? Send us removal request.
Last Seen Blogs

white-people-shit
🏳️🌈Fuck 12🏳️🌈

saanvii
Saanvii

paysage-de-nos-langues
Paysage de nos langues

eclecticlawyerauthorpsychic
Daddy lover

falsewolf2109
•LuLS
Photo
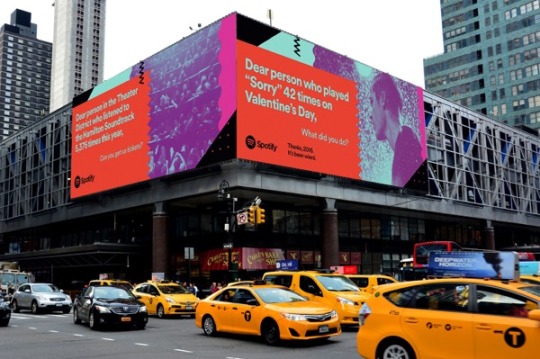
Thanks 2016, it's been weird. (via @jgarranz)
8 notes
·
View notes

Photo

Illustrated Cross-Sections of Major Train Stations in Tokyo by Tomoyuki Tanaka (via @fdans)
2 notes
·
View notes
Photo

Vietnam Map (via Visual Design and Composition Lessons from 30 Beautiful Maps)
1 note
·
View note

Photo

Ordnance Survey Mars map (via Ordnance Survey)
1 note
·
View note

Photo

Fascinating Relief Maps Show The World's Mountain Ranges
1 note
·
View note
Text
For several reasons this is the best thing you can read on a lazy Saturday morning.
Let me paint you a word-picture. It’s 11pm, I’m listening to the soundtrack to The Social Network (ironically? meta-ironically? I don’t even know), I have six terminals tiled across two screens as well as fifty thousand browser tabs open and I’m up to my third graphing library.
I mean, I could be that guy. The Social Network soundtrack, check. Terminals, check. Browser tabs, check.
That whole “Inspect Element” and “Copy as cURL”, then code a Python script to write some logs and make a visualization, check. Well, I'm using Ruby instead.
This friend recommended nvd3.js, presumably because you’re not making real graphs in 2016 unless your graphing library is something.js and requires at LEAST one other something else.js as a dependency. Everyone looks at you like “what, you DON’T already use something else.js? Jeez say goodbye to your Hacker News karma. Just apt-get install npm && npm install bower && bower install-” NO STOP IT THIS ISN’T WHAT TIM BERNERS-LEE WANTED”.
Here I literally died (not literally).
BRB, I have a script running.
Graphing when your Facebook friends are awake
Look I’m not really sure why but I think I made a thing that makes graphs of when people are online on Facebook. It sounds kinda creepy and uh it is. Read along so you, too, can be the NSA. ˙ ͜ʟ˙

Little green dots
You know those green dots on the sidebar on Facebook that tell you who’s online? How do they get there? Also there are times next to people who are offline. What are those about?
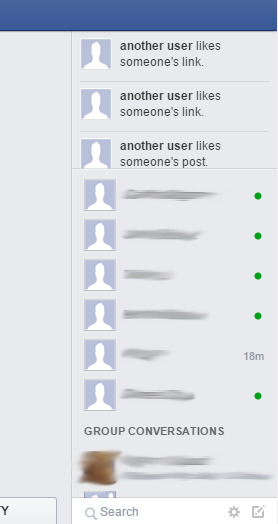
I was wondering the same things, and so one day I decided to 360 noscope hack Facebook by right clicking and selecting “Inspect Element”.
I’M IN
We did it team. Anyway alright uhhhh let’s just uh snoop around here reallllll sneaky like
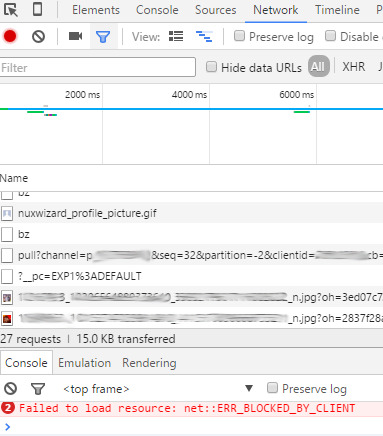
If you reload the page you’ll see approximately fifty-bajillion network requests go off as Facebook desperately tries to load all the junk that it needs to display facebook.com.
You might be wondering at this point why I decided to look for interesting things in this mess instead of, I dunno, getting out more, getting a cat, that sorta thing. Anyway hey look a heading
Finding the good stuff
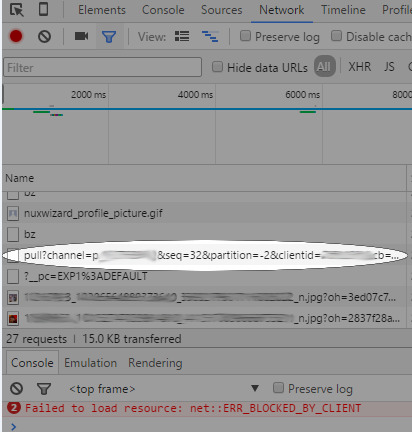
What’s this “pull” thing?
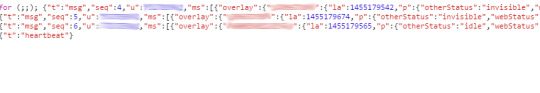
THAT looks like some #datascience right there. This is the kind of 100% legit secret undocumented “API” that we came here for. Let’s do some reverse-engineering.
It looks like a mapping of Facebook user ids to… their online status? But there’s more than one value? “webStatus” and “fbAppStatus” are both there. What’s more, it tells you what the person is doing on each of the different kinds of statuses.
For example:
“messengerStatus” : “invisible” means they’re not online on the Facebook Messenger app.
“webStatus”: “idle” means their web browser is logged in to Facebook, and has the page open, but they aren’t doing anything on the site like moving their mouse or talking to anyone.
Since we have both of these at the same time, we can tell that this person is likely not using their phone, and that they were using facebook.com recently, but not right now.
That’s already a little creepy that we can tell that about people. But can we do more with this?
You might also notice that there is a value called “la” that is a big integer that starts with “14″. If you I dunno, didn’t have a lot of friends in high school, you might recognise that as a UNIX time stamp - the time in seconds since midnight, January 1, 1970.
Computer Scientists thought this would be a good time to start measuring the time from because the first app was born at midnight, January 1, 1970. The app was a custom emoji pack for an ancient model of phone that would one day evolve to become the first Blackberry.
If you’re wondering why the response starts with “for (;;);”, it’s to, among other things, encourage developers to use a quality JSON decoder, instead of like, y’know, eval().
Anyway that “la” thing stands for “last active”, and tells you the last time the person was active on Facebook, down to the second. Do you see where I’m going with this?
Roleplaying as the NSA ˙ ͜ʟ˙
So far we have a whole bunch of things which look like this
A person
A time
Whether they’re online or offline or idle
Which devices they’re online/offline/idle on
This doesn’t seem that interesting at first, since you already know who is online by looking at the sidebar. But what if there was someone always watching the little green dots?
Using the power of computers, you can just write a Python program to listen to what the /pull requests are saying all the time ever, and write it down.
Here’s a screenshot of all the log files I’ve got:
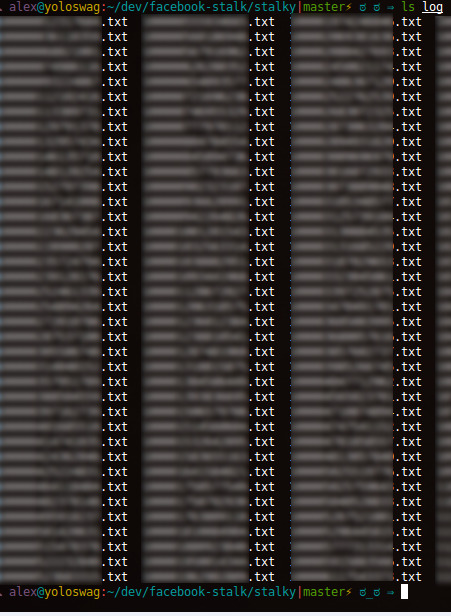
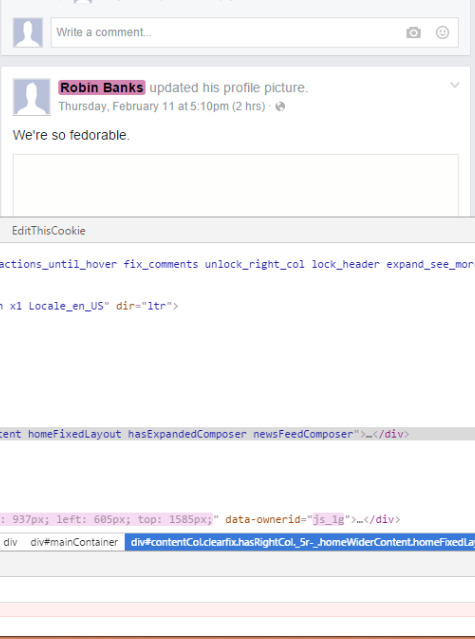
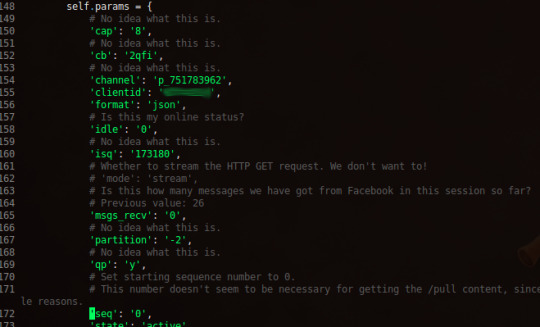
And here’s what an individual log file looks like (the first 10 lines):
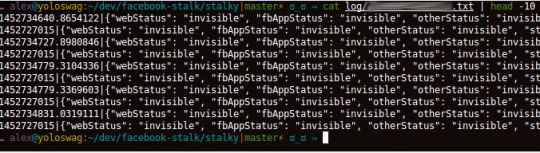
Those blurred out things are Facebook user ids. If you think these screenshots look a little bit creepy then YEAH I KNOW RIGHT.
Tell me about your program then you massive nerd
It runs 24/7, and it’s constantly logging online/offline activity data from those /pull URLs using my Facebook cookie.
Writing it was mostly about saying “jeez, all these parameters look complicated” and then blindly copy/pasting them anyway.
Protip, you can right click on any network request in Chrome’s Developer Tools and click “Copy as cURL”. This is amazing and lets you re-run a request from the terminal, as well as give you all the headers and cookies used to run that request in a nice copy-pasteable format.
The first step was to just run that request verbatim in a terminal with curl.
curl ‘https://1-edge-chat.facebook.com/pull?channel=p_751783962&seq=3&partition=-2&clientid=[redacted]&cb=6dcn&idle=5&qp=y&cap=8&tur=1545&qpmade=1455427171900&pws=fresh&isq=221841&msgs_recv=3&uid=[redacted]&viewer_uid=[redacted]&sticky_token=239&sticky_pool=atn2c06_chat-proxy&state=active’ -H 'origin: https://www.facebook.com’ -H 'dnt: 1’ -H 'accept-encoding: gzip, deflate, sdch’ -H 'accept-language: en-US,en;q=0.8,en-AU;q=0.6’ -H 'user-agent: ‘[redacted]’ -H 'accept: */*’ -H 'referer: https://www.facebook.com/’ -H 'authority: 1-edge-chat.facebook.com’ -H 'cookie: ‘[redacted]’ –compressed
I was expecting it to not work because it looks like it has some sequence numbers in it oh boy BUT it turned out to just take a really long time. I later found out this was because the /pull endpoint is using HTTP Long Polling, which turns out to be like a streaming HTTP GET request.
The only other important parameter to worry about is “seq”, which I’m guessing is the sequence number of the response from Facebook. Just add 1 to the sequence number that the response from /pull gives for the next request and you’re good to go.
If you’re worrying about remembering all this, chill out I got yo’ back, my 100% Terms of Service Compliant implementation of this is available here on GitHub. Standard disclaimers of “I’m so sorry I wrote parts of this in like 30 minutes” apply.
One caveat of the data-collection program that I’ve noticed is that it has false negatives. That is, sometimes it won’t give you a “this person is online” data point, even though they really are online. I guess that gives plausible deniability of…. being offline?
You should probably get out more
[worried laughter]
So that’s the hard part done, right?
Let me paint you a word-picture. It’s 11pm, I’m listening to the soundtrack to The Social Network (ironically? meta-ironically? I don’t even know), I have six terminals tiled across two screens as well as fifty thousand browser tabs open and I’m up to my third graphing library.
Making graphs is really hard.
I used matplotlib, but I realised this wasn’t my thesis and I wouldn’t be embedding this ugly graph as a pdf into a LaTeX document that takes 3 passes of pdflatex to render because there’s been a terrible but extremely localised accident where only humanity’s LaTeX to pdf converters have been irreversibly sent back in time to the 80s.
I used bokeh, which claims to be a “matplotlib-killer”, and it was was okay until a friend told me “it isn’t the 90s anymore, you don’t generate graphs server-side. Also your graphs are ugly and you should feel ugly you utter fraud”.
This friend recommended nvd3.js, presumably because you’re not making real graphs in 2016 unless your graphing library is <something>.js and requires at LEAST one other <something else>.js as a dependency. Everyone looks at you like “what, you DON’T already use <something else>.js? Jeez say goodbye to your Hacker News karma. Just apt-get install npm && npm install bower && bower install-” NO STOP IT THIS ISN’T WHAT TIM BERNERS-LEE WANTED”.
I think it took about three times as much time to graph the data as it took to write the code to download it. And the graphs aren’t even good! I gave up on perfecting the graphs so I could just hurry up and write this questionable blog post already. Just think of me resolving pip3 dependencies when you see the ugly graphs.
(°ロ°)☝ AND ANOTHER THING when it’s midnight and your x-axis formatting function doesn’t convert UNIX times into JavaScript date objects properly because there’s no timezone information and I dunno JavaScript was written by some guy in two weeks (yeah I ain’t afraid to call it out what of it) and your binary-search based conversion of sparse timeseries data into uniformly dense timeseries data is causing so many data points to be graphed that it’s slowly crashing Chrome and you’re watching helplessly as your RAM goes up and Chrome won’t close the tab and it just doesn’t seem right that 2016, the year of the Linux Desktop has brought us this situation I mean I thought if you had enough <something>.js libraries this stuff was meant to just scale right up so tha-
Quit stalling with graphing libraries and show me the graphs
Fine but you’re missing out on top-quality graphing-related banter.
The graphs in this section are all of the online/offline activity of some of my Facebook friends.They consented to it being on this blog post on the condition that it’s anonymous.
Person 1

Here’s someone’s graph. The x-axis is time, and the y-axis is how online the user is. Possible states for someone’s status are “offline”, “invisible”, “idle”, and “active”. Each coloured line is a different kind of client. It’s called a client because I don’t know I’m an Information Visualisation Professional and I get to make up words like that. Here are explanations for what each of the “coloured lines” means
status - Not sure what this is. Some kind of client-agnostic status? It doesn’t line up exactly with the activity of the other clients though
webStatus - Chat activity on facebook.com
messengerStatus - Status on the Messenger mobile app
fbAppStatus - Status on the Facebook mobile app
otherStatus - Presumably shows when people are online on other apps that can access the API that causes them to be considered “online”. OAuth? Random “apps” like Farmville? No idea
Here’s the same graph, with some clumsy drawings on it showing when I think this person is awake/asleep.
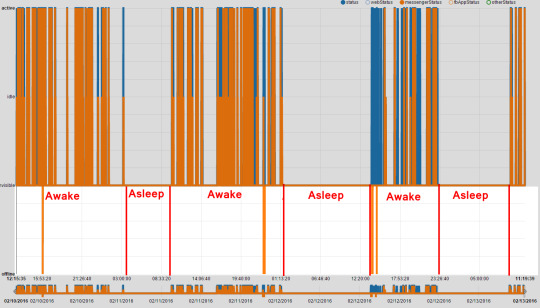
You can see the amount of rest they’re getting each day - it’s the width of the “asleep” bit.
You can also see that they were probably asleep from 3am to 10am on February 11, and BOY does it feel creepy writing this.
Of course, this isn’t perfect, since they might be awake and not using Facebook (I know). Having spoken to a few people who were graphed, it’s been a fairly accurate measure of awake/asleep time, as well as “how much do you browse Facebook at work” time ;)
Do you look at Facebook shortly after you wake up? Shortly before you sleep? If so, these graphs are a fairly accurate way to measure when you were asleep, and anyone you’re friends with on Facebook can do it.
Person 2

I showed this person their graph and asked them some questions.
“Did you go to sleep around 11:10pm last night?”
They said yes.
“Did you wake up around 8:32? That’s a weird time. Was your alarm set for 8:30?”
They said yes.
NSA APPROVED ✔️ 🆗👌👌 👍✔️👌🆗🆗👍
Person 3

There are two interesting things about this graph
The person isn’t online as frequently as the previous examples
The person isn’t using the Messenger app nearly as much
You can see that their webStatus was “online” on and off from midnight til around 2am, and then again at 10:21am.. I’m not sure if this spiky pattern means that they really were online, then offline, then online again, or if it’s just a quirk of the dodgy undocumented “API” I’m using, or even if it’s just a problem with my code.
Similarly, I’m not sure why there are these weird spikes every three minutes (+- ~1minute) sometimes.
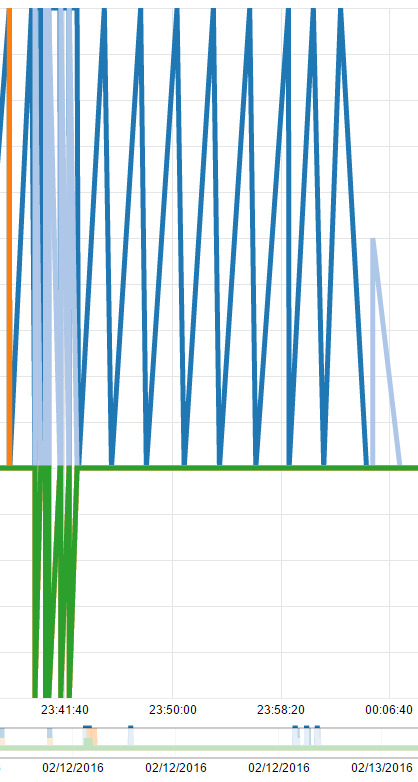
Also, why does “otherStatus” go to offline precisely when “webStatus” goes to online? So many questions! Let me know if you know the answers to any of these things (@Facebook employee friends ;) ;) ;))
Anyway, I hope I’ve convinced you that this is real creepy. I don’t really want to be able to have the power to do this.
Your dumb graph screenshots are too small. Give me a live graph to play with
You got it, boss. Click here. Or anywhere, really. This whole sentence is a link.
What else can you do with this data?
You can aggregate. Finding the average wake up time/sleep time/time spent on Facebook each day and then looking for outliers sure sounds like a way to find interesting things about your Facebook friends.
You can write a thing to email you every morning with the names and sleep times of everyone who’s had less than 6 hours of sleep.
You could even try and guess when your friends are talking to each other, by looking for times when only a few people are active, although I suspect this would be hard.
I’m sure you can come up with something else, too.
Why can you do this? Can’t Facebook stop this from happening?
That’s a good question, thanks for asking.
It makes sense for Facebook to be able to do this, since they can tell when everyone is online anyway. But why can your Facebook friends do this to you?
I don’t know all the details of how facebook.com uses all the data that’s sent via the /pull endpoint, but it’s kinda creepy that I can see my friends’ status on every device? I guess they could just give me “web” or “mobile” or “offline”, rather than the full list of statuses for every client, but even that doesn’t solve the problem.
I also see the value in seeing “last active 4h ago” and “last active 1m ago” for Messenger contacts but…. I dunno, here I am making these creepy graphs.
Anyway, I just open-sourced my dodgy graph making thing so now everyone can do this. And who knows how many people have been doing it already?
I’m probably oversimplifying it, though. The smart people at Facebook who write this stuff have probably thought of all of this and found that this way was best.
Can I stop you from doing this to me?
Kinda. Coincidentally, because my script is always running, collecting data, I show up as “online” all the time. If you were also running a script like this, it would partially prevent what I’m doing from working on you, since you always show up as “online”, no matter what you’re really doing. Activity from the Messenger app will still show up separately, though.
tl;dr
Facebook sends your computer a bunch of interesting information when you’re on facebook.com.
You can collect that information over time and use it to keep track of when people are on Facebook, and which devices they’re using.
You can make a pretty good guess as to what time people are going to sleep and waking up
It’s creepy, but I don’t see a way for Facebook to stop allowing this while still making their chat app good.
So how does this make money again?
Oh, no no no. I just uh don’t get out much.
If you want to talk to me about this blog post then I dunno tweet at me I guess. You can also stalk me on GitHub if you want.
For the latest in dumb novelty websites, please direct your browser to http://oneu.se
462 notes
·
View notes


Photo


The Augmented Reality Sandbox
The Augmented Reality Sandbox (orginally developed by researchers at UC Davis) lets users sculpt mountains, canyons and rivers, then fill them with water or even create erupting volcanoes. This version of the device at UCLA was built by Gary Glesener using off-the-shelf parts and good ol’ playground sand.
Any shape made in the sandbox is detected by an Xbox Kinect sensor and processed with open source software. It is then projected as a color-coded contour map onto the sand.
177K notes
·
View notes
Video
youtube
Tokyo 2020 Olympic and Paralympic Games emblems (via @subidubi)
0 notes
