#Moving Average
Photo

In the North Bay, resources are all that matter. And when the price of those resources crosses the 50 day moving average, it's a sign that something big is happening. That's why the share price of North Bay Resources crossed above the 50 day moving average. They're on the move, and they're about to take the market by storm.
0 notes
Text
Popularity index (a percentage) is used to analyze and predict item sales, chart variations in demand for foods, and each item's popularity in relation to other items.
Popularity Index= (# servings of an item) / (total # of servings of all items in that category) (Inman page 4 in Domain IV)
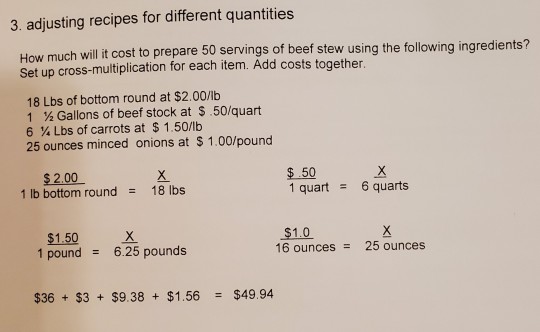
Procurement (determine needs) is based on the # to be served, size, portion, and amount of waste. Multiply portion size by the number of servings, convert to pounds for edible portion.
Edible portion = (# of servings)*(portion size)
E.g. How much tofu should be purchased to produce twenty, four-ounce servings if it has a 50% yield?
Amount to purchase = (edible portion) / (percent yield ) (Inman page 6 in Domain IV)
Thus, EDIBLE PORTION in ounces = (PORTION SIZE) X (# OF SERVINGS).
AMOUNT TO PURCHASE = (EDIBLE PORTION in pounds) / (PERCENT YIELD, WHICH IS THE AMOUNT PROVIDED BY 1 POUND OF THE ITEM) (Inman page 6 in Domain IV)
e.g. How much tofu should you purchase in order to produce 24, 6-oz servings of tofu scramble if it has a 60% yield?
a. (6-oz serving) x (24 servings) = 144 servings in ounces
(144 oz) x ( 1 pound/16 ounces) = 9 pounds. We have 9 pounds of edible portion.
Remember that our yield for this recipe is 60%, or rather, 0.6 (60/100 = 0.6)
b. The amount of tofu you need to purchase is:
(9 pounds) / (0.6 yield) = 15 pounds. Purchas 15lbs of tofu.
To find the number of portions you need to prepare =
[(% shrinkage) x (ounces of ingredient)] / (serving size)
Example: How many servings/portions can you get from 40 pounds of raw kale with a 50% shrinkage if the serving size is 8oz?
So, we know that the kale is going to shrink by 50%. Start with subtracting the amount of kale that will be lost to shrinkage and convert this to ounces:
a. (50% shrinkage) x (40 pounds of kale) -> (0.5)(raw 40 pounds of kale) = 20 are lost in cooking. So, (40 raw pounds kale) - (20 pounds of kale lost in cooking) = 20 pounds of kale left as edible, or 320oz.
b. (320oz) / (8-oz serving sizes) = 40 portions
Economic order quantity is a quantitative approach to ordering regularly stocked items. Economic order quantity tries to find the quantity that minimizes purchasing and inventory costs. EOQ can be used to decrease cost by placing fewer large volume orders. When the cost of placing an order aligns with the cost of holding the items, you have obtained economic order quantity. The equation for economic order quantity is as follows:
√2*F/CP
F = fixed cost of making an order (acquisition cost)
S = sales or usage in units per year
C = carrying costs of inventory (the holding cost), expressed as a percentage of the total inventory
P = purchase unit price
Forecasting usage can be done through time series (e.g. moving average, exponential smoothing), causal models, subjective model (e.g. Delphi technique). (Inman Domain IV, page 8)
Moving average forecasting example: How many cases of oranges will be needed in November? Cases of oranges used: August - 350, September - 222, October - 315
So take the average: (350 + 222 + 315) / 3 = 296. You will need 296 cases of oranges in November.
Seat turnover: (customers per meal) / (# of seats).
The dining hall is open for 4.5 hours. Seats turnover 1.5 times per hour. You need to seat 250 students. How many seats do you need?
(4.5) x (1.5) = 6.75 can be served from one seat. 250/6.75 = 37 seats needed
...
#dietetics#equations#exam#RD exam#to be updated as I study#Domain IV#Domain IV: Foodservice Systems#popularity index#edible portion#EOQ#economic order quantity#forecasting#moving average#time series#seat turnover
1 note
·
View note
Text
Moving Averages- 3 Types, Formula, and Their Calculations
In today’s dynamic financial market, data analysis plays a crucial role in making informed trading and investment decisions. One powerful tool that traders and investors rely on is moving averages. Moving averages provide valuable insights into market trends, support and resistance levels, price crossovers, and volatility. In this blog post, we will explore the significance of moving averages and how you can effectively utilize them to enhance your trading and investment strategies.
https://sharemarketinsider.com/moving-averages/
#moving average#moving averages#3 yearly moving averages#weighted moving average#moving average indicator#100 and 200 period moving averages#5 yearly moving averages#simple moving average#exponential moving average#moving average calculation#moving average calculation in excel#calculation of three yearly moving average#how to calculate moving average#moving average method#moving average formula#moving average trading strategy#weighted moving average formula
0 notes
Text
irl i don't normally tell people my pronouns unless they directly ask, but this has led to a very silly occurrence i call DLC pronouns. my gender is a sidequest you can unlock in the dialogue tree if your character has a high enough lgbtqia+ stat . or if my pride keyring falls out of my pocket.
#i generally think it is good to be out and proud as long as you are not in danger and i try not to give in to the urge to make myself more#digestable to people i dislike anyways#but sometimes you find a good job with good coworkers and bad management and getting to move up in the company means comprimise#capitalism sucks for everyone though because there is no corporate culture without average people comprimising themselves
12K notes
·
View notes
Text
Lambda Moving Average Formulas
In two recent articles, Excel Lambda Moving Average and Improved Excel Lambda Moving Average, I described my efforts to build a Lambda moving average formula that worked the way I wanted it to. I’ve included average calculations for the first few data points before the number of points being averaged is met. I’t’ve also included only counting points within a set number of days, even if there are…
View On WordPress
0 notes
Text
ما هو مؤشر المتوسطات المتحركة؟ moving average
مؤشر المتوسطات المتحركة هو مؤشر فني يقوم بحساب متوسط الأسعار خلال فترة زمنية محددة، ويستخدم لتحديد اتجاه السوق ومستويات الدعم والمقاومة. وهو يقوم بتحويل سعر الأداة المالية، سواء كان سعر الإغلاق أو الأعلى أو الأدنى، إلى مؤشر يعبر عن الاتجاه العام للسوق.
على سبيل المثال، إذا كانت الأسعار تتحرك فوق متوسط الأسعار لفترة زمنية معينة، فإن هذا يشير إلى أن الاتجاه العام هو صاعد، بينما إذا كانت الأسعار…
View On WordPress
0 notes
Video
youtube
What is a Moving Average? How to use it in iq option
0 notes
Text
arthur is rude to that one sex worker because the guys are fucking around as they oughtn't be and he actively wants the source of their distraction to go away. that is how he operates through the entire game: deliberate, utilitarian intimidation and strategic unpleasantness to achieve a goal. it is an early game commentary on arthur meant to position him as a big dog that barks. it is not a commentary on his views about women which are clarified many times afterward. you guys realize that right
#arthur morgan#rdr2#redmeta#this is one of the most wildly misinterpreted but also most obvious scenes where writers are teaching us how arthur moves through the world#i really don't mean to seem short here#i am just exhausted of reddit mentality low literacy “ARTHUR WOULD SHOOT U IN THE FACE FOR FUN HE HATES WOMEN AND SLUTS” takes#my mistake was imagining a world where your average man online could intellectualize about narrative art#unless it is spoonfed to them on a shotty slug that says I'M STRAIGHT BUT I'D LET [MASC CHARACTER] FUCK ME
1K notes
·
View notes
Link
A moving average crossover scanner informs traders and investors about the price trends in the stock market. The two basic uses of moving average are to regulate the trend direction and determine the levels of support and resistance. In the moving average, the prices of stocks vary every now and then and this average is calculated every time there is a change in the prices.
1 note
·
View note
Photo

cheers to the future of humanity (and the future of us)
[ID: Digital illustration in color of Vash and Wolfwood from Trigun. The illustration takes place during the ship/home arc, specifically chapter 21. At the center, Vash is grabbing Wolfwood by the collar and pulls him into a kiss in the middle of a celebration. The pair is colored in vibrant warm hues while their surroundings are colored in cooler colors like green and teals. Luida, Brad, Meryl, and Milly are shown amongst the crowd, occupied in the celebrations as Vash and Wolfwood share a moment by themselves at the center. END ID]
#vashwood#trigun#trigun maximum#vash the stampede#nicholas d wolfwood#hospital yuri (explodeds) like any average vw enjoyer i will never get over that arc#specifically the scene where they heard the news of earth ships coming and did that little handshake they somehow conjured or#Had already. and then the entire ship had a party... meryl and milly started drinking immediately from joy and dragged vash and ww to get#wasted too and overall celebrate together. the chapter moves quickly just like how the hope was quickly withered out and died just hours#later when knives destroyed it. BUT IM JUST THINKING ABOUT IN THE MOMENT OF IT ALL bc in the same chapter#ww asks for a chance for tomorrow and then gets news of earth ships coming. in this same arc vash is thinking of all the things he needs to#resolve so his home doesn't get attacked so the people he love doesn't have to die and the humans he wants to protect gets to live.#i feel like deep down they both semi-recognize that it can't be this easy and regardless of earth ships coming- there's still a wait for#them to arrive and they have to hold out. and regardless ww still has a mission to follow through and vash knows knives would find out#but in that mood of celebration the entire ship brought in - they can at least let themselves relax for a moment and indulge#how they basically engaged with no violence for the few days they were on that ship coaxing them into domesticity... i feel like their#thoughts would wander to somewhere soft and all#allowing them to push aside the tiptoeing and tenseness and be sweet for a night#ruporas art
3K notes
·
View notes
Text
Excel Lambda Moving Average
Moving Averages
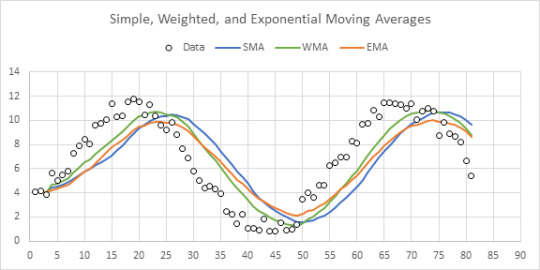
When averaging time-series data, you often want to smooth out peaks and valleys. A moving average is an easy way to smooth your data. When I track my weight, for example, I use a 7-day moving average. This smooths out peaks associated with weekends when I might go out to eat and enjoy a beer or two.
The image below shows 25 random data points and a five-point moving average. The…
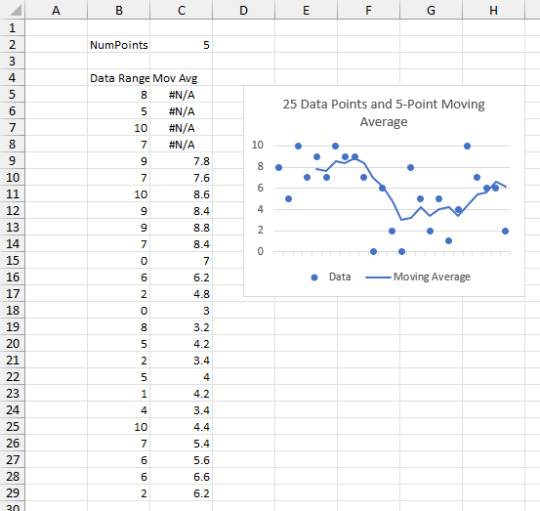
View On WordPress
0 notes
Text
Was sind Trading Indikatoren und welche sind die besten?
Was sind Trading Indikatoren und welche sind die besten?
Jeder kann genauso wie sein Nachbar oder ein Profi an der Börse investieren und versuchen, dabei besonders gewinnversprechende Geschäfte zu machen.
Trading ist dank diverser Online-Plattformen und Mobile Apps längst im Mittelpunkt der Gesellschaft angekommen. Jeder kann genauso wie sein Nachbar oder ein Profi an der Börse investieren und versuchen, dabei besonders gewinnversprechende Geschäfte…

View On WordPress
0 notes
Text
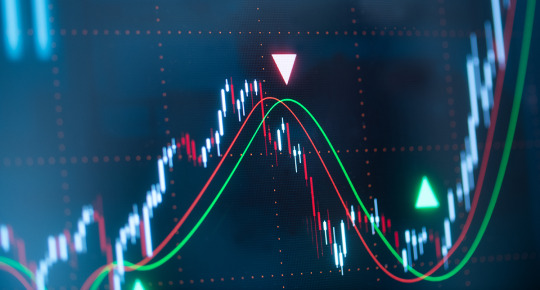
Introduction to Moving Averages | Technical Analysis
Moving averages can be a useful tool used by traders to make educated choices. Moving averages are calculated by determining the price that an asset has averaged over a specified time. For instance, if studying a moving average over the last month then you'll need to add the closing prices for the last 30 days , and divide them by 30.
One of the advantages of using moving averages is that it will help remove random price movements which gives you a clearer view of the overall trend. This is especially helpful during times of high volatility, when prices fluctuate wildly and it's difficult to know what's happening.
When looking at different moving averages, bear in mind that higher-quality moving averages have a greater influence on resistance and support levels. As a principle, higher moving averages are more suitable as indicators for the long term, whereas smaller ones (such as a five-day moving average) are better for short-term indicators.
Moving averages are an effective way to analyse price fluctuations and detect trends. In the event that the value of the particular stock is higher than the moving mean line, it could mean that it's trending upwards, and the average may act as an aid. If the price falls below the line of the moving average this could mean the price is falling and the moving average may act as a resistance.
Formula of Moving average
MA = (D1+D2+D3 +………. Dn) / n
The 'D' in this example is the data points and "n" is the count of data points.
There are various kinds of moving averages, which include simple Moving Average (SMA), Weighted Moving Average, as well as the Exponential Moving Average (EMA)
If you're interested in learning how to use EMA i.e. exponential moving average, and its use in pullback trading visit the Pullback Trading using EMA Breakout Strategy blog to learn how to trade pullbacks with ease.
Formula of Moving average
MA = (D1+D2+D3 +………. Dn) / n
The 'D' in this example is the data points and "n" is the count of data points.
0 notes
Photo


Moving Average - Time series Analysis
http://www.techinfoplace.com/moving-average
1 note
·
View note
Last Seen Blogs

mykayleegraham-blog
Kaylee Graham

registeredtrademark
Registered Trademark

seangokuu
Wanna join my crew?

barbieaemond
✨BarbieAemond✨

saltbert
♡ The year is 2006... ♡