
bsrtips
Behavioral Science Research Tips
A site to aggregate tips and tricks specifically relevant for behavioral and social science research, and specifically targeted to graduate students of those domains. Use the search bar (upper left corner) to search tags and keywords.
34 posts
Don't wanna be here? Send us removal request.
Last Seen Blogs

otomebf
I ❤️ NEW SIEG

nadinbox-blog
Nad'In'Box

midorishiyoi-blog
Untitled

christianmovieaficionado-blog
The Christian Movie Aficionado

hr43s
Hr43s🪽
Text
Run PCA in Excel
To run a PCA in excel, do the following:
1. Open this “Factors” excel file and enable the file
2. Open your data file you want to run the PCA on (it’s important you open and enable the “Factors” file first, before you open your data file.
3. Click “add-ins” option in your data file and select “prinicpal components.” Follow/complete the dialogue box and run. When complete, you will have sheets with eigen values, loadings, rotated loadings, etc. for your output.
0 notes
Text
Embed an iFrame (External Website) into Qualtrics Survey
In the HTML view of your question, copy the following:
<iframe frameborder="0" height="800" scrolling="yes" src="YOURURL" width="100%"></iframe>
For example...
If you want to include a depression health screening questionnaire from an external site in your survey, and you want participants to be able to take the survey without recording their responses, you could include the following in your HTML view of your question:
<iframe frameborder="0" height="800" scrolling="yes" src="https://screening.mentalhealthamerica.net/screening-tools/depression" width="100%"></iframe>
Then, your question will look as follows and participants will be able to interact with the external website/screen without leaving the qualtrics survey.
Note: you can also write “no” after scrolling= if you don’t want participants to be able to move around on the external page.

0 notes
Text
Remove Slider Number Labels
Removing slider number labels. So going from this:

To this:
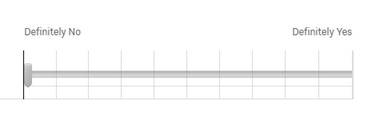
Add the following to the end of the your question text in HTML view:
<style type="text/css">tr.xlabel {display:none;}
.JFEScope .Skin .q-slider ul.numbers {display:none;}
</style>
0 notes
Text
Two Lines Test - Testing for Quadratic Regressions
From Simonsohn (2017): “Many psychological theories predict u-shaped relationships: the effect of x is positive for low values of x, but negative for high values, or vice-versa. Despite implying merely a change of sign, hypotheses about u-shapes are tested almost exclusively via quadratic regressions. The unnecessary and arbitrary quadratic assumption can lead to a 100% false-positive rate, e.g., concluding y=log(x) is u-shaped. Estimating two regression lines, one for low and one high values of x, allows testing for a sign change without functional form assumptions.”
Amazing app that will test the shape of the data for you (efficiently, quickly, and for those who are not R savvy): http://webstimate.org/twolines/
Paper calling for the two lines test using the Robin Hood algorithm: https://papers.ssrn.com/sol3/papers.cfm?abstract_id=3021690
0 notes
Text
Create Timer that Carries Across Questions/Pages
Qualtrics has a built in function for creating a timer that allows you to auto-advance or keep participants on certain pages. However, this function does not work across pages and the visual display is not great.
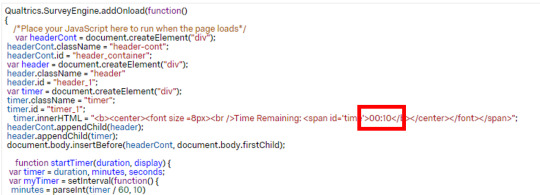
To create a timer that continues across pages/questions and is more visually appealing/prominent use java script below.
EXAMPLE:
Java Script for Qualtrics:

In order to edit the length of the timer, just replace this number with the time you would like to set:
To edit the font and alignment, replace the styling with your preferences:

To specify where you want the survey to auto-advance participants to, replace the URL with either the URL of the webpage, survey, or other location you want participants advanced to when time runs out:

0 notes
Text
Transfer Money from one Turk Prime Account to Another
If you want to transfer money from one turk prime account to another (say, between collaborators/co-authors), select “transfer funds” from your account dropdown menu (image below). Note - you can only transfer between lab accounts.

0 notes
Text
Paying MTurker Separate from HIT
If you need to pay an MTurker or subset of MTurkers independently from the HIT, TurkPrime now has the option to launch a “Compensation HIT” that allows you to pay a set of people any given amount by just providing their MTurk or Turk Prime ID.
Under the ‘Manage Workers’ tab, select “Compensation HIT,” and enter the ID information and amount you would like to pay the worker(s).

0 notes
Text
CONVERTING INDIVIDUAL ROW DATA INTO PAIRWISE DATA
Follow the link below to convert your data to the necessary form to run an Actor Partner Interdependence Model (APIM):

https://fumblingingradschool.blogspot.com/2018/01/converting-individual-row-data-into.html#more
0 notes
Text
Scrape Twitter in R
The easiest to follow instructions for scraping Twitter data through R.
http://utstat.toronto.edu/~nathan/teaching/sta4002/Class1/scrapingtwitterinR-NT.html
Things to note:
-Make sure you have the most recent version of R
-where it says “consumer_key_nt”, replace all of that text with your personal consumer key set in quotations. You will get this key and secrete code/tokens when you create your new twitter application via the previous step
-To convert your twitter dataframe into an excel file, use this script in R: write.csv(fn_twitter_df, “filename.csv”)
0 notes
Text
Restore an Older Version of Your Survey
Example Use: You’ve made a bunch of edits to your survey and decided you like the old version better and would like to restore that version. Rather than editing the survey again, go to “Tools” -> “View Revision History”
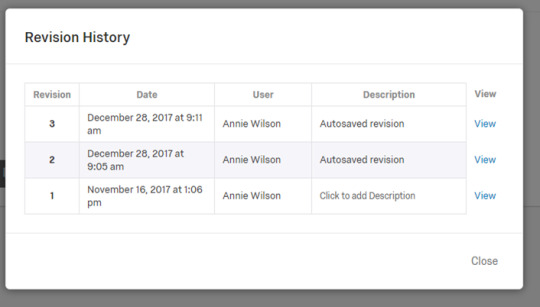
View the version you want to restore.
And select “Restore Revision”

0 notes
Text
Embed first survey Question into Email
Example Use: You want to embed the first question of your survey into the email message and facilitate the transition into the survey to get higher response rates.
1. Go to the “Distributions” page in your Qualtrics survey.
2. Click “Compose Email”
3. This icon is present in the upper left corner of the rich content editor:

Click that icon and select the question you want to embed and the color scheme you would like. Then, when the email is sent, the question you selected will show up in the body of the text:

And when participants click on it, it will bring them to that page of the survey with their option pre-selected.
1 note
·
View note
Text
Need to Recover MTurk IDs?
orgot to ask your participants for an MTurk or Turk Prime ID and need to allocate specific bonuses?
While it’s not the speediest of processes, there is a way to recover this information.
1. Go into the survey flow of your Qualtrics survey and create a new Embedded field labeled “Referer”

2. Re-download your data set. You will see that the “Referer” column will have a long URL for each participant.
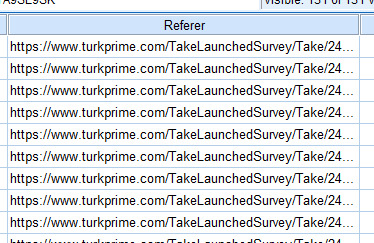
3. Within each of these URLs is the workerID or MTurk ID for each participant:
Example:
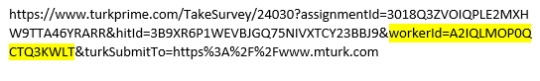
4. In Excel, use the formula to trim and/or extract a subset of characters from a string for each cell to capture only the workerID information (here is a link with more information on that formula if you need it).
5. Now re-pair these IDs with your original data and grant them bonuses :)
�
0 notes
Text
Make a Reaction Time Survey in Qualtrics
Want to make a survey that tracks response time using keystrokes to advance pages (E.g. IAT task or cognitive flexibility switching tasks)?
Follow the link below for instructions:
https://sites.google.com/site/complexcognitionbgsu/data-collection-software/qualtricsadvanced
0 notes
Text
Create a Forest Plot for Meta Analysis Quickly and Easily
Use this website to easily and quickly generate a forest plot for a meta analysis: https://www.evidencepartners.com/resources/forest-plot-generator/
0 notes
Text
Create Continuous Aron et al (1992) Circles Question
Example:
The Aron et al. (1992) overlapping circles question is often used as a measure for self-other interconnectedness. Often, it’s presented as seven options on a likert scale with seven sets of overlapping circles. Using the instructions in the website below, you can make a continuous measure of this question wherein participants drag one circle to overlap with the other on their own to indicate the percent of overlap they perceive between the two entities. This allows you to capture a more flexible, continuous measurement of interconnectedness from 0% to 100%.
Here’s an example: https://hbs.qualtrics.com/jfe/form/SV_1YBLPO1pZIEGgZf
To set this up yourself, follow the instructions at this site: https://github.com/bartkamphorst/fsc-c
#aaronetal#aaron#circles#interconnectedness#qualtrics#program#javascript#css#html#coding#design#measurement
0 notes
Text
Conduct a Simple Meta Analysis Easily with SPSS Macro
To save time in conducting a simple meta analysis, use the Wilson Macro. Here are the steps:
1. Download the macro by downloading the zip file for the Wilson macro found at this website: http://mason.gmu.edu/~dwilsonb/ma.html
2. Create an spss data set that includes a line for each study you want to include in the analysis. For each study, you should have a column for the study id number, d cohen’s value (effect size, ES), the variance (v), and the inverse weighting value. You can easily find the ES value and v if you have your t/f statistic and sample size by using this website: https://www.campbellcollaboration.org/escalc/html/EffectSizeCalculator-SMD-main.php. To calculate the inverse weighting, simply calculate 1/v
3. Run the Macro using Syntax in SPSS. You can find the syntax for the command in the readme file in the zip for the macro. Or you can watch this video for clear instructions on running the meta analysis: https://www.youtube.com/watch?v=hVvXvcDXDt4. As you will see, you can choose the type of meta analysis you would like to run including underlying assumptions about the distribution/heterogeneity and inclusion of moderators, etc.
0 notes