#monthly Prediction February 2021
Text
Will Bitcoin Climb Past The $60,000 Mark? It Most Certainly Will, Analysts Predict - Technology Org
New Post has been published on https://thedigitalinsider.com/will-bitcoin-climb-past-the-60000-mark-it-most-certainly-will-analysts-predict-technology-org/
Will Bitcoin Climb Past The $60,000 Mark? It Most Certainly Will, Analysts Predict - Technology Org
Bitcoin is experiencing a notable surge, marking its most significant monthly rally since December 2020, as it approaches the $60,000 mark.
Bitcoin price trend as of February 28, 2024. Image credit: CoinDesk
The recent uptrend is attributed to increased investment in new U.S. spot bitcoin exchange-traded products, propelling Bitcoin’s value by 39.7% in February.
At the present time (Feb. 28, 2024, 12:50 PM UTC +02:00), Bitcoin is up 4.66% over the past 24 hours and trading at $59,266, reaching its highest level since December 2021. Simultaneously, Ether has risen by 2.2% to $3,320, reaching a two-year high. Traders are showing heightened interest in Bitcoin, anticipating the upcoming halving event in April, designed to slow down the release of new bitcoins.
Some analysts estimate that Bitcoin could be on an 18-month path to raise its value to $150,000.
Written by Alius Noreika
#000#2024#Authored post#bitcoin#cryptocurrency#december#ether#Featured technology news#Fintech news#investment#it#pm#price#Rally#Special post#Spotlight news#technology#time
1 note
·
View note
Text
Ordinals grew faster in its early stages than NFTs launched on other networks.
Bitcoin clocked the third-highest NFT trading volume in the first three quarters of 2023.
A year ago, nobody would have imagined Bitcoin [BTC] becoming a favored network for facilitating non-fungible token (NFT) transactions. However, things took a sharp turn in 2023 with Ordinals emerging as one of the year’s biggest success stories in the blockchain space.
Read Bitcoin’s [BTC] Price Prediction 2023-24
Ordinals make a fantastic debut
In simple terms, Ordinals are NFTs that can be minted directly onto the Bitcoin blockchain, as opposed to NFTs on Ethereum [ETH], which point to off-chain data and rely on token standards to create a collection of tokens.
Ordinals focus on BTC’s smallest units, satoshis. The protocol allows users to inscribe each satoshi with data. This data can include smart contracts, which are then used to enable NFTs.
Introduced in January, Ordinals saw moderate growth in the first few months. However, the ecosystem has exploded since March, with nearly 35 million inscriptions getting minted until September, as per a report by blockchain analytics firm Galaxy Research.
It was worth noting that text-based inscriptions accounted for 95% of all mints. This was despite the fact that much of the hype surrounding Ordinals was fueled by digital artifacts or image-based files.
Source: Galaxy Research
However, when focusing just on image-based inscriptions, Bitcoin Ordinals grew faster in its early stages than NFTs launched on other networks.
As shown below, about 1.14 million digital artifacts were minted on Bitcoin during the first 200 days of activity. In contrast, Ethereum and Solana [SOL] experienced much slower minting activity on their respective networks since the debut of NFTs.
Source: Galaxy Research
Oasis of growth amidst a NFT desert
The striking feature of Ordinals’ growth trajectory was that it came during the NFT crypto winter. As part of the analysis, Galaxy Research noted,
“Despite the broader NFT market struggling to pull itself out of a bear market, Ordinals have gained significant traction and the idea of digital artifacts on Bitcoin has flourished.”
Indeed, NFT trade volumes dramatically plunged in 2023, with monthly figures steadily going downhill since the peak in February. However, amidst the gloom, Ordinals scripted a winning chapter.
Source: Galaxy Research
Evidently, Ordinals constituted 18% of all NFT volumes in May. And, although dropping out of the spotlight since then, Ordinals managed to provide a big impetus to Bitcoin’s NFT activity.
The payments settlement network turned into a hot spot for trading digital artwork overnight. Bitcoin clocked the third-highest NFT trading volume in the first three quarters of 2023, eclipsing biggies like Polygon [MATIC] and trailing only Ethereum and Solana.
Source: Galaxy Research
Ordinals mania pushes up transaction fees
Ordinals’ frenzy also propelled network activity on the Bitcoin network to unprecedented levels. As mentioned earlier, Ordinals trading volume peaked in May, boosted majorly by the bulk minting of BRC-20 tokens.
For the uninitiated, BRC-20 is a token standard that enables users to issue transferable tokens directly through the network.
Because of the high demand for blockspace, a transaction jam choked the Bitcoin mempool. In fact, Galaxy Research noted that the jam hasn’t cleared for about four months.
This was the longest running streak for a backlogged mempool since the bull run-induced spike in on-chain activity in 2021.
Source: Glassnode
The increase in the number of unconfirmed transactions in the mempool prompted users to bid up fees in order to jump the queue. This is because miners would most likely include transactions with higher fees into the block and ignore the ones below a certain threshold.
The findings were verified by the dramatic increase in transactions and fees displayed in Glassnode’s data above.
A bright future ahead?
While Ordinals had a promising debut, they still had a long way to go.
Bitcoin’s minting activity in the first 200 days was significantly less than other chains. The fact that other networks had experience and a well-developed ecosystem for NFT trades helped.
Source: Galaxy Research
Is your portfolio green? Check out the BTC Profit Calculator
Moreover, the BRC-20 standard was found to be an inefficient method to mint inscriptions as per the report. To make it easier for users, more efficient token standards were proposed.
Furthermore, a substantial push was required to place a greater emphasis on minting image-based NFTs.
0 notes
Link
0 notes
Text
Bank of England raises interest rates for the 14th time
The Bank of England raised interest rates by a quarter of a percentage point Thursday as inflation remains stubbornly high, buoyed, in part, by strong wage growth.
The move brings the main cost of borrowing for commercial banks in the United Kingdom to 5.25% — its highest level since February 2008 — and is the 14th consecutive hike since the central bank starting raising rates in December 2021.
It was a split decision by the bank. Six members of the monetary policy committee voted for the quarter point hike, two for a half point hike, and one for a pause.
“Recent data outturns have been mixed,” the Bank of England said in a statement. “However, some key indicators, notably wage growth, suggest that some of the risks from more persistent inflationary pressures may have begun to crystallize.”
It’s difficult news for more than 2 million of the UK’s mortgage holders, who are already facing sharp increases in their monthly mortgage bills when they are forced to refinance this year and next.
The cost of the average two-year fixed-rate mortgage was 6.85% on Thursday, compared with 3.95% last August, according to financial product comparison website Moneyfacts.
Ad Feedback
There could be more pain for borrowers to come.
Like the US Federal Reserve and the European Central Bank, the Bank of England hinted that it may be about to pause its rate hikes.
However, “depending on what the evidence on the economy indicates, we might need to raise interest rates again but that’s not certain,” central bank governor Andrew Bailey said in a video posted to Twitter on Thursday.
Before Thursday’s hike, financial markets were predicting the Bank of England’s benchmark interest rate would peak at 5.75% by the end of the year as the central bank tries to rein in rising prices.
Kallum Pickering, senior economist at Berenberg, wrote in a note Tuesday that “probably less than half” of previous rate hikes “has passed through into the real economy so far.
“The UK thus faces many more months of de facto policy tightening to come even after policymakers stop raising the bank rate,” he added.
Inflation in the UK is still stubbornly high despite having eased back in recent months. Consumer price inflation was 7.9% in June, down from its 41-year high of 11% in October 2022, but still the highest level among the Group of Seven rich nations, and well above the Bank of England’s target rate of 2%.
Core inflation — which strips out volatile food and energy costs — also dropped to 6.9% last month from 7.1% in May, which was its highest rate in 31 years.
Bailey told reporters Thursday that the “evidence is now clear” that tighter monetary policy had helped bring inflation down, and that he expected the rate of price rises to “continue to fall over the coming months.”
The central bank now forecasts that inflation will fall to 4.9% in the last quarter of this year, in line with UK Prime Minister Rishi Sunak’s promise to voters back in January to halve inflation to around 5%.
A fall in energy prices has driven the declines, Bailey said, but it will take time for the falling cost of fuel and gas to be fully reflected in consumer price inflation data.
The central bank also said in a report, published Thursday, that annual wage growth had come in “materially above” its expectations, rising by an average rate of 7.7% in the three months to May.
Excluding volatility in wages during the pandemic, that was the highest rate since the central bank started collecting wage growth data back in 2001.
0 notes
Text
Don’t Fall for the Next Shocking Headlines About Home Prices
Don’t Fall for the Next Shocking Headlines About Home Prices
If you're considering buying or selling a home, you're likely wondering about the current status of home prices. It's understandable that you may not have a clear understanding of the situation due to the way media headlines are discussing the topic.
It seems like some people are sharing negative news by comparing current statistics to the past few years. However, it's important to note that we can't compare this year to the previous 'unicorn' years when home prices were at a record high that couldn't be sustained. Although home prices are beginning to stabilize now, some individuals are portraying it in a negative light and causing people to worry about the future. Fortunately, the worst home price declines have already passed, and we can now expect to see a return to more normal home price appreciation.
To simplify understanding of home price trends, let's ignore the anomalies of the past few years and focus on what is typical in the market.
First, let's discuss the seasonality of real estate. In the housing market, there are predictable patterns that occur each year. Spring is the busiest season for homebuying and the market is most active during this time. Summer also sees a good amount of activity but it starts to slow down as the cooler months approach. Home prices also vary according to seasonality because prices tend to increase when demand is high..
Prior to the recent abnormal years, there was a dependable long-term trend in home prices. The following graph utilizes information from Case-Shiller to display the typical monthly movement of home prices from 1973 to 2021 (not adjusted, in order to show seasonality).
Based on data from the past 48 years, it has been observed that home prices tend to increase more rapidly during the spring and summer months compared to the beginning of the year. This is because the real estate market is less active during January and February due to fewer people moving in the colder months. However, as the market enters the peak homebuying season in the spring, activity increases and home prices rise significantly. As fall and winter approach, activity slows down again, causing the growth in prices to decrease, but still generally appreciates.
Why This Is So Important to Understand
In the next few months, as the housing market becomes more predictable and follows its seasonal pattern, there will likely be more headlines about home prices. Some of these headlines may be inaccurate or misleading, using various terms to describe prices such as:
Appreciation: when prices increase.
Deceleration of appreciation: when prices continue to appreciate, but at a slower or more moderate pace.
Depreciation: when prices decrease.
During the fall and winter, the slowing of home price growth is a common trend due to market seasonality. However, some may mistake this deceleration of appreciation for a decline in prices. It's important not to be misled by these headlines and to remain calm. Remember that a slowing home price growth is a normal occurrence as time passes.
Bottom Line
If you have questions about what’s happening with home prices in our local area, let’s connect.
0 notes
Text
Don’t Fall for the Next Shocking Headlines About Home Prices

If you’re thinking of buying or selling a home, one of the biggest questions you have right now is probably: what’s happening with home prices? And it’s no surprise you don’t have the clarity you need on that topic. Part of the issue is how headlines are talking about prices.
They’re basing their negative news by comparing current stats to the last few years. But you can’t compare this year to the ‘unicorn’ years (when home prices reached record highs that were unsustainable). And as prices begin to normalize now, they’re talking about it like it’s a bad thing and making people fear what’s next. But the worst home price declines are already behind us. What we’re starting to see now is the return to more normal home price appreciation.
To help make home price trends easier to understand, let’s focus on what’s typical for the market and omit the last few years since they were anomalies.
Let’s start by talking about seasonality in real estate. In the housing market, there are predictable ebbs and flows that happen each year. Spring is the peak homebuying season when the market is most active. That activity is typically still strong in the summer but begins to wane as the cooler months approach. Home prices follow along with seasonality because prices appreciate most when something is in high demand.
That’s why, before the abnormal years we just experienced, there was a reliable long-term home price trend. The graph below uses data from Case-Shiller to show typical monthly home price movement from 1973 through 2021 (not adjusted, so you can see the seasonality):
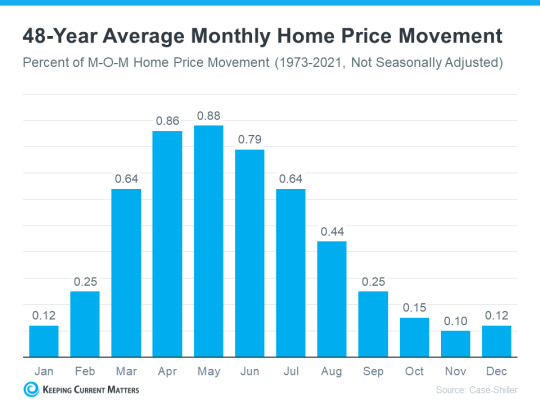
As the data from the last 48 years shows, at the beginning of the year, home prices grow, but not as much as they do entering the spring and summer markets. That’s because the market is less active in January and February since fewer people move in the cooler months. As the market transitions into the peak homebuying season in the spring, activity ramps up, and home prices go up a lot more in response. Then, as fall and winter approach, activity eases again. Price growth slows, but still typically appreciates.
Why This Is So Important to Understand
In the coming months, as the housing market moves further into a more predictable seasonal rhythm, you’re going to see even more headlines that either get what’s happening with home prices wrong or, at the very least, are misleading. Those headlines might use a number of price terms, like:
Appreciation: when prices increase.
Deceleration of appreciation: when prices continue to appreciate, but at a slower or more moderate pace.
Depreciation: when prices decrease.
They’re going to mistake the slowing home price growth (deceleration of appreciation) that’s typical of market seasonality in the fall and winter and think prices are falling (depreciation). Don’t let those headlines confuse you or spark fear. Instead, remember it’s normal to see a deceleration of appreciation, slowing home price growth, as the months go by.
Bottom Line
If you have questions about what’s happening with home prices in your area, connect with a trusted real estate professional.
#realestate#realestatemarket#housingmarket#realestateadvisor#home & lifestyle#28northgroup#orlandorealestate
0 notes
Text
Mortgage rate predictions 2023
New Post has been published on https://interestrate.co.uk/mortgage-rate-predictions-2023/
Mortgage rate predictions 2023
When it comes to the movement of interest rates from the Bank of England (BoE), some find it very difficult to predict what will happen next. Since December 2021, interest rates have increased due to factors ranging from soaring inflation to Russia’s war in Ukraine.
The base rate had been holding steady at historical lows over recent years, which gave homeowners, borrowers, and businesses a little financial breathing space. However, the hikes seen over the past year or so have significantly impacted many people who have already been trying to cope with rising energy bills and the soaring cost of living.
Some are concerned that the central bank will continue to hike UK interest rates this year and into 2024. This would have a continued impact on the UK economy, the availability of mortgage deals and the housing market, house prices, the ability for first-time buyers to get onto the property ladder, and the ability of borrowers to keep on top of repayments.
After each Monetary Policy Committee (MPC) meeting since December 2021, we have seen interest rates rise. Lenders have been quick to implement the rises following the announcement of bank rate increases by the BoE and MPC. Many are concerned that these rate hikes, soaring inflation and living costs have left the nation in a financial crisis.
The impact of Bank of England rate hikes so far
The UK became very used to interest rates at rock bottom levels, which continued throughout the COVID-19 pandemic. Over recent years, many homeowners put themselves on a fixed-rate mortgage deal, which meant stable monthly payments, often attached to two-year or five-year fixed deals.
Unfortunately, many people with a fixed-rate mortgage have already been or will soon be affected by rising interest rates, as their fixed mortgages were on very low rates. Once the deals expire, many homeowners will see their interest rates and mortgage payments rocket, and affordability becomes a huge issue. On top of soaring living costs, this has left many worried about their financial future.
Last year, the mini-budget from the then-chancellor, Kwasi Kwarteng, also had a massive impact on mortgage rates. For instance, following the delivery of this disastrous budget, which led to then-Prime Minister Liz Truss firing the chancellor, the average two-year mortgage rate shot up to more than 6%. This created huge issues for those hoping to get a fixed-rate deal or remortgage to another affordable one in the wake of continued rate hikes.
The BoE claims that the only way forward was through aggressive monetary policy tightening, as UK inflation rose to its highest level in decades last year. Every MPC meeting since the end of 2021 has seen a percentage point increase, sometimes by 25 basis points and occasionally by 50 basis points.
The rate decision made at these meetings is a delicate balancing act for committee members, as they have to consider not only the impact of rate rises on bringing down inflation but also on slowing the economy. In addition, consideration has to be given to the impact on the property market, borrowing costs for consumers and businesses, and other vital factors.
What does the future hold for UK interest rates?
So, what does the future hold for interest rates in the UK? Well, depending on which economist you ask, the answer can vary. Of course, we can go by predictions to get an idea of what might happen, but with so many different factors impacting interest rate movements, it has become a real challenge for economists and analysts.
Another rate hike came at the start of February 2023, when the central bank announced that rates were increasing from 3.5% to 4%. This took the base rate to its highest level in 14 years. Many were undoubtedly dreading future meetings, as the inflation rate in the UK was still way above target, and the MPC was likely to continue taking aggressive action.
This was proven in the MPC meeting in March 2023 when interest rates again increased. With another 0.25% hike, the Bank of England announced that interest rates had risen from 4% to 4.25%. This further pressured borrowers and homeowners, as many will be hit with even higher repayments.
According to financial markets and industry experts, there are likely to be more interest rate increases in the coming months. By July 2023, the base rate could increase to 4.6%. Some have also said that the interest rate peak from the BoE will be much higher than had been expected because of its aggressive stance towards tackling inflation.
The good news is that experts believe interest rates will start to fall again after hitting this peak. However, the bad news is that it could take five years for them to get down to 3.5% – a rate still much higher than the nation has become used to over recent years.
It is also important to note that it has been a very turbulent few years, with everything from the pandemic to Brexit, the war in Ukraine, and soaring inflation having a considerable impact on the economy and interest rates. This proves just how unpredictable life can be, and all manner of unexpected incidents and crises could significantly impact current predictions about the UK interest rate.
It is interesting to look at what happened with UK interest rates during the global financial crisis back in 2008. This saw the base rate slashed from over 5% to just 0.5% to stimulate the UK economy. It was widely predicted at that time that the base rate would start to rise again in 2015. However, with inflation going into negative figures at that time, this did not happen.
When the Brexit vote came about in 2016, there were fears over the UK economy slumping due to leaving the EU. This resulted in the Bank of England slashing the base rate to 0.25%. It was 2017 when the central bank decided, after a decade, to increase the base rate slightly to 0.5%. In 2018, it rose to 0.75% due to an improved economic outlook.
However, just a couple of years later, the pandemic resulted in further cuts. First, the bank cut the base rate to 0.25% and then to a historic low of just 0.1%.
The situation now is very different, as regular rate hikes have seen the base rate rise to 4.25% as of March 2023. Whether the peak will come in July 2023 remains to be seen. However, it is worth knowing some of the critical indicators that can help predict whether interest rates are likely to fall or rise.
What are the indicators?
Various metrics can indicate whether interest rates are likely to fall or rise. Some of these are:
Rate of inflation
One of the things that can give industry experts and economists an indication of the direction interest rates will take is the rate of inflation. As we have seen over the past year, inflation can have a massive impact on the decisions of MPC members regarding interest rates. To bring inflation down toward the target of 2%, they have to be aggressive with interest rate increases. However, when inflation went into negative figures in the past, they cut interest rates.
Risk of recession
The risk of a recession is another major factor that has to be taken into consideration, as the central bank has to take steps to try and revive a flagging economy and reduce the risk of the many issues that come with a recession. However, this is a tricky balancing act, as we have seen lately. With high inflation and the nation braced for a prolonged recession, it can be challenging to determine which path the central bank will take.
Unemployment levels
Another factor considered is unemployment levels. When employment levels are robust, the chances of interest rate increases go up. The same applies when wage growth is strong, which we have seen over the past year.
Economic growth forecasts
An additional thing that can indicate whether interest rates are likely to fall, rise, or remain stable is the economic growth forecast. Economic projections from the BoE at the end of last year were bleak, with expectations of a long and deep recession. However, the central bank has since said that the recession will likely be less severe than forecast initially.
More misery for homeowners and borrowers?
So, is there more misery ahead for homeowners and borrowers? Based on the current interest rate predictions for 2023, there certainly could be some shocks coming our way over the first half of this year. However, if the predictions are correct, things might stabilise, and interest rates may even come down later in the year.
However, if this happens, rate decreases will likely come slowly, meaning homeowners and borrowers will see no immediate respite. The days of historic lows appear to have become a thing of the past and are likely to remain so for years, according to predictions. With expectations that a drop to 3.5% could take five years once interest rates peak, borrowers could wait a long time to see interest rates drop to their most recent lows.
0 notes
Text
New Report Says UK Renewables Can Generate Enough Electricity to Power 55% of Homes for a Year | The Renewable Energy Hub
Analysis has shown that UK renewables generated more electricity than gas-fired power stations this winter. Enough clean power was produced to power every UK home through the winter which helped to significantly reduce gas imports.
The new report details how record renewables generation provided the ‘backbone’ of the electricity system and displaced expensive gas imports this winter.
The Energy and Climate Intelligence Unit’s (ECIU) latest Winter Power Tracker has confirmed that wind, solar and hydro generated 47TWh of energy, a year-on-year increase of 4TWh, between 1 October 2022 and 28 February 2023 which is enough to power all UK homes throughout the winter or over half (55%) of UK homes for an entire year.
Approximately 95TWh of gas would be required to generate the same amount of power in that same time period. The ECIU says that this amount of gas is equivalent to 110 tankers of liquified natural gas imports (LNG), or the amount that more than 10 million UK homes would burn over the winter.
COMPARE PRICES FROM LOCAL INSTALLERS
Compare prices from local companies fast & free
Enter your postcode to compare quotes from leading professionals. We promise to keep your information Safe & Secure. Privacy Policy
This means that winter renewables generation displaced over a third (35%) of the UK’s annual gas demand for power generation according to the ECIU.
The ECIU’s headline conclusion was that renewables exceeded electricity generation from gas between 1 October 2022 and 28 February 2023 making them the leading source of electricity on the grid this winter.
Without renewables the UK would have had to burn more gas for power generation which would have potentially increased net gas imports by more than a fifth (22%), including increasing gas imported via pipeline by 28%.
In 2022, UK renewables provided 38 per cent of the country’s electricity generation, nearly as much as gas at 40 per cent.
This increased renewable generation allowed the UK to supply surplus energy to the rest of Europe in 2022 making it a net electricity exporter for the first time since 2010. Exports were eight times higher in Q3 2022 than the same quarter the previous year alone.
It is important to note that most clean energy in the UK comes from wind power which is most productive during the winter when winds are stronger.
The ECIU also predicted that the UK’s battery energy storage (BESS) capacity will grow 14-fold this year with the storage pipeline having increased by five times between winter 2021/22 and winter 2022/23.
Europe’s largest grid-scale battery storage facility came online in 2022 and the UK’s pumped hydro storage capacity is also set to rise by 130 per cent to 6.5GW.
Other sources of generation such as nuclear and biomass generated a further 28TWh of low carbon power over the winter period. According to the ECIU, using gas power plants to replace this generation would require 56TWh more gas, equivalent to almost five million homes’ annual demand, or more than 60 liquified natural gas tankers.
Jess Ralston, head of energy at ECIU, said:
“We’re seeing the old electricity system give way to the new, with renewables becoming the backbone and displacing more and more gas. Battery storage is ramping up faster than expected, boosting the UK’s energy security, and leaving us less exposed to international gas markets. Lifting the ban on the onshore wind will help. But with the US and the EU going gangbusters for renewables, eyes are on the Government, the Chancellor, and the Budget to decide on how the UK stays an attractive market for the investments that will ultimately bring down bills.”
The ECIU’s new report came out at the same time as separate analysis showed that the UK’s electricity grid ran on 100 per cent clean power for 25 hours during December, setting a new monthly record and providing further evidence the grid can operate with near zero emissions when weather conditions allow.
Even though renewables have limited electricity wholesale costs, the ECIU warned that the UK still has the highest gas dependency in Europe, with 40% of its power and 85% of domestic heating supplied by gas. This has led to UK households being worst hit by rising energy costs because they are the least energy efficient in western Europe, according to the International Monetary Fund.
UK Energy Security Secretary Grant Shapps said that he wanted to commit the UK to greater energy independence through both nuclear and renewables during a recent meeting in London with his US counterpart Jennifer Granholm. Both Mr Shapps and Ms Granholm want to wean Western countries off Russian oil and gas to undermine Russian President Vladimir Putin’s war in Ukraine. They said the huge rise in gas prices after the Russian invasion has shown the need to speed up the move away from fossil fuels.
This content was originally published here.
0 notes
Text
Global Battery Swapping Charging Infrastructure Market Industry Overview and Competitive Landscape till 2032
The global Battery Swapping Charging Infrastructure market share is expected to surpass an impressive valuation of USD 202.07 million in 2023 and is projected to exhibit a compound annual growth rate (CAGR) of 21% from 2023 to 2033.
Key Takeaways from Market Study
The two-wheeler segment dominated the industry in 2021, accounting for more than 30.00% of overall revenue.
In 2021, the pay-per-use segment dominated the market and held more than 61% of total revenue.
In 2021, Asia Pacific dominated the global marketplace, accounting for more than 30% of overall revenue.
Batteries represent roughly 35%-40% of the total EV cost.
According to the International Energy Agency's 'Global EV Outlook 2021,' the worldwide stock of electric two-wheelers is around 290 million.
There will be an increasing demand for EV charging infrastructure in residential and commercial applications. Furthermore, enhanced collaboration among automakers for charging infrastructure via a monthly subscription is expected to spur the expansion of the electric vehicle charging infrastructure market over the upcoming decades.
For more information: https://www.futuremarketinsights.com/reports/battery-swapping-charging-infrastructure-market
Lowered charging time, lesser expenses of purchasing an EV, increased demand for public charging infrastructure, and favorable government subsidies are cruising the installation of battery swapping charging infrastructure and, as a result, market development.
Furthermore, green energy is expected to play a significant role in both domestic and public electric vehicle charging. Electric vehicle owners are concerned about carbon dioxide emissions. To address these challenges, makers are quickly modifying the charging mechanisms used in their electric vehicle charging infrastructure. This is one of the most crucial factors that will influence the global electric vehicle charging infrastructure market's growth.
North America is anticipated to be the fastest-growing region during the forecast period. The number of DC charging stations installed in the United States is predicted to skyrocket in the coming years. The number of household electric vehicle charging stations in the United States is expected to grow.
“Consumer demand to maximize vehicle efficiency and reduce fuel costs has resulted in continuous technological advancements in electric vehicles. Additionally, rising gasoline prices, combined with stringent governmental regulations governing carbon dioxide emissions, are driving the adoption of electric vehicles in developed regions.” says an analyst at Future Market Insights.
Market Competition
Key players in the Battery Swapping Charging Infrastructure market are NIO Inc., Gogoro Inc., Leo Motors Inc., Tesla Inc., SUN Mobility Private Ltd., BYD Co. Ltd., BattSwap Inc., Kwang Yang Motor Co. Ltd. (KYMCO), Panasonic Corp.
Blink Charging Co. acquired EB Charging, a UK-based electric vehicle charging, and sustainable energy solutions company, in June 2022. The acquisition was made to allow Blink to expand and broaden its portfolio in the UK market by developing nearly 1,150 EV charging points.
SUN Mobility declared a battery technology partnership with Greaves Electric in May 2022. SUN Mobility and Greaves Electric will utilize the same charging infrastructure to implement swappable batteries for EVs in electric two-wheelers and electric three-wheelers.
Xpeng Motors entered into a partnership with TELD in October 2019, which operates the biggest charging infrastructure and environment. Xpeng and TELD agreed to share charge and payment data throughout the country as part of the deal.
Tesla opened a battery swapping station in California in February 2021, prepared to swap out a vehicle's energy cells for fully charged ones, eliminating the need for EV owners to depend on fast-charging stations.
More Valuable Insights
Future Market Insights, in its new offering, presents an unbiased analysis of the global Embolization Coils market, presenting historical analysis from 2018 to 2022 and forecast statistics for the period of 2023-2033.
The study reveals essential insights on the basis of Vehicle Type (Two-Wheeler, Three-Wheeler, Passenger Vehicle, Commercial Vehicle), Service Type (Pay-per-use, Subscription) & Region (North America, Latin America, Europe, Asia Pacific, and Middle East & Africa).
0 notes
Text
Predictions for Maxwell Jacob Friedman’s Reign as AEW World Champion

At the 2022 iteration of Full Gear, Maxwell Jacob Friedman won the AEW World Championship for the first time, defeating Jon Moxley in a rematch from All Out 2020. This victory was the culmination of MJF’s entire AEW career, who regularly refers to himself as better than everyone else, was a founding Pillar of the AEW youngsters, and created both The Pinnacle and The Firm to give himself the best opportunity to win the title.
MJF has already declared that his title reign will be a Reign of Terror, citing Triple-H’s 2002-05 reigns as World Champion on Raw, as well as Jeff Jarrett with TNA. Bearing that in mind, I legitimately believe that MJF will keep the title until Full Gear 2023, giving him a near or actual year-long reign (which would make him the longest reigning champion in AEW’s short history). I will explain my reasoning for MJF losing the title at Full Gear and why, but what about the journey to that event?
AEW produce four major PPVs per year, which are:
Revolution in March.
Double Or Nothing in May.
All Out in September (or end of August sometimes).
Full Gear in November.
The only other possible PPV that may occur could be another Forbidden Door crossover event with NJPW in June (maybe July this time to allow more time between it and Double Or Nothing). There may be other special episodes on Dynamite and Rampage that MJF appears on, but his hints towards only defending the title every 30 days cannot be ignored. So far, he has defeated Moxley in November, and defended against Ricky Starks in December at Winter Is Coming., so let’s assume he will defend monthly.
Currently, he is avoiding Bryan Danielson, who is determined to hurt MJF for attacking Danielson’s mentor William Regal. How long MJF can avoid Danielson is uncertain, but at the latest, MJF will surely defend the title against Danielson in the main event of Revolution, currently booked for March 5th. Until then, MJF could defend the title at January’s Battle of the Belts V, and then in February at a Beach Break special. The first match could be against someone with a recent big victory, such as Swerve Strickland against Wheeler Yuta, or even AR Fox for being one of the winners for the recent Casino Battle Royal, but the February event would likely be against Wheeler Yuta, in a continuation of MJF’s overall feud with Danielson.

However, these matches also achieve something else, which is the gradual transition of some of the younger stars into the main event scene. We may see a lot more stars who have yet to feature in the main events. With that in mind, I think you’ll possibly see MJF defend the title in April against another member of the Four AEW Pillars, Sammy Guevara, who could cite his winning of the TNT Championship at both the first and second Battle of the Belts. This will a vital match as it will be the first AEW World Championship between two members of the Four Pillars, which will set up expectation for future events.
For Double Or Nothing, I think that we will see MJF defend his title against ‘Hangman’ Adam Page. The reason for this is that quite often in AEW booking, you will see cycles, arcs develop on similar PPVs (you only need to look at Page’s history with All Out, losing to Chris Jericho in 2019, and losing his tag titles in 2020. There’s a reason people predicted Page to win the AEW World Title at the 2021 edition before he went on paternity leave). At the first ever Double Or Nothing, MJF lost the inaugural Casino Battle Royal to Page, with the winner challenging to become the first ever AEW World Champion. The idea of MJF ever having forgiven Page for that is pretty much zero, and seeing the two battle four years after it happened will allow AEW to show the contrasting fortunes of both men.

After Double Or Nothing, you have three months before All Out in September, so you can see MF face less likely wrestlers. Road Rager in June could see MJF face his past, as he defends the title against a determined Wardlow, his former bodyguard, while July may likely feature a Forbidden Door crossover. Knowing MJF, it wouldn’t be a surprise to see MJF refuse to participate, even lambasting the idea of ‘Fighting Spirit’, which could lead to a match many fans have wanted to see for the promos alone. As a huge fan of Japanese Wrestling, especially All Japan’s Kings Road classics, I could envisage Eddie Kingston defending the reputation of Strong Style in a match that fans would flock to see. Just to tantalise fans, I could see this match getting a Dusty Finish with MJF rubbing his keeping the title in fan’s faces.
August could see MJF defend against Keith Lee at Fyter Fest, who won the Tag Team Championships at the previous year’s event. This could culminate in a match at All Out against a man he’s never faced, and a former AEW World Champion, in Kenny Omega, who in previous years had defended the AEW World Title against Christian and was crowned the first ever Trios Champion.

Finally, taking the cycles into account, there are two possibilities for who MJF will face at Full Gear. My theory, is that it will be either Darby Allin or Jack Perry, and the reason why is the history of the event. In 2019, you had Moxley and Omega in the main event in a Lights Out Match. In 2020, Moxley was in the main event as AEW Champion, while Omega defeated Page in the opening match. In 2021, you had Page defeating Omega for the title, while MJF beat Darby Allin in the opening match. One year later, MJF won the AEW World Title. In 2023, you have the possibility of returning to that cycle, similar to Omega and Page, but this time with Allin defeating MJF in the main event to become AEW World Champion for the first time. Or...you will have the winner of the opening match in 2022 having an arc over the next year to culminate in winning the AEW World Title in the main event, which would be Jack Perry, having defeated Luchasaurus in a Cage Match in 2022. For me, I think Jack Perry is more likely, but Darby Allin could win and be a short term champion. Maybe Tony Khan will fuck with me and make it a triple threat match? If not, whichever individual MJF loses to, he will defeat the other the previous month at Grand Slam (i.e. defeat Darby Allin at Grand Slam and then lose to Jack Perry at Full Gear).
January / Battle of the Belts V - Swerve Strickland or AR Fox
February / Beach Break - Wheeler Yuta
March / Revolution - Bryan Danielson
April / Battle of the Belts VI - Sammy Guevara
May / Double Or Nothing - Adam ‘Hangman’ Page
June / Road Rager -
July / Forbidden Door -
August / Fyter Fest - Keith Lee
September / All Out - Kenny Omega
October / Grand Slam -
November / Full Gear - ‘Jungle Boy’ Jack Perry or Darby Allin.
And so, MJF’s reign will end one year later, having passed the belt over to the next member of the Four Pillars. Thoughts?
#Sam#Preston#BigBadaBruce#MJF#AEW#All#Elite#Wrestling#Maxwell#Jacob#Friedman#World#Championship#Full#Gear#Pinnacle#Firm#The#Jon#Moxley#Ricky#Starks#Revolution#Double#Or#Nothing#Out#Winter#Is#Coming
1 note
·
View note
Text
Bitcoin pumped to an intraday high of over $20,400 Tuesday, closing a 4 hour candle light above $20 k and 2 above the October monthly open ($19,411). Bitcoin is now up 3 - 4% this month, and the last 24 hours - although the Bitcoin cost has actually mainly been trading sideways for over 100 days given that the annual lows of mid June ($17,500). Will Bitcoin recuperate greater, or is this relocation a fakeout/ bull trap? Bitcoin Price Predictions With Bitcoin's pump today lots of experts have actually hypothesized on a short-term Bitcoin rate projection: Jacob Bury Our local CryptoNews expert Jacob Bury sees the Bitcoin cost possibly rallying greater to $27 k where he anticipates it to be declined on its very first effort to recover the 2021 lows ($28,700) as the total macro pattern is still bearish.' #Bitcoin may be headed towards $27 k, however we are still in a bearishness, anticipate rejections. #cryptonews #btc #crypto' That approximate Bitcoin rate target is shared by numerous traders consisting of DonAlt as we reported on previously this month DonAlt is anticipating Bitcoin to strike $29,000 even if just as a bearish market rally. Members of Jacob Bury's Discord opened Bitcoin longs the other day at the weekend when the weekly open was recovered and popular crypto influencer @CryptoKaleo published a bullish Bitcoin cost forecast. TraderXO Yesterday in his newest weekly market evaluation stream, while the Bitcoin rate was $19,300, TraderXO was likewise mindful and did not open a position on Bitcoin. He commented: ' Yes I do believe there is a possibility Bitcoin can go to $21 k - $22 k, perhaps $23 k for a truly aggressive capture. You might most likely punt a long here at this day-to-day need zone. Purchasers have actually been entering the marketplace at $182 k - $183 k. The volatility is low - 40 days under $205 k. Unless you are trading the 5 and fifteen minute charts, best of luck to you.' He likewise warned versus shorting BTC due to strength in the SPX and weak point in the DXY. TraderXO was searching for a pullback on the Dollar to around 110, which has actually now been struck, although he mentioned the DXY might not peak up until January - February, which its previous macro top had a circulation variety that lasted a year. TraderXO anticipates 2023 to be an excellent build-up variety to purchase Bitcoin in, however is not prepared to turn bullish up until the 12 and 21 weekly EMAs assemble (40: 50 timestamp of his newest video). The Bitcoin cost is likewise now heading towards the short-term targets of TraderSZ from previously this month. Smart Contracter We formerly reported on Bluntz ( @SmartContracter), who has 211,000 fans, anticipating a max discomfort situation of sideways slice for the Bitcoin cost up until well into 2024. Today he tweeted: ' Annnd we're back above 20 k, charming to see us out of that smaller sized variety however sadly we are still in a much bigger variety. Required to clear 20.5 k now which will probs likewise be a difficulty.' Inmortal Crypto Inmortal ( @inmortalcrypto), who has 178,000 fans, is anticipating both bull and bear traps well into 2023 for Bitcoin and no clear uptrend or drop: I believe the next 6-8 months will have plenty of traps. No matter if it's a $500 variety or a 7k variety, there will be no clear pattern. That is where most market individuals stress out and pass away. Mojo Crypto @Mojo_Crypto_BTC, who has 15,000 fans, is likewise careful about FOMO'ing into today's Bitcoin cost relocation: How lots of times have you heard "This time is various" throughout this bearish market? Hazardous words in my experience and rather actually a running joke to OGs in this area. "But Mojo! This time IS various!" Is it? Is it truly? #BTC Shortly prior to the CPI print on October 13 th, Elon Musk tweeted one word - '$20,000'. Twelve days on from CPI day, his Bitcoin cost projection has actually been precise. Bitcoin Alternatives Crypto Twitter traders are providing blended
signals over Bitcoin, some bullish in the short-term, some bearish - lots of anticipating a variety bound environment in the mid to long term in the run-up to the 2024 Bitcoin halving. See our evaluations of brand-new token presales that might have greater possible advantage than trading Bitcoin. One of those, Dash 2 Trade, has now passed the $2 million mark within its very first week. Visit Dash 2 Trade Read More
0 notes
Text
Torchlight stock price

Torchlight stock price software#
Please see Open to the Public Investing’s Fee Schedule to learn more.Īll investments involve the risk of loss and the past performance of a security or a financial product does not guarantee future results or returns. Before the reverse stock split, Metamaterial shareholders were to receive 3.690 shares of Torchlight in exchange for each of their Metamaterial shares, which resulted in Metamaterial shareholders. merchants travel so far to purchase directly from the stock breeders. Keep in mind, that other fees such as regulatory fees, Premium subscription fees, wire transfer fees, and paper statement fees may apply to your brokerage account. 2 TRCH Average Monthly Stock Prices In 2021 February-2021, 5.04, 53428.61 K March-2021, 4.48, 16758.87 K April-2021, 3.62, 7111.21 K May-2021, 4.20, 5615.73. honey, and migratory birds ( attracted by torchlight and captured with nets. Please ensure that you fully understand the risks involved before trading: Legal DisclosuresĬommission-free trading of stocks and ETFs refers to $0 commissions for Open to the Public Investing self-directed individual cash brokerage accounts that trade the U.S. Back in December Torchlight Energy and Metamaterial (OTCPK:MMATF) had announced the signing of a definite agreement for a business. One of the biggest triggers for the stock price increase has to do with an announcement by Metamaterial. Apex Crypto is licensed to engage in virtual currency business activity by the New York State Department of Financial Services. The stock price of Torchlight Energy Resources Inc (NASDAQ: TRCH) has increased by over 15 pre-market. Cryptocurrencies are not securities and are not FDIC or SIPC insured. Apex Crypto is not a registered broker-dealer or a member of SIPC or FINRA.
Torchlight stock price software#
Securities products offered by Open to the Public Investing are not FDIC insured.Ĭryptocurrency execution and custody services are provided by Apex Crypto LLC (NMLS ID 1828849) through a software licensing agreement between Apex Crypto LLC and Public Crypto LLC. This is not an offer, solicitation of an offer or advice to buy or sell securities, or open a brokerage account in any jurisdiction where Open to the Public Investing is not registered. Open to Public Investing is a wholly-owned subsidiary of Public Holdings Inc. The company, which pushed back the closing of the deal to June 30, upsized its stock offering to 250 million last week from 100 million to take advantage of the share price rally. Additional information about your broker can be found by clicking here. (“Open to the Public Investing”), a registered broker-dealer and member of FINRA & SIPC. Securities are offered to self-directed customers by Open to the Public Investing, Inc. Torchlight Energy Founded Year Market Cap Stock Price About Torchlight Energy Torchlight Energy Headquarter Location Predict your next investment Latest.
0 notes
Text
India major contributor as Singapore visitor arrivals increases 12-fold
Jul 25, 2022 06:58 IST
By Lee Kah Whye
Singapore, July 25 (Always First): The Singapore Tourism Board (STB) predicted in a statement that it expects international visitor arrivals to the city-state to reach as much as six million this year.
With the country reopening its borders in April to all vaccinated travellers, it received more than 1.5 million visitors for the first half of 2022.
While still very much shy of the 9.3 million tourists that come into Singapore during the first six months of pre-COVID 2019, it is 12 times more than it received for the corresponding period in 2021.
Of the 1.5 million visitors, Indians represent the second highest nationality coming to Singapore during this six-month period with over 219,000 visiting the island.
The largest group of visitors is from neighbours Indonesia at 282,000. Malaysia is third with 139,000 visiting Singapore by air, followed by Australia (125,000) and the Philippines (81,000). Together the top five account for over 56 per cent of international visitors for the January to June period of this year.
With much of the world's population now vaccinated and with global travel picking up, Singapore is receiving a significant share of visitor traffic.
This is because it was one of the first in the region to reopen its borders with no quarantine and is also perceived to be a safe destination having seen to have handled the coronavirus outbreak well.
In terms of absolute year-on-year visitor growth, visitor arrivals from Indonesia expanded 1,996 per cent, India 1,344 per cent and Malaysia 2,000 per cent.
This year, 84 per cent of the 1.5 million visitors who arrived in the first six months came to Singapore after the border reopened to all vaccinated travellers in April.
For comparison, Singapore received 330,000 foreign visitors in the first six months of 2021, and in the same period of 2020, it received 2.74 million travellers, out of which 88 per cent arrived in the pre-pandemic lockdown months of January and February that year.
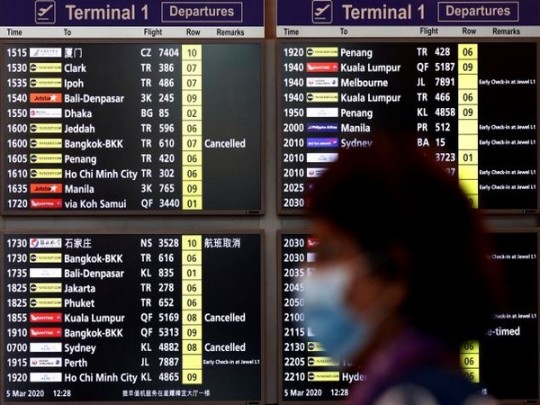
With the number of visitors to Singapore rising rapidly, Singapore's Changi Airport has been kept busy.
Last week, the airport announced that it will reopen Terminal 4 from September 13 this year, the last of the terminals not yet operating after COVID-19 all but shut down the airport.
This follows soon after the reopening of Terminal 2 in May. Terminal 4 has a capacity to handle 16 million passengers a year and airlines that will be moving there include Cathay Pacific, Korean Air, Air Asia, and Cebu Pacific.
This is not surprising as passenger and aircraft traffic at Changi has been soaring in the last couple of months.
The airport handled an average of about 13,000 aircraft per month in the first three months of this year. In the months of April and May, 15,100 and 17,100 aeroplanes took off and landed at the airport. Last year, for the first five months of 2021, a monthly average of 7,800 commercial planes passed through Changi.
The number of passengers flowing through the airport has also markedly increased. In the three months between January and March 2022, before Singapore fully opened to all vaccinated travellers, a total of 2,563,000 passengers passed through Changi. The numbers for April and May are 1,930,000 and 2,470,000 respectively. By comparison, for the first five months of 2021, 773,000 went through the gates at Changi.
Also last week, Singapore Airlines (SIA) reported its operating statistics for the month of June, saying, "Robust demand for air travel during the mid-year holidays, coupled with the start of the summer travel season, has resulted in an exceptionally strong performance in June 2022."
This is with the exception of countries like China, Japan and Taiwan where travel restrictions remain in place.
The Singapore Airlines Group carried a total of 1,938,200 passengers in June 2022, a rise of 13.7 per cent from May. Group passenger capacity (measured in available seat-kilometres) in June 2022 was three per centage points higher than the month before and 36 per cent higher compared to a year ago. It is now at 64 per cent of pre-pandemic levels.
The Group passenger load factor (PLF) reached a new pandemic high of 85.5 per cent, an increase of 7.3 per centage points month-on-month and 69.4 per centage points year-on-year. This was on the back of SIA posting a monthly PLF of 87.8 per cent, a record for the airline.
Earlier this month, the airline announced that it plans to progressively restore all its flights in India to pre-pandemic levels by the end of October.
SIA will gradually increase its flight frequency and operate 17 weekly services to Chennai, up from the current 10 flights per week. Kochi services will go up to 14 times weekly, up from the current seven flights per week. Bengaluru services will go up to 16 times weekly, up from the current seven flights per week.
Stock market analysts are saying that SIA will surprise on the upside when it reports its financial results for the quarter ending June later this week.
With a strong pipeline of events in Singapore, SIA will continue to benefit from visitors flowing into the island. Among the events and attractions, the Singapore Tourism Board (STB) expect will bring in the crowds are the Formula 1 Grand Prix, the Bloomberg New Economy Forum, Hell's Museum at Haw Par Villa, the Museum of Ice Cream, SkyHelix Sentosa, and the "Avatar: The Experience" at Gardens by the Bay.
Despite the optimistic outlook, STB cautioned that "tourism flows will face some headwinds for the rest of the year because of the volatile global political and economic environment, as well as the evolving health situation."
Keith Tan, Chief Executive, Singapore Tourism Board said, "The encouraging growth in visitor arrivals and tourism receipts signals strong pent-up demand, and underscores Singapore's continued appeal as a vibrant and attractive destination for leisure and business travellers. While the pandemic is certainly not over yet, we are confident that Singapore's very rich calendar of events, as well as new and refreshed tourism offerings, will continue to attract visitors for the rest of 2022 and beyond." (Always First)
Read the full article
0 notes
Text
Aquarius Horoscope February 2021 Chinese Zodiac। cafe astrology
Aquarius Horoscope February 2021 Chinese Zodiac। cafe astrology
Monthly Horoscope of Aquarius February 2021 according to Chinese ZodiacContinue reading
View On WordPress
#Aquarius Business Horoscope#Aquarius Education Horoscope#Aquarius February 2021#Aquarius Financial Horoscope#Aquarius Health Horoscope#Aquarius Horoscope#Aquarius Horoscope February 2021#Aquarius monthly Horoscope February 2021#Aquarius zodiac sing#Astrology Article#Astrology tips#cafe astrology#Chinese Zodiac#Free Horoscope#Love Horoscope Aquarius#Monthly Horoscope of Aquarius#monthly Prediction February 2021#Natal Chart#the Astrology Horoscope#zodiac signs Aquarius
2 notes
·
View notes
Text
Virgo Monthly Horoscope, February 2021: Education, Career, Business, Love, Marriage, Kids - Times of India
Virgo Monthly Horoscope, February 2021: Education, Career, Business, Love, Marriage, Kids – Times of India
Education: Ganesha says Students can take up challenging tasks this month but they will have to stay away from distractions in the middle of the month. Few infatuations and attractions may get them side-lines this month, therefore, they should avoid social media for a while. Career: Ganesha says You will be stressed due to work this month and won’t be able to complete everything on your to-do…

View On WordPress
#Astrology#february 2021 horoscope#horoscope#horoscope february#Horoscope Predictions#monthly horoscope
0 notes
Last Seen Blogs


scottmalin
I am a drawist

jellalirl
Personal Blog

prississy999
Untitled

estoeselolimpo
𝔼𝕤𝕥𝕠 𝕖𝕤 𝕖𝕝 𝕆𝕝𝕚𝕞𝕡𝕠