#pythonbeginner
Text
Python Ternary Operator
Visit our site for free project source codes-- dailyaspirants.com
.
.
Follow @dailyaspirants for more content on website development, programming languages like Python, PHP, SEO, Free tools..etc.
#pythonhub#pythonprogramming#python3#programming#pythonprojects#pythonbeginner#coding#chatgpt#AI#codingforkids#CodingisFun#codinglife#html#html5#css#Code#dailyaspirants#numpy
0 notes
Text
0 notes
Video
youtube
Python for Beginners - Learn Python Now Without IDE - 2
#python#pythontutorial#pythonbeginner#pythoncourse#pythonfullcourse#pythonlearning#pythonforbeginners
0 notes
Video
0 notes
Video
Python Students Beginners Group Discussion | Python Interview Preparatio...
#youtube#Python Coding Programming InterviewPreparation LearnPython PythonBeginners PythonCoding InterviewTips CodeNewbie TechCommunity PythonProgram
0 notes
Photo
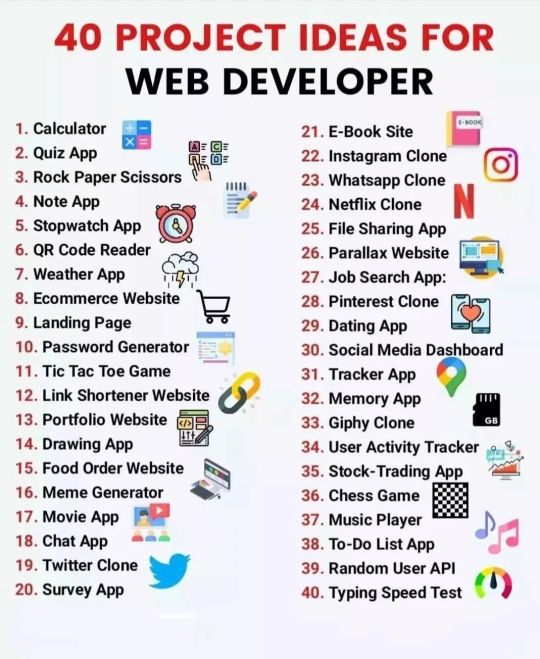
40 projects idea for web developer. . 🔁Use #openprogrammer in your Awesome code-related content and get a free feature. 👉 Follow @openprogrammer for more educational content ❤️ 🤝Join Our Telegram Channel 🛒Visit Our website 🔗Link In The Bio!! 👉Don't Forget To Like ♥️ | Share 📲 | Save 📥 🔛Turn On Your Post Notifications🔔 #knowprogram #programming #python3 #computerscience #computerprogramming #programminglanguage #programminglanguages #coders #fullstack #programmingislife #programmingquotes #machinelearning #programmerindonesia #codingbootcamp #html #programminglife #learnpython #pythonprogrammer #pythondeveloper #fullstackdev #codingchallenge #codingquotes #webdevelopment #pythonprogram #pythontutorial #programmingtutorial #datatype #pythondev #pythonbeginner (at India) https://www.instagram.com/p/CkTN4PPvwyV/?igshid=NGJjMDIxMWI=
#openprogrammer#knowprogram#programming#python3#computerscience#computerprogramming#programminglanguage#programminglanguages#coders#fullstack#programmingislife#programmingquotes#machinelearning#programmerindonesia#codingbootcamp#html#programminglife#learnpython#pythonprogrammer#pythondeveloper#fullstackdev#codingchallenge#codingquotes#webdevelopment#pythonprogram#pythontutorial#programmingtutorial#datatype#pythondev#pythonbeginner
5 notes
·
View notes
Photo

Python and Web Development Classes for Beginners at an affordable fee of 700-1500 INR. Classes will be 3 times a week with a doubt session every alternate week.
8 notes
·
View notes
Photo

@letstacle #pythonprojects for beginners @letstacle Follow @letstacle #pythonbeginner #pythonbeginners #pythonprojects #pythonlover #pythonlanguage #pythonlovers🐍 #coderslife #codingisfun #codingbeginner #softwaredevelopment #programmingpython #webdesign #codingforgirls #comment4comment #followforfollowback #computerscience #lovepythons https://www.instagram.com/p/COpB5R5HYRx/?igshid=1h1vro4mrmyzf
#pythonprojects#pythonbeginner#pythonbeginners#pythonlover#pythonlanguage#pythonlovers🐍#coderslife#codingisfun#codingbeginner#softwaredevelopment#programmingpython#webdesign#codingforgirls#comment4comment#followforfollowback#computerscience#lovepythons
1 note
·
View note
Photo

Python Beginner Topics | InsideAIML
Insideaiml is one of the best platforms where you can learn Python, Data Science, Machine Learning, Artificial Intelligence & showcase your knowledge to the outside world.
1 note
·
View note
Photo


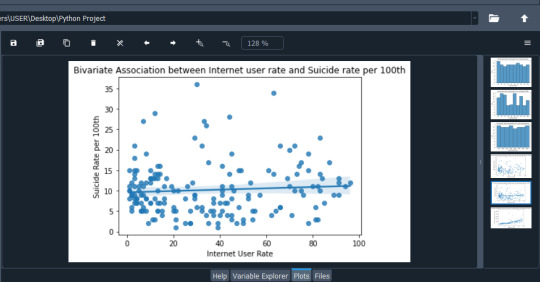
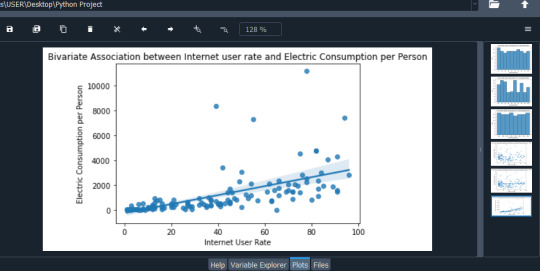


Relationship between Internet User Rate, Electrical Energy Consumption and Suicide Rate
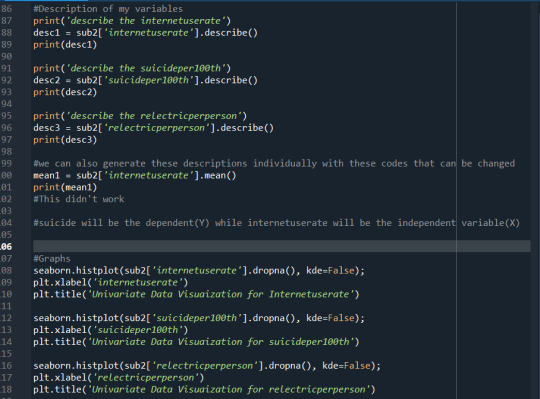
Description of my Output
I generated a sub data set that included nations with suicide rates between 2 and 20 individuals per 100,000, because these suicide rates were more common than higher rates, and then I calculated the frequency of the variables, which included the counts and percentages of each of the variables' constituents.
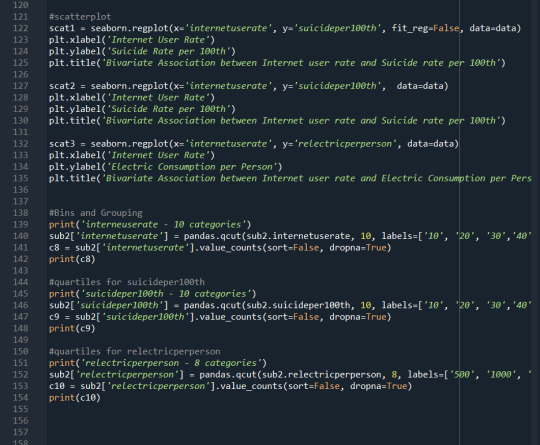
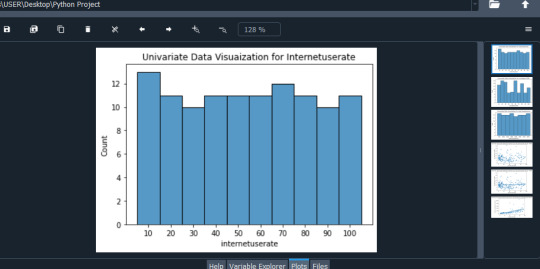
In addition, I built the code to explain each of the variables, including their mean values, standard deviations, minimum and maximum values, and percentile distributions for the 25th, 50th, and 75th percentiles. These descriptions provided me with an overview of the data distributions. To illustrate additional correlation between the variables, I established groups of 10 for the Internet User Rate (internetuserate) and Suicide Rate per 100,000 People (suicideper100th) variables, as well as a group of 8 for the Residential Electricity Consumption Rate per person (relectricperperson). Following that, I created the code to display a univariate graphical representation of each variable. This revealed the following:
1. Although Internetuserate has a modal class of 10, the data distribution in the variable is uniform on average.
2. Suicideper100th contains two modal classes, each with a count of 16 persons: 20 and 60 in every 100 000 people. The chart's spread was also devoid of any discernible pattern.
3. Relectricperperson revealed a nearly uniform distribution, but three major classes: 500kWh, 2000 kWh, and 4000 kWh per person per year.
I did a bivariate analysis between my variables of choice after the univariate data visualization to highlight the relationship between them. The sparsely scattered points on the graph, as well as the line of a very minor and practically imperceptible slope that is almost straight, indicated that, while the internetuserate may be changing, it had no major effect on the suicide rate. On the other hand, the densely packed points and the positively sloped line that showed the relationship between the electric consumption per person and the internet user rate, on the other hand, revealed a very close relationship in the bivariate graph between the electric consumption per person and the internet user rate. This meant that as energy consumption per person increased, so did the percentage of residents in the study countries who used the internet.
Conclusion
Based on the preceding facts, it can be concluded that there is no correlation between the number of citizens who use the internet and a country's suicide rate. This could also imply that there are a variety of other factors at play when it comes to suicide rates in different countries. Also extracted from the data is the conclusion that, while an individual's electricity consumption rate impacts their internet usage rate, it has no effect on their suicide rate.
Recommendation
I urge that other potential reasons of suicide, such as income per person (Incomeperperson), be explored to determine if there are any strategies to lower suicide rates based on the observations and conclusions taken from the data.
Please, find attached, the pictures that show the codes, outputs and the graphs generated from my analysis
0 notes
Text
Program for getting information on user input in HTML
Visit our site for free project source codes-- dailyaspirants.com
.
.
Follow @dailyaspirants for more content on website development, programming languages like Python, PHP, SEO, Free tools..etc.
#pythonhub#pythonprogramming#python3#programming#pythonprojects#pythonbeginner#coding#chatgpt#AI#codingforkids#CodingisFun#codinglife#html#html5#css#Code#dailyaspirants#numpy
0 notes
Text
youtube
#pythonbeginner#python#pythoncourse#pythontutorial#programming#software#coding#tutorial#online tutoring#Youtube
1 note
·
View note
Photo

Python is the best language for express logic/expression in short. #pythonbeginner #python3 #pythonprogramming #pythoncode #pythonbasics #pythonaddict #pythonlearning #pythonlearningcourse #pythonprogramminglanguage #python #pythonforbeginners #pythonfordatascience #pythonquotes #pythonforkids #pythonforsale #pythonforfinance #coding #codingbootcamp #codingmemes https://www.instagram.com/p/CG3_xXmgKLe/?igshid=1fy4mtm4klv11
#pythonbeginner#python3#pythonprogramming#pythoncode#pythonbasics#pythonaddict#pythonlearning#pythonlearningcourse#pythonprogramminglanguage#python#pythonforbeginners#pythonfordatascience#pythonquotes#pythonforkids#pythonforsale#pythonforfinance#coding#codingbootcamp#codingmemes
0 notes
Photo

Data Structures that all programmers should know 🔁Use #openprogrammer in your Awesome code-related content and get a free feature. 👉 Follow @openprogrammer for more educational content ❤️ Don't Forget To Like ♥️ | Share 📲 | Save 📥 🔛Turn On Your Post Notifications🔔 #knowprogram #programming #python3 #computerscience #computerprogramming #programminglanguage #programminglanguages #coders #fullstack #programmingislife #programmingquotes #machinelearning #programmerindonesia #codingbootcamp #html #programminglife #learnpython #pythonprogrammer #pythondeveloper #fullstackdev #codingchallenge #codingquotes #webdevelopment #pythonprogram #pythontutorial #programmingtutorial #datatype #pythondev #pythonbeginner https://www.instagram.com/p/CirdcWbPNmL/?igshid=NGJjMDIxMWI=
#openprogrammer#knowprogram#programming#python3#computerscience#computerprogramming#programminglanguage#programminglanguages#coders#fullstack#programmingislife#programmingquotes#machinelearning#programmerindonesia#codingbootcamp#html#programminglife#learnpython#pythonprogrammer#pythondeveloper#fullstackdev#codingchallenge#codingquotes#webdevelopment#pythonprogram#pythontutorial#programmingtutorial#datatype#pythondev#pythonbeginner
2 notes
·
View notes
Link
In this article, we are going to learn about Linear Regression
Let’s first understand what Machine Learning is. It is a technique by which systems like computers are able to learn and adapt without any explicit knowledge given, by utilising the algorithms and some models to study and get information from the data. In a broader sense, it is a branch of Artificial Intelligence. Highly used product, Alexa is based on data and Machine learning which supports its usage in today’s world.
Linear Regression is a supervised machine learning algorithm that works on the principle of straight line. As by its name, it is a regression technique where output has no labels defined. The goal here is to predict the continuous range/values. Example: stock price, house price etc. Here we can’t predict discrete values, hence regression is used.
Similarly, in Linear regression a continuous spectrum of output is predicted by the model that has values nearer to the actual output. In this algorithm, a small amount of the big data is given to train it and learn the attributes so that when the rest of the data is given to it, outputs can be predicted accordingly.
Linear regression assumes that there is a linear relationship between the input data(x) and output data(y).
Features are the independent variables of the dataset that can be represented by x1, x2, x3, x4… xn, where n is the number of total features.
Hence, the linear relationship between the x and y can be shown as :
Y = m1x1 + m2x2 + m3x3 + … + mnxn + b
Where Y is the output, m are the parameters and b is the intercept of line
When we pass the training data to the algorithm it somehow tries to learn these parameters and the value of b to find the best fit line to get the minimum errors and predict the output of testing data. The smaller the error, the greater is the accuracy of the regression model.
visit us: www.getexcelsior.com
1 note
·
View note
Last Seen Blogs

gmlocg
The Grandmaster List Of Computer Games

dommenology
Are you scared?

climaxbattles
transgender failson extraordinaire

heartlaboratory
Heart Laboratory

macithemaci
I Can’t Talk To Girls Cause Im Now Dating A Boy