#Planet
Text

Dynamic Clouds of Carina Nebula © ESO
#carina nebla#infrared#space#astrophotography#solar system#universe#night sky#stars#astronomy#ESO#cosmos#galaxy#planet
378 notes
·
View notes
Text
The air is not a random bunch of gases simply drawn to earth by the earth's gravity, but an elixir generated by the soils, the oceans, and the numberless organisms that inhabit this world, each creature exchanging certain ingredients for others as it inhales and exhales, drinking the sunlight with our leaves or filtering the water with our gills, all of us contributing to the composition of this phantasmagoric brew, circulating it steadily between us and nourishing ourselves on its magic, generating ourselves from its substance. It is as endemic to the earth as the sandstone beneath my boots. Perhaps we should add the letter i to our planet's name, and call it "Eairth," in order to remind ourselves that the "air" is entirely a part of the earth, and the i, the I or self, is wholly immersed in that fluid element.
David Abram, Becoming Animal: An Earthly Cosmology
#quote#David Abram#Abram#ecology#nature#Earth#air#cosmology#environment#planet#landscape#philosophy#ecosystem#Becoming Animal
89 notes
·
View notes
Text

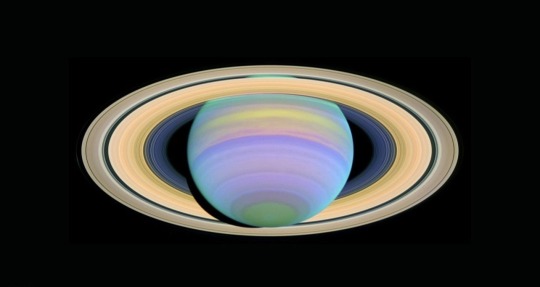
Planets: Neptune
Neptune controls Pluto's orbit. Neptune is the bully of that neighborhood.
#mike brown#neptune#Neptune planet#Planet Neptune#neptune astrology#Neptune astronomy#planets#Planet#astrology#astronomy#Space#outer space#space exploration#space aesthetic#space moodboard#nature#Planet aesthetic#Planet moodboard#aesthetic#moodboard#space lovers#space core#space is cool#spacecore#Neptune aesthetic#astrology aesthetic#astronomy aesthetic#astrology planets
21 notes
·
View notes
Text
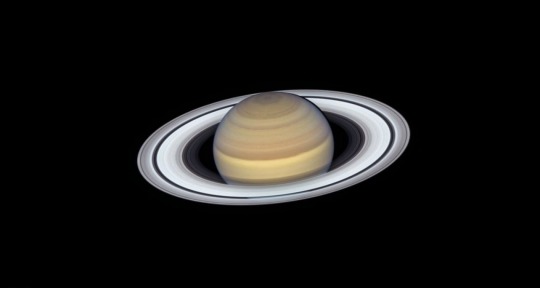
Saturn by NASA (2019
20K notes
·
View notes
Text
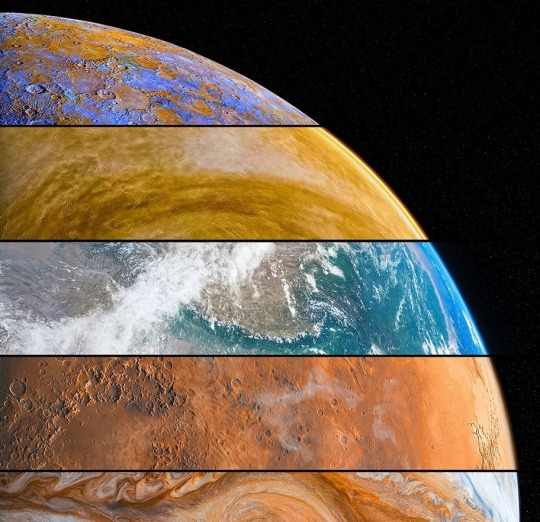
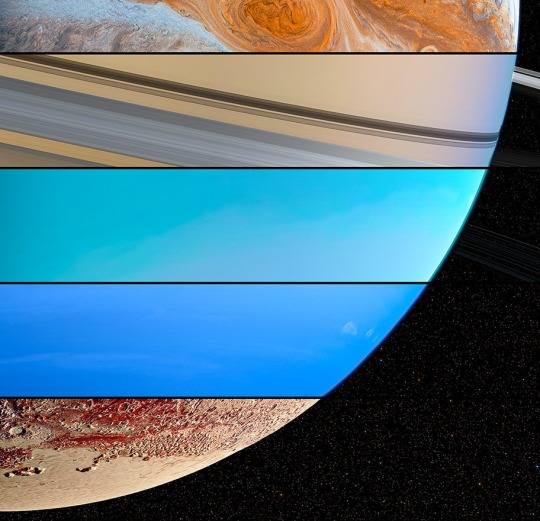
Solar System Planets including Pluto aligned in a planet shape
Credit: Ika Abuladze
#space#astronomy#pluto#jupiter#saturn#saturno#mars#marte#neptune#netuno#uranus#urano#earth#terra#planet#venus#mercury
18K notes
·
View notes
Text
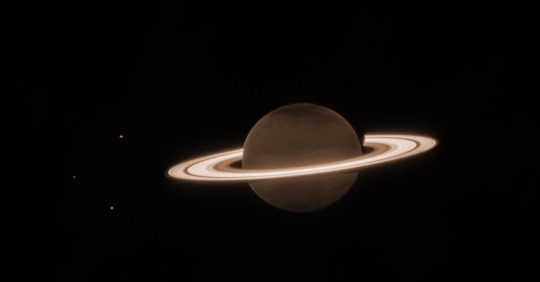
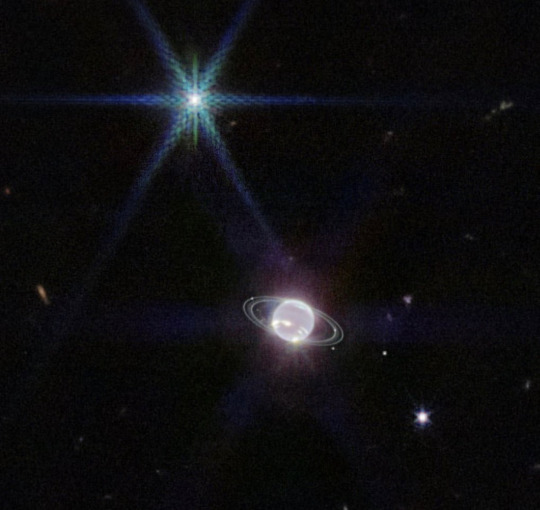
NASA releases the clearest images of Neptune’s rings in over 30 years

#Neptune#him!!!#(usually I say pretty things are girls but Neptune in Roman mythology is a boy so-)#nasa#planets#planet#galaxy#solar system#stars#space#astronomy#astrology#hubble telescope#tags#popular#trending#tumblr#universe#moon#Hubble#telescope#aesthetic#space aesthetic#cosmos#galaxies#comet#asteroid#constellation#sky#james webb space telescope
56K notes
·
View notes
Text
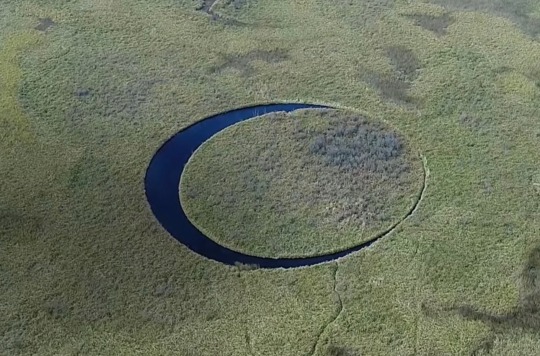

El Ojo ‘The Eye’ Island Location: Buenos Aires, Argentina
First discovered by Argentinian filmmaker Sergio Neuspiller in 2003, El Ojo is an uninhabited circular rotating floating island located within a slightly larger circular lake in the Paraná Delta in the Buenos Aires Province, Argentina. This island is constantly rotating on its own axis due to the flow of the river beneath it. The island was named because of its resemblance to an eye when viewed from above: as the island rotates within its surrounding circular lake, the eye appears to move.
#buenos aires#argentina#water#physics#planet#planet earth#nature#science#sciencecore#interesting#aesthetic#earth#eye#eyecore#weirdcore#weird#phenomenon#weird phenomenons#strange#places#google earth#weird places#weird stuff#watercore#lakes#lake#water aesthetic#nature aesthetic#geography#illusions
6K notes
·
View notes
Text
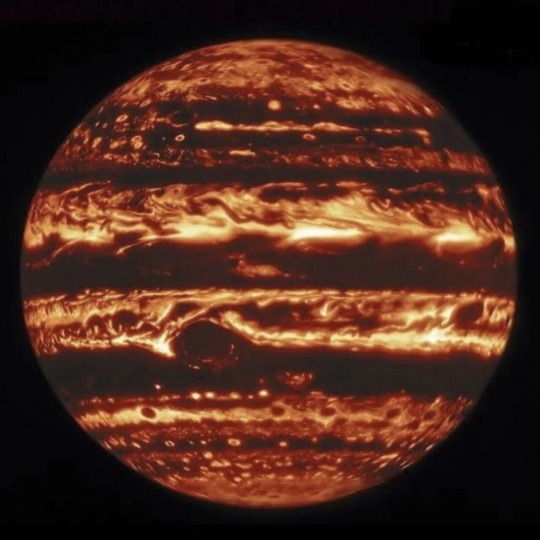
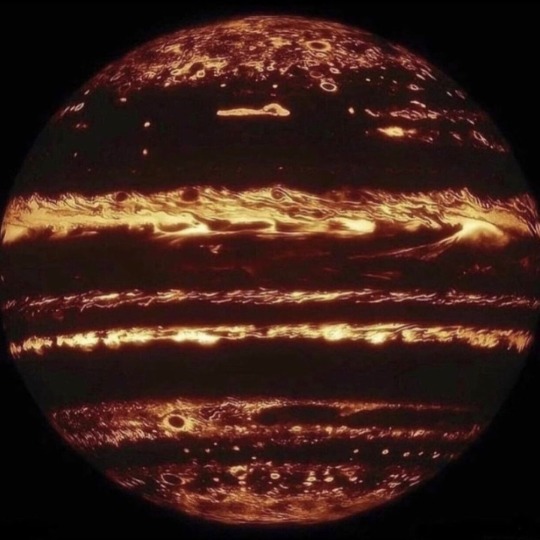
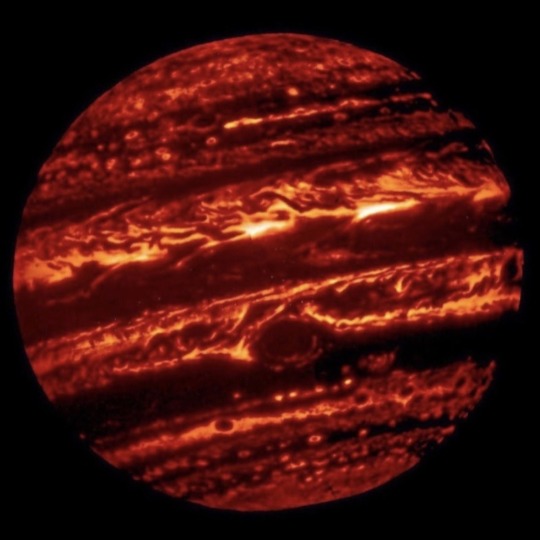
Clearest picture of Jupiter, from Earth. Isn't she beautiful? Actually hundreds of photos taken by the Gemini North Telescope in Hawaii, compiled to produce the infrared snap in order to see beyond Jupiter’s hazy atmosphere.
#aesthetic#jupiter#space#astronomy#astrophotography#w-o-w#photography#tale#gemini#observatory#nasa#planet
13K notes
·
View notes
Text

Stardust From Comet Halley Falls To Earth
#astronomy#night#sky#space#stars#nasa#science#universe#nebula#galaxy#Stardust#Earth#Comet Halley#Planet
8K notes
·
View notes
Text


New IKEA AFTONSPARV plush line
#plush#plushie#plushies#plushblr#plushcore#toycore#soft toy#stuffed animals#ikea#ikea plush#aftonsparv#alien#cat#rabbit#bear#ufo#planet#plush: alien#plush: vehicle#plush: object#plush: planet#plush: cat#plush: rabbit#plush: bear#plush: astronaut
6K notes
·
View notes
Text

7K notes
·
View notes
Text

M102: Edge-on Disk Galaxy
#space#hubble telescope#astrophotography#galaxy#planet#stars#night sky#solar system#nasa#cosmos#spindle galaxy#astronomy
393 notes
·
View notes
Text

✨The Beauty of Jupiter ✨
#gifs (edits) made by me :)#assassin1513#space#space vibes#space aesthetic#jupiter#planet#planets#james webb#james webb first full colour image#james webb space telescope#james webb update#james webb deepest sharpest view of universe#webb#james webb telescope#james webb images#solar system#astrology#astronomy#nasa#beyond the stars#stars#infinity#jupiter planet#glitter#outer space#void#space art#magic#vincent van gogh
52K notes
·
View notes
Text
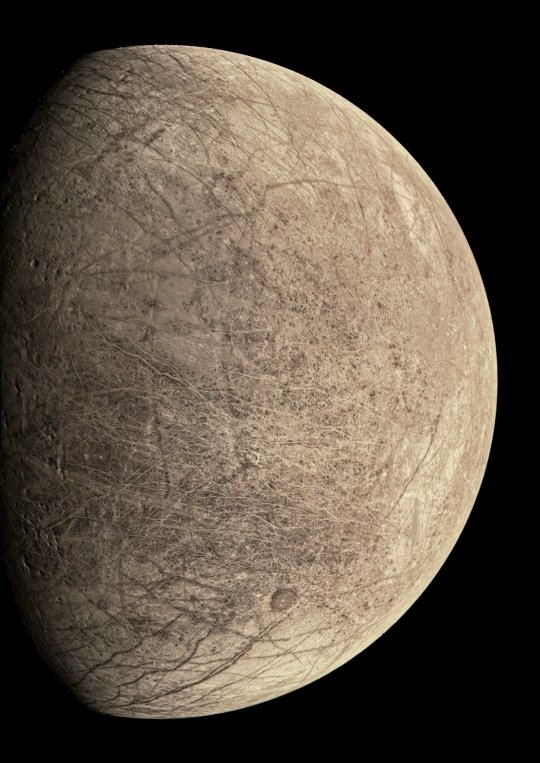
NASA has released new images of Jupiter's moon Europa captured by the Juno spacecraft.
#jupiter#europa#space#astrophotography#astronomy#universe#galaxy#galaxies#nasa#astro#astronout#astrology#nasa breaking news#nasa picture of the day#telescope#astrophysics#astroloji#astrologer#planet#planets
3K notes
·
View notes
Text
Six Answers to Questions You’re Too Embarrassed to Ask about the Hottest Year on Record
You may have seen the news that 2023 was the hottest year in NASA’s record, continuing a trend of warming global temperatures. But have you ever wondered what in the world that actually means and how we know?
We talked to some of our climate scientists to get clarity on what a temperature record is, what happened in 2023, and what we can expect to happen in the future… so you don’t have to!
1. Why was 2023 the warmest year on record?
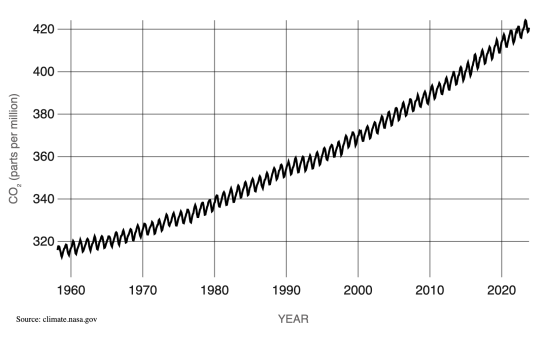
The short answer: Human activities. The release of greenhouse gases like carbon dioxide and methane into the atmosphere trap more heat near Earth’s surface, raising global temperatures. This is responsible for the decades-long warming trend we’re living through.
But this year’s record wasn’t just because of human activities. The last few years, we’ve been experiencing the cooler phase of a natural pattern of Pacific Ocean temperatures called the El Niño Southern Oscillation (ENSO). This phase, known as La Niña, tends to cool temperatures slightly around the world. In mid-2023, we started to shift into the warmer phase, known as El Niño. The shift ENSO brought, combined with overall human-driven warming and other factors we’re continuing to study, pushed 2023 to a new record high temperature.
2. So will every year be a record now?
Almost certainly not. Although the overall trend in annual temperatures is warmer, there’s some year-to-year variation, like ENSO we mentioned above.
Think about Texas and Minnesota. On the whole, Texas is warmer than Minnesota. But some days, stormy weather could bring cooler temperatures to Texas while Minnesota is suffering through a local heat wave. On those days, the weather in Minnesota could be warmer than the weather in Texas. That doesn’t mean Minnesota is warmer than Texas overall; we’re just experiencing a little short-term variation.
Something similar happens with global annual temperatures. The globe will naturally shift back to La Niña in the next few years, bringing a slight cooling effect. Because of human carbon emissions, current La Niña years will be warmer than La Niña years were in the past, but they’ll likely still be cooler than current El Niño years.
3. What do we mean by “on record”?
Technically, NASA’s global temperature record starts in 1880. NASA didn’t exist back then, but temperature data were being collected by sailing ships, weather stations, and scientists in enough places around the world to reconstruct a global average temperature. We use those data and our modern techniques to calculate the average.
We start in 1880, because that’s when thermometers and other instruments became technologically advanced and widespread enough to reliably measure and calculate a global average. Today, we make those calculations based on millions of measurements taken from weather stations and Antarctic research stations on land, and ships and ocean buoys at sea. So, we can confidently say 2023 is the warmest year in the last century and a half.
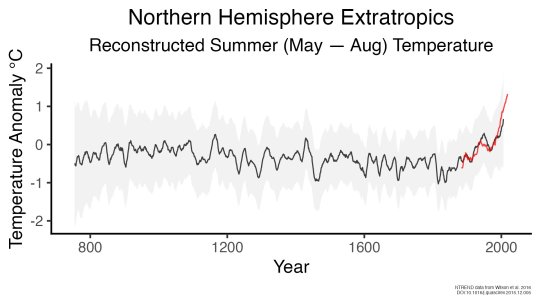
However, we actually have a really good idea of what global climate looked like for tens of thousands of years before 1880, relying on other, indirect ways of measuring temperature. We can look at tree rings or cores drilled from ice sheets to reconstruct Earth’s more ancient climate. These measurements affirm that current warming on Earth is happening at an unprecedented speed.
4. Why does a space agency keep a record of Earth’s temperature?
It’s literally our job! When NASA was formed in 1958, our original charter called for “the expansion of human knowledge of phenomena in the atmosphere and space.” Our very first space missions uncovered surprises about Earth, and we’ve been using the vantage point of space to study our home planet ever since. Right now, we have a fleet of more than 20 spacecraft monitoring Earth and its systems.
Why we created our specific surface temperature record – known as GISTEMP – actually starts about 25 million miles away on the planet Venus. In the 1960s and 70s, researchers discovered that a thick atmosphere of clouds and carbon dioxide was responsible for Venus’ scorchingly hot temperatures.
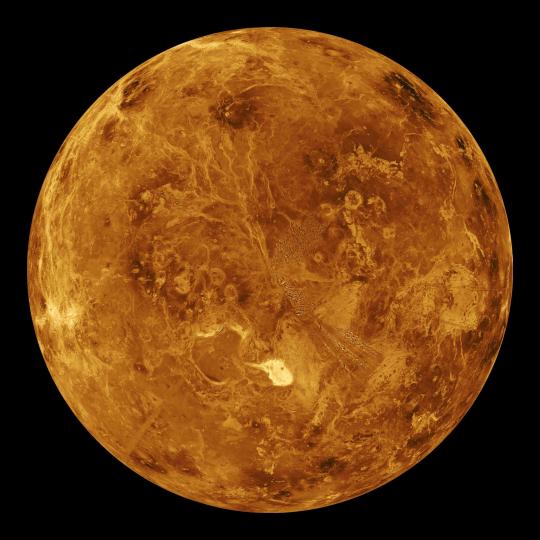
Dr. James Hansen was a scientist at the Goddard Institute for Space Studies in New York, studying Venus. He realized that the greenhouse effect cooking Venus’ surface could happen on Earth, too, especially as human activities were pumping carbon dioxide into our atmosphere.
He started creating computer models to see what would happen to Earth’s climate as more carbon dioxide entered the atmosphere. As he did, he needed a way to check his models – a record of temperatures at Earth’s surface over time, to see if the planet was indeed warming along with increased atmospheric carbon. It was, and is, and NASA’s temperature record was born.
5. If last year was record hot, why wasn’t it very hot where I live?
The temperature record is a global average, so not everywhere on Earth experienced record heat. Local differences in weather patterns can influence individual locations to be hotter or colder than the globe overall, but when we average it out, 2023 was the hottest year.
Just because you didn’t feel record heat this year, doesn’t mean you didn’t experience the effects of a warming climate. 2023 saw a busy Atlantic hurricane season, low Arctic sea ice, raging wildfires in Canada, heat waves in the U.S. and Australia, and more.
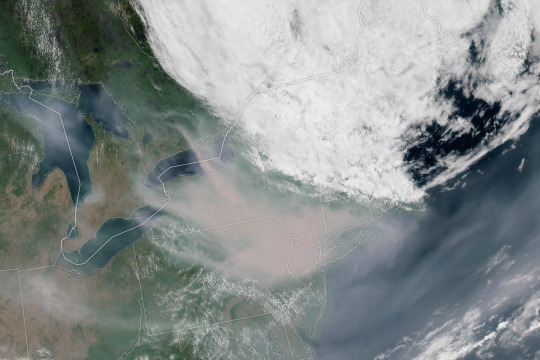
And these effects don’t stay in one place. For example, unusually hot and intense fires in Canada sent smoke swirling across the entire North American continent, triggering some of the worst air quality in decades in many American cities. Melting ice at Earth’s poles drives rising sea levels on coasts thousands of miles away.

6. Speaking of which, why is the Arctic – one of the coldest places on Earth – red on this temperature map?
Our global temperature record doesn’t actually track absolute temperatures. Instead, we track temperature anomalies, which are basically just deviations from the norm. Our baseline is an average of the temperatures from 1951-1980, and we compare how much Earth’s temperature has changed since then.
Why focus on anomalies, rather than absolutes? Let’s say you want to track if apples these days are generally larger, smaller, or the same size as they were 20 years ago. In other words, you want to track the change over time.
Apples grown in Florida are generally larger than apples grown in Alaska. Like, in real life, how Floridian temperatures are generally much higher than Alaskan temperatures. So how do you track the change in apple sizes from apples grown all over the world while still accounting for their different baseline weights?
By focusing on the difference within each area rather than the absolute weights. So in our map, the Arctic isn’t red because it’s hotter than Bermuda. It’s red because it’s gotten relatively much warmer than Bermuda has in the same time frame.
Want to learn more about climate change? Dig into the data at climate.nasa.gov.
Make sure to follow us on Tumblr for your regular dose of space!
3K notes
·
View notes
Text
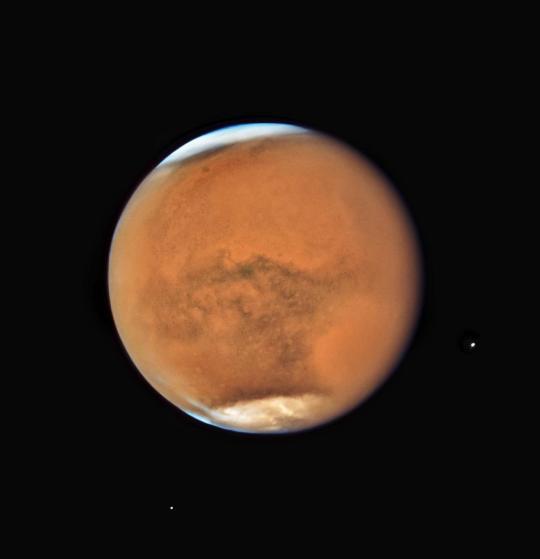
Stormy Mars in opposition in 2018
Credits: NASA, ESA, and STScI
3K notes
·
View notes
Last Seen Blogs

onbrokenglass
show me the glint of light

mebutlikeold
Bayli Kate

loseyourselftodaft
Humanafterall

jakefixitmartins-blog
we're right here

maximumwerewolftaco-blog
Untitled