#Free Power BI User Group
Text
A message to Twitter users coming to tumblr: a message from your local duel-hellsite citizen
So, I’ve seen a ton of Twitter users talking about making and sharing their new tumblr blogs, to escape Elon Musk’s “anti censorship” bullshittery. First of all: welcome! I know it’s looking bleak over there; especially for trans people. But, now that you’re here, I’m here to tell you all about tumblr etiquette, how this website works, and how it’s different from Twitter. Because you can’t come onto here acting like it’s Twitter, lest The Beast get to you.
First, here are a small handful of tips and tumblr facts!
Your likes and who you are following are automatically set to public. You can make them private in your settings!
You can block tags from the settings, too.
There are lots of bots on here. If you’re not careful, you could be mistaken for one! The main way you can avoid this is changing your icon and header from the defaults. Adding a bio helps too!
You can queue and schedule posts so that your account posts throughout the day.
Like Twitter, tumblr has a radical feminist and TERF problem. However, they’re pretty easy to spot. There are lots of guides out there to help you learn how to spot tumblr TERFs!
Tumblr, for the most part, does not have any celebrity or brand accounts.
Your tumblr follower count is private.
You can have multiple accounts with the same email, and they’re very easy to switch between! These are called “sideblogs”.
Your main page is not a “timeline”. It is a “dashboard”!
You can have a custom desktop theme using HTML! Think like ye olde MySpace days. There are tons of pre-made tumblr themes available, if you’re not already proficient in HTML; including free ones!
Now, let’s talk tumblr etiquette and how it’s different from Twitter. You’re a tumblr user now! It’s time to start acting like it!
Don’t just like posts. They don’t increase visibility whatsoever. The way that you can help posts that you like is reblogging them to your blog. Especially for art!
We don’t say “oomfs” or “oomfies”. Just “mutuals” is fine, thanks!
Adding onto a post with pointless comments is frowned upon. If all you have to say is “this is so true,” or something else to that effect, you should put that in the tags of your reblog.
Most people don’t have carrds or rentries on here. Some of us do, but it’s not an obligation like it is for Twitter.
Similarly, we don’t censor words like “die” and “death”. Posts about wanting to brutally murder people in power go viral all the time, and it’s completely allowed. I’m serious! Enjoy your newfound freedom!
Blocking isn’t a big deal here. Get rid of any weird notion you have that morality is linked to blocking certain people.
But lastly, and most importantly:
Drop your discourse at the door.
If you try to post about most of the things that Twitter users discourse about, you will be laughed off the site. Especially Twitter LGBT+ discourse. Posts actively mocking topics of Twitter discourse go viral on here regularly.
Tumblr has mostly healed since its discourse-ridden days, and it’s now much more chill. Of course, discourse still happens, but it is so easy to avoid now. For a lot of us, tumblr is the last pleasant social media site left, so don’t ruin it.
Here is a list of discourse-related things that tumblr users don’t do:
Most of us don’t do callout posts, unless it’s something actually serious (like that one blog that had a human slave).
Everything that you heard on Twitter was “exclusive” to certain LGBT+ groups is used by just about everyone on here. Bi women use the double venus symbol on here. You’ll just have to learn to live with that.
In particular, I want to emphasize how much we don’t do flag discourse. To the point that somebody caring about flag discourse of any kind is how we tend to identify an ex-Twitter user.
On here, you will never have to see another slur discourse post again, unless you actively seek it out.
You’re free.
You’re welcome. And enjoy your time on here! If you have the time, please consider watching StrangeÆons’ Tumblr Etiquette Manual on YouTube, as well.
16K notes
·
View notes
Text

#IMAGINARIANISMS. an independent, private & selective multiera, multigenre, multifandom, multimuse, multiship & multiverse aesthetic, worldbuilding ask/rp blog featuring both canon & original characters of naruto, gangsta., a song of ice & fire/game of thrones/house of the dragon, the walking dead, & more. predominantly headcanon & exomemory based with both canon divergency & canon compliancy. sporadic activity; predominantly discord based & mutuals only. non-spoiler free. 15+ years rp experience. alternate universe, crossover, group rp, canon compliant, canon divergent, original character & fandomless character friendly. previously dominusornatum; originally established in 2019, archived in 2020 & restarted in 2023. haunted by angel / arcana & the imaginarians galaxy system.
a 𝖘𝖙𝖚𝖉𝖞 on abandonment, trauma, madness, the nurturing of others when one never received it for oneself, gender, queerness, indigeneity, disability, neurodivergency, alterhumanity, plurality, what makes a monster & what makes a human, indigenous spirituality, coming of age, young adulthood, indigenous pessimism, indigenous existentialism, indigenous psychology, holy eldritch abominations, enlightenment, apotheosis, witchcraft, occultism, prophecy, quests, dreams of the future, legacy, knighthood, queer chivalry, flower language, gods & monsters, coming back wrong, collective rage & grief, raw passion & power, the art of dominance, submission, trust & eroticism, sexual exploration, found family, troubled youth, children forced to kill, the corruption of youth, the face of love's rage, women in power, sex workers, cults, human exploitation, god loves you but not enough to save you, all the eyes on you, colonialism, intergenerational trauma, indigenous historical trauma, having faith in humanity despite everything, all my relations, the lengths you're willing to go for the ones you love, wars in the mind, hedonism, glamour, pleasure, desire, wrath, survival, vengeance & justice, undying devotion & unconditional love.
𝐃𝐎𝐒𝐒𝐈𝐄𝐑.
angel / arcana / ansale'wit / ᐋᓐᔐᓃ • 23 • poc; indigenous "canadian"; mixed native & jewish • predominantly transmascfem genderfluid two spirit & intersex bodied • bi; omni; bi/omni vincian/lesbian/enbian; aspec; ambiamorous • any but indigenous & plural pronouns preferred • disabled & neurodivergent; autism, adhd, cfs, pots, stpd, bpd, cptsd, did, etc. • future ambulatory wheelchair user & multipurpose psychiatric service dog handler • multigenic hc-did system host
POINTS OF INTEREST:
MUSES | MINIBIOS | INTEREST CHECKER | SHIPPING & DYNAMIC INTEREST CHECKER (REVAMPING) | MUSE SHIPPING AVAILABILITY (REVAMPING) | OPEN STARTERS | PERMANENT STARTER CALL | MEMES | WISHLIST | INTERMUSE CONNECTIONS | PINTEREST | SPOTIFY

𝐑𝐔𝐋𝐄𝐒 𝐀𝐍𝐃 𝐓𝐀𝐆 𝐒𝐘𝐒𝐓𝐄𝐌.
• Please be 20+ to access any of the content here, ty!!✨
• Absolutely no discourse, bigotry nor fakeclaiming of any kind is tolerated here, nor are any debates or drama or callout posts. This is our& personal space. Do not waste our& time.
• Affiliated with @creolejesus & @familiarblood / @stillgcod & @loyalpromise & @dethdvncer & @velcryons / @brokcncrowns !!
𝐁𝐘𝐅 . . .
• Predominantly beta editor & dashboard user; i'm& still working on the finer details of everything as in actually setting up things but please feel free to inquire about our& muses, we& have plenty! <333
• Read rules before interaction please & thank you!
• This blog is run by a system of color, please be respectful of all of us& & understand that because of this the overwhelming vast majority of our& roster are muses of color, specifically indigenous muses of color, this blog is mostly run by me& but there will be times when my& system members post or possibly even rp as themselves, so if you believe we are faking having did or our plurality as a whole & our& experiences around it, if you do not enjoy any of our& presences while you may do with another or mine&, if you ignore my& system members just to only speak to me& or you are not comfortable with us& often making posts / mentions relating to did, plurality & each other, block us& & move on. our& traumas & copings for them are just as real as we& are, & everyone in the system deserves to & should have the equal amount of respect, love, dignity, honor, care & undivided attention. we& will not tolerate any bullshit from anyone, so if that's something that intimidates you i& suggest you either check your internalized ableism & pluralphobia & learn to do better or leave!!
𝐃𝐍𝐈 𝐈𝐅 . . .
General DNI criteria, just... basic things like minors, bigots, racists, -phobes, ableists, sanists, antisemites, if you're going to drag us& into any kind of discourse, y'all get it. hopefully.
#navigation.#indie rp#do not reblog.#personals dni.#indiesofcolor#asoiaf rp#naruto rp#gangsta rp#black lagoon rp#no.6 rp#harry potter rp#twilight rp#twdg rp#the hunger games rp#euphoria rp#btvs rp#horror rp#fantasy rp#animanga rp#fandomless rp#thg rp#supernatural rp#oc rp
4 notes
·
View notes
Text
beginning the oc introductions, you know them, you love them (derogatorily), you hate them (affectionately), it'ss
VESPERRRRRRRR
pronouns: they/them
sexual and romantic orientation: bisexual aromantic (i have so many bi aro ocs aroallos are the coolest)
age: 20
source: D&D game "War in Heaven"
Famously (totally, i know y'all care so much) depicted in both my profile picture and username, Vesper is a stupid bitch, which is to say they are actually rather smart, just horrible at communicating and probably barely passed elementary school. But, they do make good decisions, at least better than their party members, who think it's a good idea to get on the bad side of every single god or even remotely powerful entity we meet. A thief by trade and an absolute failure in 90% of social interactions, this lying asshole was hired by one Lady Sergia Angela to find the person murdering magic users around the city, and it only went downhill from there. It started with five relatively incompetent private investigators tracking down one fucked up murderer to only now four of these five facing the end of the world and becoming known as the Godslayers, though they did only murder one god, they just did it three times. Through these horrors, Vesper met the completely lovely goddess of Justice, Nielené, who was secretly not very lovely and ended up abusing Vesper once they displayed their horrible communication skills and didn't tell the party the important lore information that she gave them. At one point, she even stole control of Vesper's vocal chords to say slurs. But that didn't stop our little rat (canon phrase used to refer to them) from desperately wanting her approval, ending in Vesper freeing her from the sword she had been trapped in and then betraying her with the group. They delivered her the artefacts she needed to be freed and do you know what they got in response? A nod. Not even a fucking thank you, just a nod. Since then, Vesper has continued having shit communication skills with their companion and lies constantly, especially about that one time they freed one of Nielené's angels, but we don't talk about that, they just went on a walk. Maybe the group would know more about Vesper and their current thought process if THEY tried talking to them, because it's not like Vesper is the kind of person to go around sharing their personal shit, because they fucking wouldn't. Maybe they'd know why Vesper started stealing, why Vesper took the job from Sergia despite being a god awful private investigator, why Vesper lies, and maybe they'd even actually open up about their trauma and what exactly happened with Nielené. But it's not like anyone's going to do that, so I can't actually talk about all that in this post.
2 notes
·
View notes
Text
Power bi learn online
Learning Power BI can be an exciting journey! Here's a step-by-step guide to get you started:
Understand the Basics: Familiarize yourself with the core concepts of Power BI, such as data sources, data modeling, visualization, and sharing reports. You can find introductory materials on the official Microsoft website or through beginner courses on platforms like Udemy or Coursera.
Install Power BI Desktop: Download and install Power BI Desktop, which is a free desktop application used for creating Power BI reports and dashboards. You can get it from the Microsoft website.
Explore Sample Data: Start by exploring the sample datasets provided within Power BI Desktop. This will help you understand how data is structured and how different visualizations can be created.
Learn Data Modeling: Understand the process of data modeling in Power BI, including creating relationships between tables, defining measures using DAX (Data Analysis Expressions), and optimizing data models for performance.
Create Visualizations: Experiment with creating different types of visualizations like bar charts, line charts, pie charts, maps, and more. Learn how to customize these visualizations to effectively communicate insights from your data.
Master DAX: DAX (Data Analysis Expressions) is the formula language used in Power BI for creating calculated columns, measures, and calculated tables. Invest time in learning DAX functions and their usage to perform advanced calculations and analysis.
Practice with Real Data: Start working with your own datasets or find publicly available datasets to practice your skills. Real-world data will help you understand the challenges and nuances of data analysis in a practical context.
Explore Advanced Features: Once you're comfortable with the basics, explore advanced features of Power BI such as Power Query for data transformation, custom visuals, and integrating with other Microsoft services like Azure and Excel.
Join the Community: Engage with the Power BI community through forums, user groups, and social media channels. Participating in discussions, asking questions, and sharing your knowledge will help you learn and grow faster.
Continuous Learning: Power BI is constantly evolving with new features and updates. Stay updated with the latest developments by following official Microsoft announcements, attending webinars, and reading blogs from industry experts.
0 notes
Text
In-depth Guide To Ai Consulting & Prime Consultants In 2023
Dashboard in a Day Workshop demonstrates tips on how to create, share and publish reports for a variety of business use instances using Power BI. Receive our newsletters that ship thoughtful insights on rising trends. With help from IBM Consulting, Water Corporation is using automation to maintain each data and water flowing. AI analyzes monetary trends, providing accurate predictions to aid in strategic planning and investment selections. Transform operations, cut back manual efforts, and set new efficiency benchmarks. Discover the latest expert-compiled considering and trade insights about AI.
ai business consultation
Additionally, AI Consulting can help companies navigate the complexities of AI governance and ethics. It’s automating routine tasks, augmenting human capabilities, and creating new roles and industries. Understanding these adjustments may help you information businesses on the method to prepare for and leverage these transformations. From workforce planning to strategic funding in AI applied sciences, you’ll be equipped to provide knowledgeable recommendation to businesses navigating the future of work. In a climate the place AI redefines entire industries in a single day, strategic steering is imperative.
It presents insights into 3.7M+ rising companies and over 20K technologies, revealing market dynamics and enabling you to remain ahead in innovation. The platform streamlines the process of discovering and analyzing new business opportunities. Notable initiatives by SoluLab embody implementing AI-driven personalization algorithms for an e-commerce firm, resulting in increased conversion charges and customer satisfaction.
However, their huge focus is on serving to teams explore and perceive the possibilities of AI earlier than aiding groups in training their workers and testing out new purposes. They boast access to four,000 business experts and over 1,000 data science and information engineering technologists. What’s more, they've completed more than 10,000 AI-related projects in the earlier few years.
ai consultation
For us and a lot of executives we’ve spoken to just lately, getting into one immediate into ChatGPT, developed by OpenAI, was all it took to see the power of generative AI. In the first five days of its launch, greater than one million users logged into the platform to experience it for themselves. OpenAI’s servers can barely keep up with demand, often flashing a message that users must return later when server capability frees up. Compared to the prior two performs, the Invent play has limited implications for the overall workforce. Small, devoted incubation teams—fast-moving, nimble—are ideally sized to invent new fashions. Once a model begins delivering worth, you’ll know what staffing needs to worry about as the project is scaled.
#ai consulting#artificial intelligence consulting#ai consulting services#ai strategy consulting#ai business consulting#ai consultation#ai business consultation#ai consulting business
1 note
·
View note
Text
SAP SUCCESSFACTORS ACTIVE DIRECTORY INTEGRATION

SAP SuccessFactors and Active Directory: Streamlining User Management
In today’s enterprise landscape, managing user identities often involves multiple systems. This can lead to inconsistencies, administrative overhead, and potential security risks. Integrating SAP SuccessFactors, a leading cloud-based Human Capital Management (HCM) suite, with Microsoft Active Directory (AD) addresses these challenges, offering a centralized approach to managing user accounts.
Why Integrate SAP SuccessFactors with Active Directory?
Enhanced Security: A single source of truth (AD) for user data promotes security, allowing administrators to enforce consistent password policies and access controls across systems.
Simplified User Lifecycle Management: Automating user creation, updates, and deactivation between AD and SuccessFactors reduces manual effort and potential errors.
Improved User Experience: Single sign-on (SSO) capabilities allow users to access SuccessFactors and other AD-linked applications with single credentials.
Reduced IT Workload: Streamlining user management processes frees IT resources to focus on strategic initiatives.
Methods for SAP SuccessFactors – Active Directory Integration
There are several ways to achieve this integration, each with its nuances:
Microsoft Azure AD Connect: This tool synchronizes user accounts from on-premises AD to Azure Active Directory. If your SuccessFactors instance utilizes Azure AD for authentication, this provides a seamless bridge for user management.
SAP Cloud Integration (CPI): CPI is a powerful middleware platform from SAP that facilitates communication between SuccessFactors and various systems. CPI allows custom integrations for scenarios requiring advanced data mapping or transformations to connect with AD.
Third-Party Provisioning Solutions: Several specialized tools offer pre-built connectors and workflows for SuccessFactors and AD integration. These solutions can simplify the process and provide additional features, such as granular access control.
Key Considerations Before You Begin
Authentication Strategy: Align your integration method with your SuccessFactors authentication strategy (e.g., Azure AD, on-premises identity provider).
Data Mapping: Plan the alignment of user attributes between SuccessFactors and Active Directory.
Synchronization Scope: Determine which user groups need to be synchronized – whether all users or specific subsets.
Security and Compliance: Implement safeguards for data in transit and user access permissions, especially when dealing with sensitive employee data.
Steps for SAP SuccessFactors – Active Directory Integration
The specific steps will depend on your chosen integration method. Here’s a high-level overview:
Prepare Active Directory: Ensure your AD environment is well-structured and relevant user attributes are populated.
Configure SAP SuccessFactors: Enable necessary API permissions and prepare SuccessFactors for integration.
Set up Integration Tool: Follow the platform-specific guidelines to configure the integration method (Azure AD Connect, CPI, or a third-party tool).
Implement Synchronization: Define synchronization rules, including data mapping, schedules, and error handling.
Test Thoroughly: Conduct rigorous testing in a staging environment to verify seamless user provisioning and system updates.
Monitor and Maintain: Regularly monitor the integration and address any issues promptly to ensure smooth operation.
Beyond the Basics
Successful integration is only the start. Consider advanced scenarios like:
Bi-directional Synchronization: Implement write-back functionality, allowing changes in AD to reflect in SuccessFactors and further enhance consistency.
Role-Based Access Control (RBAC): Align AD groups with SuccessFactors roles to streamline permission assignment and management.
Embrace a Streamlined Approach
SAP SuccessFactors and Active Directory integration deliver a unified user management experience. By carefully selecting an integration approach and meticulously planning the process, your organization will unlock enhanced efficiency, security, and a better user experience.
youtube
You can find more information about SAP Successfactors in this SAP Successfactors Link
Conclusion:
Unogeeks is the No.1 IT Training Institute for SAP Training. Anyone Disagree? Please drop in a comment
You can check out our other latest blogs on SAP Successfactors here - SAP Successfactors Blogs
You can check out our Best In Class SAP Successfactors Details here - SAP Successfactors Training
----------------------------------
For Training inquiries:
Call/Whatsapp: +91 73960 33555
Mail us at: [email protected]
Our Website ➜ https://unogeeks.com
Follow us:
Instagram: https://www.instagram.com/unogeeks
Facebook: https://www.facebook.com/UnogeeksSoftwareTrainingInstitute
Twitter: https://twitter.com/unogeeks
0 notes
Text
Microsoft Fabric – Meet the powerful, cutting-edge data analytics platform
What is Microsoft Fabric?

Microsoft Fabric is an all-in-one analytics solution for enterprises that covers everything from data movement to data science, Real-Time Analytics, and business intelligence. It offers a comprehensive suite of services, including data lake, data engineering, and data integration, all in one place.
With Fabric, you don’t need to piece together different services from multiple vendors. Instead, you can enjoy a highly integrated, end-to-end, and easy-to-use product that is designed to simplify your analytics needs.
The platform is built on a foundation of Software as a Service (SaaS), which takes simplicity and integration to a whole new level.
SaaS foundation
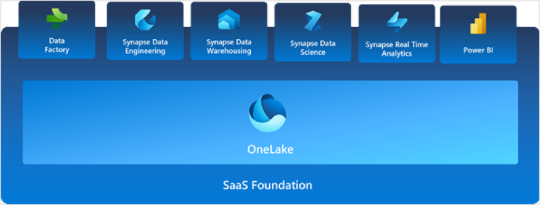
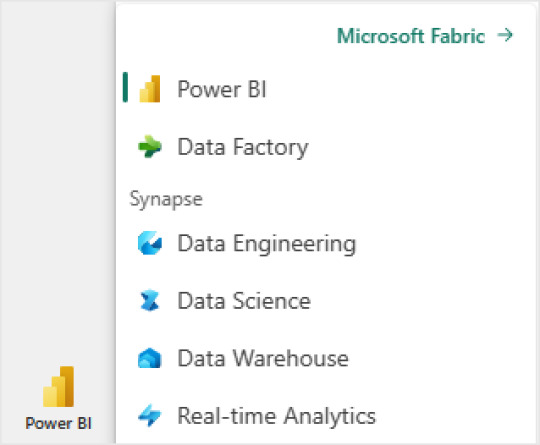
Microsoft Fabric brings together new and existing components from Power BI, Azure Synapse, and Azure Data Factory into a single integrated environment. These components are then presented in various customized user experiences.
Fabric brings together experiences such as Data Engineering, Data Factory, Data Science, Data Warehouse, Real-Time Analytics, and Power BI onto a shared SaaS foundation.
This integration provides the following advantages:
With the Microsoft Fabric SaaS experience, all the data and the services are seamlessly integrated. IT teams can centrally configure core enterprise capabilities and permissions are automatically applied across all the underlying services. Additionally, data sensitivity labels are inherited automatically across the items in the suite.
Fabric allows creators to concentrate on producing their best work, freeing them from the need to integrate, manage, or understand the underlying infrastructure that supports the experience.
Components of Microsoft Fabric
Microsoft Fabric offers the comprehensive set of analytics experiences designed to work together seamlessly. Each experience is tailored to a specific persona and a specific task. Fabric includes industry-leading experiences in the following categories for an end-to-end analytical need.
Fabric brings together all these experiences into a unified platform to offer the most comprehensive big data analytics platform in the industry.
Microsoft Fabric enables organizations, and individuals, to turn large and complex data repositories into actionable workloads and analytics, and is an implementation of data mesh architecture. To learn more about data mesh, visit the article that explains data mesh architecture.
OneLake and lakehouse – the unification of lakehouses
The Microsoft Fabric platform unifies the OneLake and lakehouse architecture across the enterprises.
OneLake
The data lake is the foundation on which all the Fabric services are built. Microsoft Fabric Lake is also known as OneLake. It’s built into the Fabric service and provides a unified location to store all organizational data where the experiences operate.
OneLake is built on top of ADLS (Azure Data Lake Storage) Gen2. It provides a single SaaS experience and a tenant-wide store for data that serves both professional and citizen developers. The OneLake SaaS experience simplifies the experiences, eliminating the need for users to understand any infrastructure concepts such as resource groups, RBAC (Role-Based Access Control), Azure Resource Manager, redundancy, or regions. Additionally, it doesn’t require the user to even have an Azure account.
OneLake eliminates today’s pervasive and chaotic data silos, which individual developers create when they provision and configure their own isolated storage accounts. Instead, OneLake provides a single, unified storage system for all developers, where discovery and data sharing is trivial and compliance with policy and security settings are enforced centrally and uniformly. For more information, see What is OneLake?
Organizational structure of OneLake and lakehouse
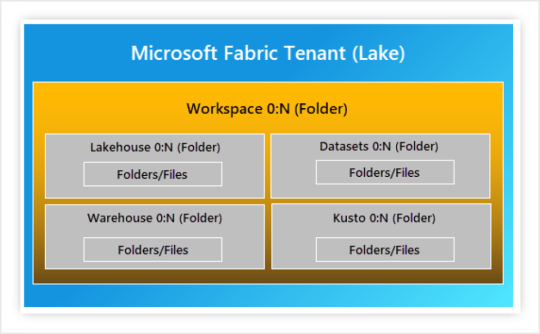
OneLake is hierarchical in nature to simplify management across your organization. It’s built into Microsoft Fabric and there’s no requirement for any up-front provisioning. There’s only one OneLake per tenant and it provides a single-pane-of-glass file-system namespace that spans across users, regions and even clouds. The data in OneLake is divided into manageable containers for easy handling. The tenant maps to the root of OneLake and is at the top level of the hierarchy. You can create any number of workspaces within a tenant, which can be thought of as folders.
The following image shows the various Fabric items where data is stored. It’s an example of how various items within Fabric would store data inside OneLake. As displayed, you can create multiple workspaces within a tenant, create multiple lakehouses within each workspace. A lakehouse is a collection of files, folders, and tables that represents a database over a data lake. To learn more, see What is a lakehouse?.
Every developer and business unit in the tenant can instantly create their own workspaces in OneLake. They can ingest data into their own lakehouses, start processing, analyzing, and collaborating on the data, just like OneDrive in Office.
All the Microsoft Fabric compute experiences are prewired to OneLake, just like the Office applications are prewired to use the organizational OneDrive. The experiences such as Data Engineering, Data Warehouse, Data Factory, Power BI, and Real-Time Analytics use Onelake as their native store. They don’t need any extra configuration.
OneLake is designed to allow instant mounting of existing PaaS storage accounts into OneLake with the Shortcut feature. There’s no need to migrate or move any of the existing data. Using shortcuts, you can access the data stored in Azure Data Lake Storage.
Additionally, shortcuts allow you to easily share data between users and applications without moving or duplicating information. The shortcut capability extends to other storage systems, allowing you to compose and analyze data across clouds with transparent, intelligent caching that reduces egress costs and brings data closer to compute.
Note: PreludeSys is a Microsoft Gold partner.
The original source of the content is learn.microsoft.com/en-us/fabric/.
#what is microsoft fabric#benefits of microsoft fabric#microsoft fabric consulting company#microsoft service fabric
1 note
·
View note
Text
Power Apps Training | Power Apps Training Hyderabad
Power Apps Data policies
Power Apps is a Microsoft service empowering users to create custom business applications without extensive coding expertise. As part of the Power Platform, it offers a user-friendly environment for app development, enabling seamless integration with various data sources, both on-premises and in the cloud. As of my last knowledge update in January 2022, Power Apps is a Microsoft service that allows users to create custom business applications without the need for extensive coding. It's part of the Power Platform, which also includes Power BI, Power Automate, and Power Virtual Agents.
Power Apps and Power Automate Training
Data Storage and Compliance:
Power Apps may store data in Microsoft Data verse, which provides a secure and compliant data platform.
Ensure compliance with data protection regulations, such as GDPR (General Data Protection Regulation) or any other applicable regional laws.
Connectors and Data Sources:
Power Apps can connect to various data sources, including on-premises data, cloud-based data, and services like SharePoint, SQL Server, and more.
Be aware of the data sources you are connecting to and understand their security and compliance features. Microsoft Power Apps Course
Role-Based Security:
Implement role-based security to control access to data within your Power Apps.
Use Microsoft 365 groups, Azure AD groups, or custom roles to manage access permissions.
Data Encryption:
Ensure that data transmitted between Power Apps and data sources is encrypted.
Microsoft typically employs encryption technologies to secure data in transit and at rest. Power Apps Online Training
Audit and Monitoring:
Leverage built-in audit features to monitor and track user activities within Power Apps.
Use Power Platform's admin connectors and tools for monitoring and managing environments. Power Apps Training Hyderabad
Data Loss Prevention (DLP):
Implement DLP policies to prevent the sharing of sensitive information.
DLP policies can restrict data sharing across environments and between Power Platform and other Microsoft 365 services.
Compliance Center:
Utilize the Microsoft 365 Compliance Center to manage compliance features across Microsoft 365 services, including Power Apps.
Visualpath is the Leading and Best Software Online Training Institute in Ameerpet, Hyderabad. Avail complete job oriented Microsoft Power Platform Online Training by simply enrolling in our institute in Ameerpet, Hyderabad. You will get the best course at an affordable cost.
Attend Free Demo
Call on - +91-9989971070.
Visit: https://visualpath.in/microsoft-powerapps-training.html
#Power Apps and Power Automate Training#Microsoft Power Apps Online Training#Microsoft Power Apps Course#Power Apps Online Training#Power Apps Training#Power Apps Training Hyderabad#Power Apps Training in Ameerpet#Microsoft Power Platform Online Training in ameerpet
0 notes
Text
Excel Courses And Their Misconceptions
Choosing the right online platform for Excel or Power BI training requires a meticulous and comprehensive method. Optimal online Excel courses should include a diverse array of learning courses. From the basics of spreadsheet through advanced data analysis well broad curriculum will ensure that students can grasp Excel's vast capabilities. In the same way, Power BI online training programs should cover all aspects, from introductory concepts to advanced dashboard design. The most effective online platforms provide an interactive learning environment. Engaging lessons, quizzes, and real world examples enhance the learning experience. For the two types of Excel and Power BI training, interactive modules keep learners actively involved, facilitating a deeper knowledge of the subject. Navigating the online platform should be easy. A user friendly interface ensures that students can access courses, track the progress of their learning, and even review material. Simple and clear design aid in a quick and stress-free learning experience. Flexibility is essential when it comes to online learning. The most suitable platforms for Excel as well as Power BI training should allow students to access the materials at any time. No matter if it's a hectic working day or a relaxing weekend, the ability to access training anytime, anyplace will appeal to a variety of users. Browse the following website, if you are looking for more information on excel courses.

A robust Power BI certification program covers not just the basics, but also the more advanced aspects. Learners should be equipped to develop powerful visualisations, connect to diverse data sources, as well as harness the full power of Power BI for data analyses and reports. The inclusion of practical exercises is crucial for effective learning. Excel and Power BI courses should incorporate practical exercises that allow learners to apply theoretical knowledge in real-world situations. This improves understanding and increases confidence when using these tools. The quality of the instruction is essential. Excel as well as Power BI trainers should be professionals with a thorough knowledge of the tools. A clear and concise communication style as well as the capability to convey complex concepts in an easy to comprehend manner are essential for the best learning experience. Because of the rapid evolution of technology, frequent changes to course content are necessary. The most reliable online platforms keep their Excel and Power BI courses current, ensuring that learners get the latest capabilities and features.
A supportive learning community fosters collaboration and knowledge sharing. Forums or discussion groups online enable learners to seek assistance as well as share knowledge and form a community of others who are facing similar issues when it comes to Excel or Power BI training. While high-quality education is essential but cost-effectiveness is a major consideration for many. The best online platforms will offer an range different pricing choices which makes Excel as well as Power BI classes accessible to all without sacrificing quality. The process of mastering Excel as well as Power BI begins with the decision of choosing the appropriate online platform. With the help of a variety of learning tools, interactive environments, user-friendly interfaces, as well as other aspects that are mentioned above, students can begin an extensive and enjoyable educational experience.
1 note
·
View note
Text
General EI notes:
No one is ever truly stupid, oftentimes it's either an act or an honest mistake (although some dumb decisions have been made, looking at you P.I.E. and Angus). Sure people have bubbly personalities but it doesn't mean they're dumb, they are just happy and outgoing. This applies to the kids as well as they are oftentimes smarter and more aware than people give them credit for.
Take Spooker for instance: he was the first one to put together the fact that Kashuba and CJ are the same person just by looking at her old photos from high school to her working at the Magnus Institute and then back at her (as she was right in front of him).
Marvin saw everything that Angus had been through when he looked into his soul stone to try and fix it back when it broke that one time. This includes his early childhood (the part where his parents were thinking of having another kid because he did not turn out how they wanted), all the abuse he went through when he and Ellieanna were married, and the whole fading process. (the soul holds on to things the brain can't/refuses to)
Like the seers in Quest!, the Magic Circle is trying to keep their timeline in order. multiple timelines are running at the same time as the one in the series (like all the stuff Seán and Mark are doing is one timeline separate from this one) and each timeline has its own group trying to keep it together.
Jimmy is a chaos demon chosen by the housekeeper/chaos god. Jimmy spreads chaos through murder (duh) and the housekeeper spreads chaos through stealing gold (which is very valuable), causing the Ghost family's whole deal and trying to take over the world. Ana and Tim are still Jimmy's parents (making him and Ghost twins) but after everything that happened (Ghost drowning, Gregory dying, etc.) the housekeeper kinda just gave this child (who was already a demon, to begin with) more demon powers (ie possession) and free range.
Ghost has insomnia, autism, Cotard's delusion, MS, PTSD, anxiety disorders, depression, vitiligo, maybe some co-dependency towards Toast, is an ambi wheelchair user, has a sci-fi monocle (doesn't want to call it that though), numb tongue (from eating too much spicy and sour foods growing up). And yes there is an in-universe reason he wears the gloves (covers scars and vitiligo).
Both Ghost and Angus are partially blind from injuries. Angus in their left eye and Ghost in his right (hence the monocle). I've already explained Angus' injury but I still have to figure out Ghost's.
S3(4N) was made by Cyberlife for police work (duh) while Bing (septiceye) was built by Mack to help around the house I guess. Bing (iplier) and Google on the other hand were built by The Host and Dark to help with the votes when the group needs to make a big decision. That being said, if Mach met them all, he'd feel "out of place" because they were made with an expressed purpose in mind while he was only really made for a high school exhibition.
Ghost was 13 when he figured out he was gay. How? Middle school locker room + Toast just chilling on his bed while playing video games together (with Ghost just silently having his oh moment)
Toast was 15 when he figured out he was bi (or at least that he liked guys as well as girls), it wasn't until college (21) when he finally accepted this about himself (as the Toast family would've had some....opinions about this fact so he'd rather not think about it).
Alan Wake is either 1. Toast's pen name (along with Edgar Kingsley) or 2. Toast from another timeline/dimension
(both of which would be in-universe explanations for why they look damn near identical)
P.I.E's handiness goes as follows (weapons wise everyone is ambidextrous, this is what hand they use for everything else):
Toast- ambidextrous
Ghost- right handed
Spooker- left handed
Colon- right handed
CJ- right handed
Alex- left handed
Zoé- left handed
Suzannah- ambidextrous
Ok, I know I said that I wasn't doing the whole "Ghost is a system" thing but I think I can do this as it doesn't involve Jimmy as he is a murderer. Let me introduce you to Casper: Casper is Ghost's alter who formed when Ghost was 5 (which explains why Casper is only 5) after Gregory's death. Also, he is mute (only talks in the headspace/to Ghost) by choice because of how many people Ghost is constantly around
Toasts lycanthropy: full transformations are caused by the full moon (no fucking duh) while smaller transformations (limbs, eyes, and teeth) are caused by high amounts of emotions
I named some people as well:
Burke/Angus + Henrik's parents: Falko and Tahlia
O'Fallons/Marvin's family: Lonán, Saraid (parents), Isabelle, Rían, Sophie (siblings)
Houghs/Jackie's family: Oisín, Saoirse (parents), Lexi, Willow (sisters)
Flynns/Shawn, Jack, and Grant's family: Cuán, Annie (parents), Hollie, Marcel, Teagan, Casey, Aisling (siblings)
0 notes
Text
Tableau software development course
Tableau software development course
Introduction to Tableau: Tableauis a powerful data visualization and business intelligence (BI) tool that enables users to explore and understand their data in a visual and interactive way. It is widely used across industries to create informative and engaging dashboards, reports, and data-driven insights. Tableau software development course user-friendly interface and robust features make it a popular choice for data professionals, analysts, and decision-makers.
Key Features and Capabilities: Tableau offers a range of features that make it a versatile tool for data analysis. Users can connect to various data sources, including spreadsheets, databases, and cloud services, to import and blend data. The drag-and-drop interface allows for the easy creation of visualizations like charts, graphs, maps, and tables. Tableau's interactivity features enable users to filter, drill down, and explore data dynamically. Additionally, it supports advanced analytics and predictive modeling through integration with other tools.
Data Visualization and Storytelling: One of Tableau's strengths lies in its ability to turn raw data into meaningful visualizations that tell a story. Data analysts and business professionals can use Tableau to create interactive dashboards that convey insights effectively. These dashboards can be shared with stakeholders for better decision-making. The tool encourages data-driven storytelling, where users can guide others through the data and highlight key findings.
Applications in Business and Beyond: Tableau finds applications in various domains, including business, healthcare, finance, marketing, and education. In business, it assists in tracking KPIs, monitoring sales performance, and conducting financial analysis. Healthcare professionals use Tableau for patient data visualization and tracking medical outcomes. In marketing, it helps analyze customer behavior and campaign performance. Tableau's versatility makes it valuable across industries for data-driven decision-making.
Tableau Community and Training: Tableau has a vibrant user community and provides extensive training resources. Users can access forums, blogs, and user groups to seek help and share insights. Tableau offers training courses and certifications for users of all skill levels, from beginners to advanced users and developers. These resources enable individuals and organizations to harness the full potential of Tableau for data analysis and reporting.
In summary, Tableau is a leading data visualization and business intelligence tool known for its user-friendly interface, powerful features, and ability to transform data into actionable insights. It has a wide range of applications in diverse industries and is supported by an active user community and robust training resources. Tableau continues to play a significant role in helping organizations make data-driven decisions and communicate insights effectively.
Enhance your skills and knowledge with H2kinfosys's Tableau training course and become a proficient in Tableau
Why should I do the Tableau course with H2kInfosys?
H2K Infosys Trainings are instructor led real time live online, onsite training.
Duration of the Tableau training is 40 hr.
Live class videos are recorded for students to review the class.
Life time access to the training videos.
We have competitive syllabus, as per the current job market.
Pay one time, Access Lifetime to the Tableau course videos, course content and live classes.
Top Rating Tableau Online Free Courses
Keywords:
H2kinfosys, Tableau H2kinfosys, Tableau Online Course, Tableau Training Program, Learn Tableau Online, Tableau Certification Course, Data Visualization with Tableau, Tableau Dashboard Training, Tableau for Beginners, Advanced Tableau Training, Tableau Desktop Essentials, Tableau Server Administration
#Tags:
#TableauTraining, #TableauOnlineCourse, #LearnTableau, #DataVisualizationTraining
#TableauCertification, #DashboardDesign, #TableauSkills, #TableauLearning
#DataAnalyticsTraining, #TableauForBeginners, #H2kinfosys
Contact:
+1-770-777-1269
Mail: [email protected]
Location - Atlanta, GA - USA
5450 McGinnis Village Place, # 103 Alpharetta, GA 30005, USA.
Facebook: https://www.facebook.com/H2KInfosysLLC
Instagram: https://www.instagram.com/h2kinfosysllc/
Youtube: https://www.youtube.com/watch?v=p8cNzXQ6Nqk
Enroll: https://www.h2kinfosys.com/courses/tableau-online-training-course-details/
0 notes
Text
Power Apps Training Hyderabad | Microsoft Power Apps Course
Power Apps and Power Automate: Enhancing Efficiency with Seamless Integration
Microsoft's Power Platform offers two powerful tools, Power Apps and Power Automate that allow organizations to streamline their processes and enhance productivity. When these two tools are integrated, the possibilities are limitless, and organizations can automate repetitive tasks, improve data consistency, and make data-driven decisions with ease. -Power Apps Online Training
Power Apps:
Power Apps empowers users to create custom applications without the need for extensive coding knowledge. Whether it's a simple data entry form or a complex business application, Power Apps makes app development accessible to all. - Power Apps and Power Automate Training
Power Automate:
Power Automate, formerly known as Microsoft Flow, is an automation platform that connects various services and applications, enabling the creation of workflows to automate processes. It can trigger actions in response to events or changes in data, such as sending emails, updating records, or creating tasks.
Integration Benefits:
Seamless Data Flow: When Power Apps and Power Automate are integrated, data can flow seamlessly between the two. For instance, a Power App can trigger a Power Automate flow to send an email notification when a form is submitted.
Automated Workflows: Power Automate can automate repetitive tasks in Power Apps, such as sending approval requests, updating records, or creating calendar events, reducing manual effort and the risk of human error. -Power Apps Training
Enhanced User Experience: Integrating Power Automate with Power Apps enhances the user experience. Users can perform complex actions with a single click within the app, knowing that Power Automate is handling the backend processes.
Improved Data Accuracy: Automating data entry and validation tasks through Power Automate ensures that data entered into Power Apps is consistent and accurate, leading to better decision-making. -Microsoft Power Apps Course
Common Integration Scenarios:
Approval Workflows: Automate approval processes for documents, requests, or expenses within Power Apps, with Power Automate handling the approval routing and notifications. - Power Apps Training Hyderabad
Data Migration and Sync: Ensure data consistency by using Power Automate to synchronize data between Power Apps and other systems or databases.
Notifications and Alerts: Send notifications, reminders, or alerts to users or groups when specific events occur within your Power Apps.
Data Extraction and Reporting: Automatically extract data from Power Apps, transform it, and create reports or dashboards in other applications like Microsoft Excel or Power BI. -Power Apps Training in Ameerpet
Custom Integrations: Create custom integrations with third-party applications and services by leveraging Power Automate connectors.
In conclusion, integrating Power Automate with Power Apps is a game-changer for organizations seeking to streamline processes, reduce manual tasks, and improve overall efficiency. By automating workflows and enabling data to flow seamlessly between these two platforms, businesses can optimize their operations, save time and resources, and ultimately make more informed decisions.
Visualpath is the Leading and Best Software Online Training Institute in Ameerpet, Hyderabad. Avail complete job oriented Microsoft Power Platform Online Training by simply enrolling in our institute in Ameerpet, Hyderabad. You will get the best course at an affordable cost.
Attend Free Demo
Call on - +91-9989971070.
Visit https://visualpath.in/microsoft-powerapps-training.html
#Power Apps and Power Automate Training#Microsoft Power Apps Online Training#Microsoft Power Apps Course#Power Apps Online Training#Power Apps Training#Power Apps Training Hyderabad#Power Apps Training in Ameerpet#Microsoft Power Platform Online Training#Power Automate Training
0 notes
Text
Top 5 Business analysis tools
A viable examination is vital for informed navigation and keeping an upper hand in the present high-speed business climate. Fortunately, a few programming instruments take special care of the requirements of business experts. In this article, we will investigate the main five business examination apparatuses: Balsamiq, MS Visio, Jira, Scene, and Power BI. These apparatuses offer assorted functionalities to smooth out investigation processes, encourage joint effort, and present information-driven bits of knowledge.
Balsamiq:
Balsamiq is a strong wireframing and prototyping device that assists business examiners with making intelligent and outwardly engaging mockups. With a natural point of interaction and a broad library of pre-assembled parts, Balsamiq empowers speedy plan cycles and UI approval. By picturing the finished result, partners can pursue informed choices and limit modification.
MS Visio:
Microsoft Visio is a famous outlining instrument that assists business experts with imagining complex cycles, work processes, and information streams. With a broad format assortment and intuitive points of interaction, Visio streamlines making flowcharts, authoritative graphs, and organization charts. By offering a reasonable visual portrayal, MS Visio further develops correspondence and understanding among partners. Its consistent mix with other Microsoft items is profitable for associations previously utilizing the Microsoft suite.
Jira:
Jira is a broadly taken-on project management and issue-following device that helps business examiners oversee necessities, follow errands, and work together with colleagues. It works with client story creation, accumulation on the board, and light-footed project following. Jira's adaptable work processes and dashboards give important experiences in project progress, guaranteeing groups keep focused and convey results. Its vigorous incorporation abilities and module commercial centre empower it to address explicit venture needs.
Tableau:
Tableau is a leading data visualization and analytics tool that empowers business analysts to explore, analyze, and present complex datasets in an intuitive and visually appealing manner. With a drag-and-drop interface, users can create interactive dashboards, reports, and charts without extensive coding knowledge. Tableau's powerful analytics capabilities uncover trends, patterns, and correlations within the data, enabling data-driven decision-making. Its ability to connect to various data sources makes it ideal for integrating data from multiple systems.
Power BI:
Power BI, a Microsoft item, is an extensive business knowledge device that transforms crude information into significant experiences. With information demonstrating, perception, and intuitive detailing abilities, Power BI permits examiners to make shocking dashboards and reports. Coordination with Microsoft Sky Blue and different information sources empowers constant updates and consistent cooperation. Power BI's sharing and implanting highlights work with a simple scattering of experiences across the association, advancing information-driven navigation.
Conclusion:
The right apparatus essentially upgrades efficiency, joint effort, and dynamics in the business examination. Balsamiq, MS Visio, Jira, Tableau, and Power BI offer a different scope of functionalities to take special care of the requirements of business examiners. Whether wireframing, charting, projecting the board, or information representation and examination are required, these instruments have you covered. By utilizing these five main business examination devices, experts can unlock the genuine capability of their information and drive outcomes in the present serious business scene.
Join the Free Business analyst Webinar
0 notes
Text
8 Critical Factors To Consider While Selecting The BI Tool
One of the most common trends observed for enterprises that have existed for decades, and are of a certain scale, is the overwhelming data. In most cases, this data is either never looked at, or is not looked at in real-time and optimally. Add to this the complexities Mergers & Aquisitions can add, if the enterprise has gone through any. Chances are, there are multiple ERP / CRM systems where powerful data is lying but no one knows how to consolidate all of it to make business sense.

If you are currently looking for a BI solution, you already understand the power of analysing real-time data and executive reports that can instantly show the leaders, the overall health of the business. However, according to Gartner, 70% – 80% BI projects fail. This is because organizations look at current requirements and don’t consider the dynamic business environments to find a solution that is futuristic and scalable.
Given below is a powerful list of eight critical factors you should consider while selecting a BI tool, which if followed through, can ensure you don’t regret your decision ever.
1. Data Visualization: Creating powerful data visualization focused on answering business question should be easy, user friendly and the tool should give you the ability to customize the level of access based on roles or functional groups.
2. Data Integration and Transformation: Rarely do organizations have their data at a single location. Whilst considering a BI tool, carefully consider the number of data sources and disparate systems you have today and the level of integration and transformation that will be required.
3. Total Cost of Ownership (TCO): Hardware, Software, License, BI Resources, Training, Implementation, Ongoing Support & Maintenance are key contributors to TCO. It is common mistake to make BI tool decision purely based on User License cost alone.
4. Ease of User Adoption: Ideally the BI tool adoption should be as easy as installing an app from the app store and get going without any/minimal training. You don’t want to be investing too much time in training users on how to use a complicated BI tool.
5. Self-Service: One of the most critical aspect of BI is self-service. You don’t want IT (BI team) to stand between data and decision maker. The tool should empower business users to easily and quickly build their own KPIs with minimal training.
6. Mobile Capability: A BI tool should be accessible from any device anywhere. This enables users get the information in real-time and make decisions as and when needed on-the-go. BI tool without great responsive experience is not a good idea.
7. Performance: It can be very frustrating to click a dashboard and wait for data to load. Lots of BI tools perform great at smaller data volumes but as the data increases, the performance starts to drop. Project your future data volume needs and ensure that the BI tool is scalable and capable of performing well at large data volumes too.
8. Notification Alerts: It is practically impossible to monitor each KPI especially when there are several moving parts. Notification alert enables “management by exception” so the decision makers are notified when set thresholds are breached.
There are many data analysis tools today in the market, so the decision process of selecting one is long and arduous. BI is the brain of the company that would enable better and faster decision making and action. You must get it absolutely right the first time as the rework and course correction in future is very expensive. While the tool is extremely important, the people who manage it are equally critical. If you don’t have the right team with business perspective, knowledge & experience, then you can easily get into issues early on. We offer free one-hour consultancy capsules that can help you make the right decision of selecting a BI tool for your company. To book an appointment, fill in the Contact Us form or reach out to us at [email protected].
#Domo Consulting#Domo Implementation#Domo Managed Service#Power BI Consulting#Power BI Implementation#Power BI Managed Service#Snowflake Consulting#Snowflake Implementation#Data Lake Consulting
0 notes
Text
Top 50 Power BI Interview Questions | Analytics Training Hub
Data visualization
Data visualization has come a long way from creating pie or graph charts in MS Excel. Since the launch of Power BI by Microsoft a few years back looking into data had never been this interactive and fun. The demand for Power BI as a business intelligence/data visualization tool has only risen in the past few years and a lot of companies hire individuals to post a thorough knowledge search of this tool via interviews.
So, here are some Power BI Interview Questions that the user might find helpful in the user’s quest to face the interview.
Q1. What is a Power BI?
Power BI is a cloud-based data-sharing environment. Once the user has developed reports using Power Query, Power Pivot, and Power View. The user can share his/her insights with colleagues. This is where Power BI enters the equation. Power BI allows the operator to upload Excel workbooks into the Power BI cloud and share them with a chosen group of co-workers. Not only that, the colleagues can interact with the user’s reports to apply filters and slicers to highlight data. It is a simple way of sharing the user’s analysis and insights from the Microsoft cloud with the rest of the department.
Power BI features allow the user to:
Share presentations and queries with peers.
Update the Excel file from data sources that can be on-site or in the cloud.
Display the infographic on multiple devices like desktops, tablets, and HTML 5-enabled smartphones that can use the Power BI app.
Query the user data using natural language processing (or Q&A, as it is known)
Q2. What is self-service business intelligence?
Self-Service Business Intelligence (SSBI)
SSBI is a tactic for data analytics that allows trade users to filter, segment, and analyze their data, without in-depth technical knowledge in statistical analysis, and business intelligence (BI).
SSBI has made it stress-free for end-users to access their data and craft various visuals to get healthier business insights.
Anybody who has a rudimentary grasp of data can generate reports to build instinctive and shareable dashboards.
Q3. What is the Power BI Desktop?
Power BI Desktop is a free desktop application that can be installed right on the user’s laptop/desktop. Power BI Desktop works together with Power BI services by offering data exploration, shaping & modeling and also, aiding the user in creating a report with highly interactive visualizations. The user can save the work to a file or publish the data and reports right to the Power BI site to share with his/her colleagues.
Q4. Describe the data sources, that Power BI can connect to?
The list of data sources for Power BI is massive, but it can be clustered into the following:
Files – Data can be pulled in from Excel, Power BI Desktop files, and Comma Separated Values.
Content Packs – It is a compendium of related documents or files that are stored as a group. In Power BI there are two categories of content packs, primarily one is from service providers like Google Analytics, Marketo, or Salesforce and secondly, one is created and shared by other colleagues in the company.
Connections to databases and other datasets such as Azure SQL, Database and SQL, Server Analysis Services tabular data, etc.
Describe the diverse filters in Power BI Reports.
Power BI provides a variety of options to filter, report, data, and visualize. The following is the list of Filter types.
Visual Filters – These work on individual visualizations, decreasing the amount of data that the visualization can show. Also, visual filters can compartmentalize both calculus and data.
Page Filters – These filters work at the report-page level. Distinct pages in the same report can have unique page-level filters.
Report Filters – These work on the complete report, sorting all the pages and visualizations incorporated in the report.
Power BI visuals have an interactive feature, which makes filtering a report easy. Visual interactions are insightful but come with some restrictions:
The filter used is not saved as part of the report – Whenever the user launches a report, the user can use visual filters but would not be able to store the filter in the original report.
The filter is always visible – Sometimes the user intends to use a filter for the entire report, but the user does not wish any visual indication of the filter being applied.
Q5. What is the format available in Power BI?
Power BI Desktop – for desktop/laptop
Power BI service – Online SaaS
Power BI mobile app – for Android and iOS devices
All of these may be used in conjunction. For example, the user might create a report on the desktop and then publish and share it online so that colleagues could view it on their mobile devices.
Q6. What are content packs in Power BI?
Content packs are prefabricated solutions for popular features as part of the Power BI experience. User with access can link to their profile from Power BI to see their data through live dashboards and interactive reports that have been fabricated for them. Microsoft has published content packs for services like Salesforce.com, Marketo, Adobe Analytics, Azure Mobile Engagement, CircuitID, etc.
The corporate content pack gives the employees, BI professionals, and system integrators the means to construct their content packs and to share purpose-built dashboards, reports, and datasets within their company.
Q7. Describe the building blocks of Power BI?
Visualizations – Visualization refers to a chart, graph, or similar graphic depiction of data.
Datasets – A dataset is a group of data used to generate a visualization such as a column of sales figures. Datasets can be merged and cleaned from distinct sources using built-in connectors.
Reports – A report is a collection of visualizations of one or more pages; for example, charts, graphs, and maps can be fused to create a report.
Dashboards – A dashboard lets the user share a one-page visualization with others, who can then interact with the user’s dashboard.
Tiles – A tile is a visualization on the user’s dashboard or in the report. As the creator, the user has complete access to move the tiles around.
Q8. Describe DAX?
Data Analysis Expressions (DAX) is a compilation of functions, operators, and constants used in formulas to calculate and return values. In other words, it helps the user create new information from the data obtained.
To do the basic calculation and data analysis on data in power pivot, we use Data Analysis Expression (DAX). It is a formula language used to compute the calculated column and field.
DAX works on column values.
DAX cannot modify or insert data.
We can create computed columns and measures with DAX but we cannot evaluate rows using DAX.
Q9. What are the most shared DAX Functions used?
Below mentioned are some of the most widely used DAX functions:
SUM, MIN, MAX, AVG, CONTROLS, DISTINCT COUNT
IF, AND, OR, SWITCH
ISBLANK, IS FILTERED, ISCROSSFILTERED
VALUES, ALL, FILTER, CALCULATE,
UNION, INTERSECT, EXCEPT, NATURALINNERJOIN,
NATURALLEFTEROUTERJOIN,
SUMMARIZECOLUMNS, IS EMPTY,
VAR (Variables)
GEOMEAN, MEDIAN, DATEDIFF
Q10. How is the FILTER function used?
The FILTER function yields a table with a filter condition applied for each of its source table rows. The FILTER function is rarely used alone; it is generally used as a parameter to other functions such as CALCULATE.
FILTER is a mediator and thus can negatively impact performance over large source tables.
Complex categorizing rationality can be applied such as referencing a measure in a filter expression.
Q11. What is the common table function for grouping data?
SUMMARIZE()
Main group by function in SSAS.
The recommended routine is to specify the table and group by columns but not by metrics. The user can use ADD COLUMNS function.
SUMMARIZECOLUMNS
Create a New Group by function for SSAS and Power BI Desktop; more efficient
Specify the group by columns, table, and expressions.
Q12. What are some benefits of using Variables in DAX?
Below are some of the benefits:
By announcing and calculating a variable, the variable may be reprocessed multiple times in a DAX expression, thus avoiding additional queries of the source database.
Variables can make DAX expressions more intuitive/logical to predict.
Variables are only measured to their query, they cannot be shared among measures, queries, or be defined at the model level.
Q13. How would the user create trailing X-month metrics via DAX against a non-standard calendar?
The solution will involve:
CALCULATE function to control (take over) filter context of measures.
ALL to remove existing filters on the date dimension.
FILTER to identify which rows of the date dimension to use.
Alternatively, CONTAINS may be used:
CALCULATE(FILTER(ALL(‘DATE’),…….))
Q14. What are the three fundamental concepts of DAX?
Syntax – Syntax includes functions such as SUM (used when the user wants to add figures). If the syntax isn’t correct, the user will get an error message.
Functions – These formulas are used as arguments in a particular order to perform a calculation, akin to the functions in Excel. The different types of functions are time intelligence, logical, parent/child, mathematical, date/time, statistical, etc.
Context– There are basically 2 categories: –
row context and
filter context
Every Time a formula has a function that applies filters to identify a single row in a table, row context comes into play. When multiple filters are employed in a calculation that determines a result or value, the filter context comes into play.
Q15. What are some of the most common sources for data in the Get Data menu?
Power BI datasets, MS Excel, SQL server, and analysis services.
Q16. What is grouping, and how would the user use it?
Power BI Desktop groups the data in the user’s visuals into pieces. The user can however define the user’s groups and bins. For this use Ctrl and click to select multiple elements in the visual. Right-click on one of those elements and from the menu that appears, opt the Group. In the Groups window, the user can create new groups or modify existing ones.
Q17. Describe responsive slicers.
On a report page, the user can resize a responsive slicer to different sizes and shapes, and the data contained in it will be rearranged to match. If a graphic becomes small to be useful, an icon representing the visual takes its place-making judicious use of space on the report page.
Q18. What are the main components of the Power BI toolkit, and what do they do?
Power Query: lets the user discover, access, and consolidate info from different sources
Power Pivot: a modeling tool
Power View: a performance tool for creating charts, tables, etc
Power Map: lets the user create geospatial representations of the user’s data
Power Q&A: Allows the operator to use natural language to raise queries, i.e. “What were the total sales last week?”
Q19. What is Power Pivot Data Model?
It is a specifically designed model that is made up of data types, tables, columns, and table relations. These data models are normally assembled for keeping data for a private business entity.
Q20. What is the velocity in-memory analytics engine used in Power Pivot?
The programming behind the power pivot is the xVelocity in-memory analytics engine. It is capable of handling a significant volume of data with ease as it stores the data in the columnar database and in-memory analytics which results in faster processing of data as it loads the entire data to the RAM.
Q21. What are some of the differences in data modeling between Power BI Desktop and Power Pivot for Excel?
Here are some of the differences:
Power BI Desktop supports two-way dual relationships, security, calculated tables, and Direct Query options.
Power Pivot for Excel has one direction relationship, calculated columns only, and supports import mode only.
Q22. Can we have more than one active relationship between two tables in the data model of a power pivot?
More than one active relationship between two tables is NOT possible. However, the user can instill more than one relationship between two tables but there will be only one active relationship and many inactive relationships.
Q23. What is Power Query?
Power Query is an extract, transform & load tool used to shape data using intuitive interfaces without the need of using coding. It helps the user to:
Import Data from multiple sources i.e. files, databases, big data, social media data, etc.
Join and attach data from multiple data sources.
Model data as per the requirement by deleting and adding data.
Q24. What are the data destinations for Power Queries?
There are majorly two destinations for output we can derive from power query:
Load to a table in a worksheet.
Load to the Excel Data Model.
Q25. What is query folding in Power Query?
Query folding is the procedure where the steps defined in the Power Query/Query Editor are translated into SQL and executed by the source database rather than the operators’ device. It is imperative for administering performance and scalability making the best use of the limited resources on the client’s machine.
Q26. What is some common Power Query/Editor Transforms?
Changing Data Types
Filtering Rows
Choosing/Removing Columns
Grouping
Splitting a column into multiple columns
Adding new Columns etc.
Q27. Is the combined use of Power Query/Query Editor and SQL possible?
Certainly, an SQL announcement can be defined as the source of a Power Query/M function for additional processing/logic. This is a good practice to ensure that an efficient database query is passed to the source and that any unnecessary processing and complexity are avoided by the client machine and M function.
Q28. What are query parameters and Power BI templates?
Query parameters may be used to offer the operators of a regional Power BI Desktop report a notification, to specify the values that they might be interested in.
The parameter selection may then be used by the query and calculations.
PBIX files can be transferred as Templates (PBIT files).
Templates encompass everything in the PBIX except the data itself.
Parameters and templates can make it possible to share/email tinier template files and restrict the amount of data that is loaded onto the local PBIX files, maximizing processing time, and experience.
Q29. Which language is used in Power Query?
An innovative programming language is used to power a query called M-Code. It is simple to use and related to other languages. M-code is a case-sensitive language.
Q30. What is the need for a Power Query when Power Pivot can be used to import data from the most frequently used sources?
Power Query is an ETL (Extract, Transform, Load) tool that operates as an Excel add-in. It permits operators to extract data from numerous sources, manipulate the said data into a form that suits their needs, and load it onto Excel. It is the most recommended routine to use Power Query over Power Pivot as it not only allows the user to load the data but also influences it as per the user’s needs while uploading.
Q31. Explain the term “M language”.
It is the programming language used in Power BI. It’s a functional, case-sensitive language that is a lot similar to other programming languages which are easy to implicate.
Q32. Describe the difference between visual-level filters, page-level filters, and report-level filters?
Visual filters filter data within a single visualization.
Page filters work on the complete page in a report, and different pages may have separate filters.
Report filters, and categorize all the visualizations and pages in the report.
Q33. How does the Schedule Refresh feature work?
The user can configure an automatic refresh of data daily or weekly and at different times. The user can schedule only one refresh maximum daily unless the user has Power BI Pro. In the Schedule Refresh section, use the pulldown menu selections to choose the frequency, time zone, and time of day.
Q34. What data is required to generate a map in Power Map?
Power Map can display only geographical visualizations. Thus, data about the location is required e.g. city, state, country or latitude, longitude, etc.
Q35. What is the Power Map?
Power Map is an Excel add-in that provides the user with a powerful set of tools to help the user visualize and gain insight into large sets of data that have a geo-coded component. It can help the operator generate 3D visualizations by scheming up to a million data points in the form of column, heat, and bubble maps on top of a BING map. In certain scenarios, if the data is time-stamped, it can also produce interactive views that display how the data changes over time.
Q36. What is the principal requirement for a table to be used in Power Map?
For data to be consumed in the power map there should be location data like:
Latitude & Longitude
Street, City, Country/Region, zip code, etc which can be geolocated by BING
The initial requirement for the table is that it should consist of distinctive rows. It must also include location data, which can be in the form of a Latitude & Longitude, although this is not a requirement. The operator can use Street, City, Country/Region, Zip Code/Postal Code, and State/Province which can be geolocated by Bing.
Q37. What are the data sources for Power Map?
Data sources may differ from being present in Excel format to multiple external sources. To prepare the user data, make sure all of the data is in an Excel table format, where each row represents a unique record. Using expressive labels also makes the value and category fields available to the user when the user designs the user tour in the Power Map Tour Editor pane.
To be able to use a table structure that precisely symbolizes time and geography inside Power Map, include all of the data in the table rows and use descriptive text labels in the column headings, like this:
In case the user wishes to load the user data from an external source:
In Excel, click Data > the connection the user wants in the Get External Data group.
Adhere to the steps in the wizard that pops up.
In the last step of the popup box make sure to add this data to the Data Model to have it checked.
Q38. What is Power View?
Power View is a data visualization technology that allows the operator to create cooperative charts, graphs, maps, and other infographics that bring the user’s data to life. Power View is widely accessible in Excel, SharePoint, SQL Server, and Power BI.
The following provides comprehensive detail about the different visualizations available in Power View:
Charts
Line charts
Pie charts
Maps
Tiles
Cards
Images
Tables
Power View
Multiples Visualizations
Bubble and scatter charts
Key performance indicators (KPIs)
Q39. What is a Power BI Designer?
It is a stand-alone application where we can make Power BI reports and then upload them to Powerbi.com, it does not require Excel. It is an amalgamation of Power View, Power Pivot, and Power Query.
Q40. How can we refresh our Power BI reports once uploaded to the cloud (Share point or Powebi.com)?
Yes, the user can refresh his/her reports through Data Management gateway(for SharePoint) and Power BI Personal gateway(for Powerbi.com)
Q41. What are the different types of refreshing data for our published reports?
There are four main types of options for a refresh in Power BI.
Package Refresh – This feature harmonizes the user’s Power BI Desktop or Excel file between the Power BI service and OneDrive or SharePoint Online. However, this does not extract data from the original data source. The dataset in Power BI will only be revised with the data in OneDrive or SharePoint Online.
Model/data Refresh – It refers to refreshing the dataset in the Power BI service with data from the original data source. This is done by either using scheduled refresh/refresh now. It requires access to on-premises data sources.
Tile Refresh – Tile refresh updates the cache for tile visuals on the dashboard once data alters. This happens every fifteen minutes. The user may also instigate a tile refresh by selecting the 3 dots in the upper right-hand corner of a dashboard and selecting Refresh dashboard tiles.
Visual Container Refresh – Refreshing the visual container revises the cached report graphics within a report once the data is modified.
Q42. Is Power BI available on-premises?
Power BI is NOT accessible as a confidential core cloud service. However, with Power BI and Power BI Desktop, the user can securely connect to the user’s on-premises data sources. With the On-premises Data Gateway, the user can connect live to the other users’ on-premises SQL Server Analysis Services and other data sources. The user can also schedule refresh with a centralized gateway. If a gateway is not available, the user can refresh data from on-premises data sources using the Power BI Gateway – Personal.
Q43. What are data management gateway and Power BI personal gateway?
The gateway acts as a bridge between on-premises data sources and Azure cloud services.
Personal Gateway:
Import Only, Power BI Service Only, No central monitoring/managing.
Can only be used by one person (personal); can’t allow others to use this gateway.
On-Premises Gateway:
Import and Direct Query supported.
Multiple users of gateway for fabricating content.
Central monitoring and control.
Q44. What is Power BI Q&A?
Power BI Q&A is a natural language tool that helps in querying the user data and getting the results the user needs from it. The user attains this by typing into a dialog box on the Dashboard, in which the engine instantaneously generates an answer similar to in Power View. Q&A interprets the user questions and shows the user a restated query of what it is looking for from the user data. Q&A was developed by Server and Tools, Microsoft Research, and the Bing teams to give the user a complete feeling of truly exploring the user data.
Q45. What is how Excel can be experienced with Power BI?
Below are some of the ways through which we can influence Power BI:
The Power BI Publisher for Excel:
May be used to attach Excel items (charts, ranges, pivot tables) to Power BI Service.
May be used to link to datasets and reports stored in Power BI Service.
Excel workbooks can be uploaded to Power BI and viewed in a browser like Excel Services.
Q46. What is a calculated column in Power BI and why would the user use them?
Calculated Columns are DAX expressions that are calculated during the model’s processing/refresh process for each row of the given column and can be used like any other column in the model.
Calculated columns are not compressed and thus require additional memory and result in decreased query performance. They can also decrease processing/refresh performance if applied to large amounts of data and can make a model more difficult to maintain/support given that the computed column is not present at the source.
Q47. How is data security implemented in Power BI?
Power BI can employ Row Level Security roles to models.
A DAX expression is applied on a table to filter its rows at query time.
Dynamic security entails the use of USERNAME functions in security role definitions.
A table is created in the model that connects users to specific features and roles.
Q48. What are many-to-many relationships and how can they be addressed in Power BI?
Many to Many relationships involves building a link between tables reflecting the combinations of two dimensions (e.g., doctors and patients).
Two-way dual relationships can be used in PBIX.
CROSS FILTER function can be used in Power Pivot like Excel.
DAX can be used per metric to check and optionally revise the filter framework.
Q49. Describe Power BI Publisher for Excel?
The user can use the Power BI publisher for Excel to attach ranges, pivot tables, and charts to Power BI.
The user can manage the tiles by refreshing them or removing them in Excel.
The Power BI Publisher for Excel can also be used to create a link from Excel to datasets that are hosted in the Power BI Service.
An Excel pivot table is generated with a link to the data in Azure.
The Publisher installs all the essential drivers on the local device to verify connectivity.
Q50. What are the differences between a Power BI Dataset, a Report, and a Dashboard?
Dataset:
The source is used to create reports and visuals/tiles.
A data model is an Analysis Services Server
Data could be inside of the model (imported) or a Direct Query connection to a source.
Report:
An individual Power BI Desktop file comprising of one or more report pages.
It is built for profound, collaborative analysis experience for a given dataset.
Each Report is linked to at least one dataset
Each page comprising one or more visuals or tiles is made available.
Dashboard:
a compilation of visuals from different reports.
Built to average primary visuals and metrics from multiple datasets.
Q51. What are the three Edit Interactions options of a visual tile in Power BI Desktop?
The 3 edit communication choices are Filter, Highlight, and None.
Filter: It completely penetrates a visual based on the filter selection of another visual.
Highlight: It emphasizes only the related elements on the visual and shades out the non-related items.
None
Some useful Links Are Below:
To Know more about Power BI Certification visit – The power BI Certification Course
Must visit our official youtube channel - Analyticstraininghub
To know more about our visit - Most demanded Technical Skills Based Certification Courses
#power bi scenario based interview questions and answers#power bi interview questions for experienced#power bi scenario based interview questions for experienced professionals#power bi interview questions and answers for 2 years experience
0 notes
Text
All in one bookmark

#All in one bookmark how to
#All in one bookmark pro
#All in one bookmark series
#All in one bookmark series
Getting Started With Dataflow in Power BI – Part 2 of Dataflow Series.
Power BI Shared Datasets: What is it? How does it work? and Why should you care?.
Power BI Architecture for Multi-Developer.
Power BI Paginated Report – Perfect for Printing.
Power BI and Excel More than just an Integration.
Azure Machine Learning Call API from Power Query.
This entry was posted in Power BI, Power BI from Rookie to Rockstar, Visualization and tagged Bookmarks, Power BI, Power BI from Rookie to Rock Star, Visualization. Reza’s passion is to help you find the best data solution, he is Data enthusiast. He is an International Speaker in Microsoft Ignite, Microsoft Business Applications Summit, Data Insight Summit, PASS Summit, SQL Saturday and SQL user groups.
#All in one bookmark pro
He is also the author of very popular book Power BI from Rookie to Rock Star, which is free with more than 1700 pages of content and the Power BI Pro Architecture published by Apress. He is the leader of the New Zealand Business Intelligence users group. He wrote some books on MS SQL BI and also is writing some others, He was also an active member on online technical forums such as MSDN and Experts-Exchange, and was a moderator of MSDN SQL Server forums, and is an MCP, MCSE, and MCITP of BI. His articles on different aspects of technologies, especially on MS BI, can be found on his blog. Reza is also co-founder and co-organizer of Difinity conference in New Zealand. Reza is an active blogger and co-founder of RADACAD. He is a Microsoft Data Platform MVP for nine continuous years (from 2011 till now) for his dedication in Microsoft BI. He has a BSc in Computer engineering he has more than 20 years’ experience in data analysis, BI, databases, programming, and development mostly on Microsoft technologies. Reza Rad is a Microsoft Regional Director, an Author, Trainer, Speaker and Consultant. Do you have some use cases yourself don’t hesistae to write in the comment below. I will write more about other usages of buttons and bookmarks together. Using buttons and bookmarks for clearing all slicers is only one of the multiple creative ways you can use bookmarks. To test the solution, use Ctrl+Click on the desktop, or just click on it in the website Now that you have the clear all button, the last step is to set the Action property of that to bookmark, and select the “clear all slicers” bookmark for it. You can then configure the button to show a different text, with some formattings You can even use Images with logos if you want to. Step 4: Create a Button for user interation This button would be clear all button. Step 3: Create a bookmark of the page, when none of slicers are selected. Step 2: Use the clear button on the header of every slicer. However, there is no Clear All for all the scliers in the page. Or you can even enable Select All in the sclier format options. If you want to clear every slicer usually, there is a clear button on the slicer header. Screenshot below shows a selected state of items Here is a sample Power BI report page with a number of slicers: To learn more about Power BI read Power BI book from Rookie to Rock Star. Bookmarks store the state of a Power BI page, and can be used in many scenarios, in this post, I only show you the ability to clear all slicers in a page. This post shows you a very quick trick of having a button to clear all slicers, and the magic is all happening with bookmarks. That is why I ended up writing this post.
#All in one bookmark how to
However, I still get a lot of questions in my presentations about how to do that. Using bookmarks for clearing all slicers in Power BI is not a a new function, I have been using it for many months, and advising many people to do it that way.
0 notes
Last Seen Blogs

teentitaans
TEEN TITANS

dimensiongalerna
Dimensión Galerna

codedredalert
red's art/ writing/ main blog

xiaoyingai-blog
一只小樱爱

jsmardesal
Js(-) Adora