#Statistics tools
Text
day 15 without polls...the divide between the chosen and the neglected grows deeper...feelings of disappointment, betrayal, and alienation are growing...i don’t know how much more of this i can take...please @staff i beg of you...let there be polls for all...but specifically for ME
#polls#hellsite (derogatory)#*eric andre let me in meme* LET ME HAVE POLLS#STAFF I AM A STATISTICS MAJOR GIVE ME THE TOOLS TO SURVEY MY PEERS PLEASE#i have so many important questions to ask#i need to collect data#**
110 notes
·
View notes
Note
Will you be leaving Tumblr?
Most likely.
From the looks of it, our data has already been compiled and will be handed over tomorrow (I don't have details, the article is locked behind an account creation pop-up) so there's little that can be done for what's already been posted.
I have very little faith that asking those giants to take out our data is going to lead anywhere. There is no obligation in the contract for them to do so.
And even if I were to opt-out, (if that's even going to work at all, remember how well "opting-out" of Tumblr Live worked?) do I really want to keep giving my engagement to a website that feels free to do that kind of scummy shit behind the backs of their userbase? No warning, no talks, no transparency at all? This sits really wrong with me.
So, unfortunately, I most likely will leave Tumblr.
#look my friends#i'm a little burnt-out on caring about AI at all#it could be a wonderful creative tool if the whole practices surrounding it and how they acquire their data sets didn't fucking reek#i care so little about AI art. nothing will ever compare to something that has been handcrafted.#made from human motion. human imagination. human emotion. AI art will never replace human artists.#no AI will ever be able to replace me to tap into my vision and imagination. i do not feel threatened by AI.#in fact i laugh at the very idea of letting some fancy statistic model threaten me#but as little as i care about that i DO care about people making profits off of MY work without my consent#i will not stand idly by and let them make more money off of my back#as we say in french: ''ils nous mangent la laine sur le dos'' they eat the wool off our backs#and i'm not just gonna willingly let them keep eating the wool off of my back#either they fucking pay me for the data or they lose my presence and engagement
15 notes
·
View notes
Text
#seo services#seo tools#learn seo#YouTube Tag Extractor#YouTube Tag Generator#YouTube Description Extractor#YouTube Video Statistics#YouTube Channel Statistics#Article Rewriter#Backlink Checker#Domain Age Checker#Domain Authority Checker#Page Authority Checker#Moz Rank Checker#Keyword Density Checker#Robots.txt Generator#Domain to IP#Meta Tag Generator#Meta Tags Analyzer#Credit Card Generator#Credit Card Validator#Keywords Suggestion Tool#tools#Adsense Calculator#WordPress Theme Detector
2 notes
·
View notes
Text
the thing abt this website (and probably other websites as well) is that like. posters will complain that readers get mad at posts for not encompassing Everyone's Experiences, when they were just talking about their own experiences
and it's like. okay but did you phrase your post in the universalizing second person or.
cue janet-with-cactus gifset.
#this is specifically a vagueblog of a post that describes 'being a girl and hitting puberty' as#'you spend years hating being a girl and hating everything puberty did to you'#which is like. i KNOW i read some personal essay by some famous female screenwriter whose name i'm blanking on#that was *entirely* about her adolescent Desire to Grow Breasts#it's not that feeling dubious abt yr body changing *can't* be a Cis Female Experience—#[bc ultimately i do believe like. Gender is a bunch of different things in uneasy harness#(more on this another time probably)#but definitely one of those things is 'the particular lens we personally choose to view our own experiences through'#so if afab!you decide yr a woman? yr experiences are those of a cis woman‚ even if they're statistically speaking uncommon for cis women]#—but it definitely is not a universal one#(and tbh i rather suspect not even a common one‚ although i don't remotely pretend to have data on that point?)#anyway like. if you aren't trying to make claims abt the universality of an experience: first person is a tool available to you!#consider using it!#i think honestly people deploy the universalizing 'you' in ways that are totally invisible to them and it's often alienating-to-harmful#but like. we're so primed to Seek Social Validation that we often phrase things in ways that are like. subtle equivalents of latin nonne#and it's like. this is a power move actually! you don't even realize you're making it!#anyway i'm just a lobbyist for like. understanding what you're doing and doing it on purpose#language#metatumbling
12 notes
·
View notes
Text
DB (animal protection agency) who've been suing NKK for breeding english bulldogs and cavaliers (claiming they're inherently unhealthy to a point where it violates welfare laws) has now reached out to NKK for the latest health statistics including BOAS grades. Which is fuckin rich, considering DB contacted Jane Ludlow to keep the BOAS grading scheme from being adopted by NKK in the first place.
#im so disappointed in them nothing really surprises me anymore#congrats you may or may not have achieved a registration ban on cavaliers that also keeps them from getting accountability & health tools#not banned breeding them. just registering them#get out#also: all of the results. ALL OF THEM. are publicly available. as is the statistic/report tool and the excel download button.
15 notes
·
View notes
Photo
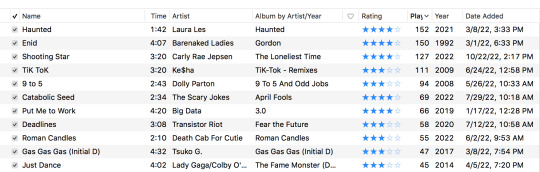
happy Social Media Music Share Time- i almost exclusively listen to my hoarded mp3 collection, so here’s my most listened songs out of the stuff i added to my itunes in 2022. i’m concerned to see that Enid by the Barenaked Ladies is 4 minutes long and i’ve only listened to it two less times than Haunted. i was doing so normal last march
#no way to tell how many times i listened to a specific song this year otherwise so it has to be JUST songs i added this past year#i need a text post tag#i want to steal sp0tify's tools for seeing statistics. i love statistics but i hate sp0tify
13 notes
·
View notes
Text
my favorite statistics professor (i've only had one but like hear me out) is leaving the uni forever. no one will tell lame jokes about statistics anymore. truly a great loss to everyone.
#apparently academic comitee were dicks to him and he resigned#which is!!! so!!! sad!!!!#he was. like. The Guy. The Logical Guy#he really was ready to teach everyone and make things better#him and my physio profs#who just are guys passionate about physiology#they all made me love science#like yeah!!! we just want to find out stuff!!!#but you know at the end of the day even though academia might be a rotten greedy glory and status machine#it is worth it if its you and your advisor against mechanisms of nature#and it is worth it if you have all the tools (statistics) to work with to make sense of what you're doing and claiming#man man man#the future in academia is not bright but if there is someone like me who has knocked their head and loves science and wants to do it#i would like to be there for them just like my professors did for me#yes the system is rigged yes it sucks BUT IT CAN GET BETTER#if it's just for one guy who really loves biology it is enough
2 notes
·
View notes
Text
the funny thing about that one scene in Inquisition where Sloan first questions Julian and is all buddy-buddy with him so that he goes from hackles raised to ready to go get beers, is that it tells us if Sloan/Section 31 really wanted to they probably could’ve gotten Julian on their side and slippery-sloped his morality and way of thinking around to theirs
#like he was ready to surrender to save lives in Statistical Probabilities. he could logic his brain around to murder is sometimes okay#anyways. that is all to say i dont think they wanted him as a regular agent in so much as the rare tool
7 notes
·
View notes
Note
just took the raads-r test and i got 92 as well lol. score buddies 🤝
Aw yeah score buddies 🤝
#i was actually looking more into the raads-r test this morning#bc that sucker is an Actual diagnostic tool and i wanted to see the statistics of how verified it is#and it looks like back in 2011 it was found to be Very affective at predicting an autism diagnosis#but more recently a study has called that into question#(and i mean i had my concerns when i saw that the test’s name includes the word aspergers like oh okay so this is pre-dsm-5 stuff. noted)#BUT it looks like there’s two main tools for adult autism diagnosis and the raads-r is one of them#so ¯\_(ツ)_/¯#i would say if you’re someone who scored high on it you should at least be aware that things talking about autism might be relevant to you#ask#anonymous#sepulchritudinous
17 notes
·
View notes
Text
ANOVA Analysis
This is the task of Week 1 of the course Data Analysis Tools at the Coursera Plataform. The challenge is to execute an Analysis of Variance using the ANOVA Statistical Test. This type of analysis assesses whether the means of two or more groups are statistically different from each other. Is used whenever you want to compare the means (quantitative variables) of groups (categorical variables). The null hypothesis is that there is no difference in the mean of the quantitative variable across groups (categorical variable), while the alternative is that there is a difference.
DataSet Used – Gap Minder
Gapminder identifies systematic misconceptions about important global trends and proportions and uses reliable data to develop easy to understand teaching materials to rid people of their misconceptions.
Gapminder is an independent Swedish foundation with no political, religious, or economic affiliations.
should visit it: https://www.gapminder.org/.
The dataset used has 16 variables and 213 rows. I choosed to analyze income per person (incomeperperson) and life expectancy (lifeexpectancy).
And how is the Question?
Is the life expectancy different among four categories of income per person (A,B,C,D,E)?
Since the income per person is a quantitative variable, I transformed it into a categorical variable, using parameters sugested by IBGE to classify the social class of according of income. For the parameters, I analyzed the boxplot posted below.

the data in image is in portuguese, because the IBGE is an Brazilian institute.
The Code
I used the Anaconda to code in Python for this task. The code is posted below.
import numpy
import pandas as pd
import statsmodels.api as sm
import statsmodels.formula.api as smf
import statsmodels.stats.multicomp as multi
import matplotlib.pyplot as plt
import seaborn as sns
import researchpy as rp
import pycountry_convert as pc
df = pd.read_csv('gapminder.csv')
df = df[['lifeexpectancy', 'incomeperperson']]
df['lifeexpectancy'] = df['lifeexpectancy'].apply(pd.to_numeric, errors='coerce')
df['incomeperperson'] = df['incomeperperson'].apply(pd.to_numeric, errors='coerce')
def income_categories(row):
if row["incomeperperson"]>15000:
return "A"
elif row["incomeperperson"]>5000:
return "B"
elif row["incomeperperson"]>3000:
return "C"
elif row["incomeperperson"]>1000:
return "D"
else:
return "E"
df=df[(df['lifeexpectancy']>=1) & (df['lifeexpectancy']<=120) & (df['incomeperperson'] > 0) ]
df["Income_category"]=df.apply(income_categories, axis=1)
df = df[["Income_category","incomeperperson","lifeexpectancy"]].dropna()
df["Income_category"]=df.apply(income_categories, axis=1)
print (rp.summary_cont(df['lifeexpectancy']))
fig1, ax1 = plt.subplots()
df_new = [df[df['Income_category']=='A']['lifeexpectancy'], df[df['Income_category']=='B']['lifeexpectancy'], df[df['Income_category']=='C']['lifeexpectancy'], df[df['Income_category']=='D']['lifeexpectancy'], df[df['Income_category']=='E']['lifeexpectancy']]
ax1.set_title('life expectancy')
ax1.boxplot(df_new)
plt.show()
results = smf.ols('lifeexpectancy ~ C(Income_category)', data=df).fit()
print (results.summary())
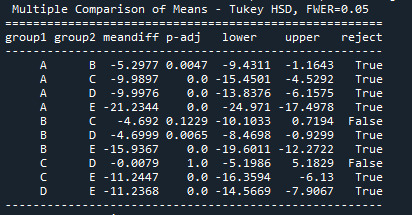
print ("Tukey")
mc1 = multi.MultiComparison(df['lifeexpectancy'], df['Income_category'])
print (mc1)
res1 = mc1.tukeyhsd()
print (res1.summary())
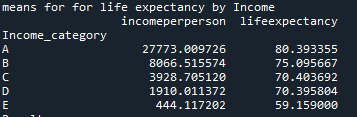
print ('means for for life expectancy by Income')
m1= df.groupby('Income_category').mean()
print (m1)
print ('Results')
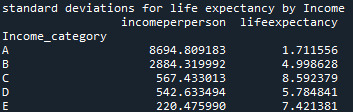
print ('standard deviations for life expectancy by Income')
sd1 = df.groupby('Income_category').std()
print (sd1)
Results – ANOVA Analysis
Aiming to answer the question of the task, I ran a test ANOVA. As shown below, from the 176 rows, 171 were used for the test, i have used a filter to remove some wrong values, as non numeric, negative, etc, reducing the rows of the original dataset

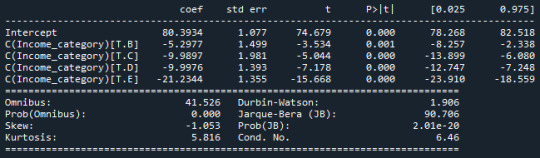
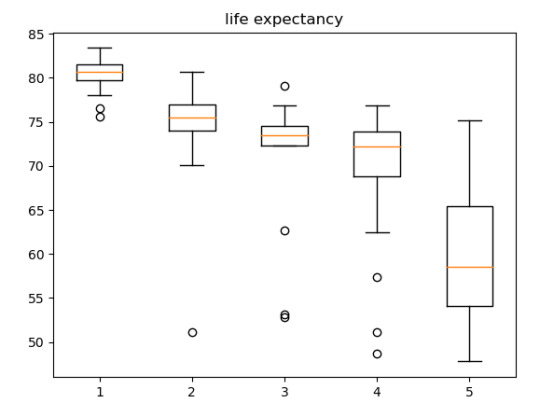
The ANOVA analysis shows a graph for each category (above) and, as we can see, the life expectancy of A class, have the life expectative of 80.39 years while the E class have the life expectative of 59.15 years.
2 notes
·
View notes
Text
5 Methods of Data Collection for Quantitative Research
Discover five powerful techniques for gathering quantitative data in research, essential for uncovering trends, patterns, and correlations. Explore proven methodologies that empower researchers to collect and analyze data effectively.
#Quantitative research methods#Data collection techniques#Survey design#Statistical analysis#Quantitative data analysis#Research methodology#Data gathering strategies#Quantitative research tools#Sampling methods#Statistical sampling#Questionnaire design#Data collection process#Quantitative data interpretation#Research survey techniques#Data analysis software#Experimental design#Descriptive statistics#Inferential statistics#Population sampling#Data validation methods#Structured interviews#Online surveys#Observation techniques#Quantitative data reliability#Research instrument design#Data visualization techniques#Statistical significance#Data coding procedures#Cross-sectional studies#Longitudinal studies
0 notes
Text
Local SEO: What Is It & How to Do It
Introduction:

What Is Local SEO?

Why Is Local SEO Important?
Community Connection:
Local SEO allows businesses to connect with their immediate community. When potential customers search for products or services in their vicinity, a robust local online presence ensures that your business is front and center.
Mobile Dominance:
With the rise of mobile devices, local searches have become increasingly prevalent. People often turn to their smartphones to find nearby businesses, making Local SEO essential for capturing this mobile-driven market.
Increased Visibility:
A strong Local SEO strategy can elevate your business in local search rankings. This heightened visibility translates to more website traffic, foot traffic, and ultimately, increased sales.
Trust and Credibility:
Local customers are more likely to trust businesses that appear in local search results. Local SEO helps build trust by showcasing your business’s proximity and relevance to potential customers.
How Local SEO Works:
Google My Business (GMB):
Claiming and optimizing your Google My Business listing is the cornerstone of local SEO. Ensure that your GMB profile is complete with accurate information, such as your business name, address, phone number, business hours, and high-quality images.
Local Keywords:
Incorporate locally relevant keywords into your website content. This includes mentioning your city, neighborhood, or region in your meta descriptions, headers, and throughout your website.
Local Citations:
Consistent business information across online directories and platforms is crucial. Ensure that your business name, address, and phone number (NAP) are consistent across various online directories, including Yelp, Yellow Pages, and other industry-specific platforms.
Online Reviews:
Encourage customers to leave reviews on your Google My Business profile and other review platforms. Positive reviews not only enhance your reputation but also contribute to your local search ranking.

How to Do Local SEO:
Optimize Your Website:
Ensure that your website is optimized for local searches. Include your location in meta tags, headers, and content. Create location-specific landing pages if your business operates in multiple areas.
Mobile Optimization:
Make your website mobile-friendly. A responsive design ensures a positive user experience for visitors on various devices, contributing to better search rankings.
Content Creation:
Develop locally relevant content on your website. This can include blog posts, articles, or resources that address the specific needs and interests of your local audience.
Local Link Building:
Build local backlinks by partnering with other local businesses, participating in community events, or sponsoring local organizations. Local links strengthen your local SEO efforts.
Local SEO Tools:
Google My Business:
Leverage the features within Google My Business, such as posts, Q&A, and insights, to enhance your local presence.
Moz Local:
Moz Local helps manage your business listings and monitor your online presence across various platforms.
BrightLocal:
BrightLocal offers a suite of tools for local SEO, including local search rank tracking, citation building, and reputation management.
Yext:
Yext is a comprehensive platform for managing your business information across multiple online directories and platforms.

Monitor Results and Keep Optimizing:
Analytics:
Regularly monitor your website analytics, Google My Business insights, and other relevant data to track the performance of your local SEO efforts.
Customer Feedback:
Pay attention to customer feedback and reviews. Address any concerns promptly and use positive feedback to your advantage.
Adapt to Algorithm Changes:
Stay informed about changes in search engine algorithms. Adapt your local SEO strategy to align with any updates that may impact your search rankings.

Google Local Pack:
Businesses appearing in the Google Local Pack receive 44% of the clicks, making it a prime spot for local visibility.
Local Searches Lead to Action:
88% of local searches on mobile devices result in either a call or a visit to the business within 24 hours.
Importance of Reviews:
91% of consumers aged 18-34 trust online reviews as much as personal recommendations, emphasizing the significance of positive reviews in local SEO.
Local SEO and Voice Search:
46% of voice search users look for local businesses daily. Optimizing for voice search can further boost your local SEO efforts.
Conclusion:
In the ever-evolving digital landscape, mastering the art of Local SEO is a crucial step for businesses aiming to thrive in their local communities. By understanding the importance of local search optimization, implementing effective strategies, utilizing the right tools, and staying vigilant in monitoring results, you can position your business as a local powerhouse, connecting with customers right in your neighborhood. So, gear up, embrace the world of local SEO, and watch your business flourish in the local limelight!
#Local SEO: What Is It & How to Do It#How Local SEO Works:#What Is Local SEO?#Why Is Local SEO Important?#How to Do Local SEO:#Local SEO Tools:#Monitor Results and Keep Optimizing:#Local SEO Statistics:
0 notes
Text
Top 10 Data Analytics Tools Every Student Should Know

Introduction
In today's fast-paced, data-centric world, the ability to harness the power of data is becoming increasingly crucial across all academic disciplines. Whether you're a business major analyzing market trends, an engineering student optimizing processes, or a social sciences enthusiast conducting research, proficiency in data analytics is a skill that can elevate your academic and professional pursuits to new heights. However, with a plethora of tools available, knowing where to start can be overwhelming. Fear not! Here, we unveil the top 10 data analytics tools that every student should acquaint themselves with, focusing on data visualization and statistical analysis software.
Tableau Public: Dive headfirst into the realm of data visualization with Tableau Public. This user-friendly tool empowers students to craft captivating charts, graphs, and dashboards, transforming raw data into compelling visual narratives that are both insightful and easy to comprehend.
Microsoft Excel: A timeless classic in the world of data analysis, Excel remains an indispensable ally for students at every level. With its robust suite of features for data organization, manipulation, and analysis, Excel is a reliable companion for tackling a wide array of analytical tasks.
Google Sheets: Seamlessly blending collaboration with accessibility, Google Sheets offers students a versatile platform for data analysis. From statistical functions to integration with other Google services, it's a convenient choice for both individual and group projects.
RStudio: Delve deeper into statistical analysis and programming with RStudio. Tailored specifically for R programming, this comprehensive environment equips students with the tools they need to explore data, create visualizations, and conduct sophisticated statistical modeling.
Python: Embrace the power of versatility with Python. Loved by data analysts and programmers alike, Python's extensive libraries such as Pandas, NumPy, and Matplotlib facilitate efficient data manipulation, analysis, and visualization, making it a go-to tool for students seeking flexibility in their analytics endeavors.
IBM SPSS Statistics: For students venturing into advanced statistical analysis, IBM SPSS Statistics is a trusted companion. Offering a plethora of capabilities for data manipulation, descriptive statistics, and hypothesis testing, it's particularly beneficial for those in social sciences and research-oriented fields.
SAS: Step into the realm of advanced analytics with SAS. Renowned for its prowess in data management, predictive modeling, and statistical analysis, SAS caters to a diverse range of analytical needs in both academia and industry.
Jupyter Notebook: Embrace the interactive storytelling of data with Jupyter Notebook. This open-source web application allows students to seamlessly combine live code, equations, visualizations, and narrative text, fostering collaboration and creativity in data analysis projects across various programming languages.
Power BI: Navigate the world of business analytics with Power BI. Developed by Microsoft, this intuitive tool enables students to visualize and share insights from their data through interactive dashboards and reports, facilitating data-driven decision-making in real-time.
Qlik Sense: Embark on a journey of dynamic data exploration with Qlik Sense. With its associative engine and modern approach to analytics, Qlik Sense empowers students to uncover intricate relationships within their data, fostering a deeper understanding and insight-driven decision-making.
In conclusion,
The journey towards proficiency in data analytics begins with the right tools. By familiarizing themselves with these Data visualization and statistical analysis tools, students can equip themselves with the skills necessary to thrive in today's data-driven landscape. Whether analyzing market trends, conducting research, or making data-driven decisions, having the right tools at their disposal empowers students to turn raw data into actionable insights, setting them apart on their path to success.
Suggested Blogs: - big data strategies
data-driven strategies
data analytics techniques
0 notes
Text
Optimizing SQL Server: Reducing CPU Usage While Maintaining Performance
Delving into the realm of SQL Server optimization, this piece sheds light on tactical maneuvers to dial down CPU consumption while safeguarding the server’s zest. It’s a tightrope walk between leveraging your server to its full potential and ensuring it doesn’t break a sweat beyond the 50% mark. Here, we unravel the methodology to gauge the efficiency of CPU usage trimming efforts, spotlight…
View On WordPress
#plan cache duration statistics#reduce SQL Server CPU usage#SQL Server Monitoring Tools#SQL Server performance optimization#SQL Server query optimization
0 notes
Link
#data science#data analytics#data visualization#big data#machinelearning#statistics#data engineering#etl tools#etl
1 note
·
View note
Text
it's rude as fuck to hop on a stranger's post to "correct them" about their own personal life experiences, but many people on this website seem to see this as totally normal behavior
#yeah annoying when it happens to me but#it's 10000x more annoying seeing people do this shit to people who are literally experiencing a genocide#someone will be talking about how they lost their whole family to a US bomb and there will be someone in the notes/comments/RTs/etc#responding with ''statistics'' and ''sources to compare to for verification that they're telling the truth''#as if mainstream news that only see dead palestinians as numbers would be a more reliable source#than hearing about it from the people experiencing it firsthand & in real time#it's the racism! can't believe anything a brown person says unless it's been peer reviewed and repurposed by white people!#it's especially insidious whenever they're like ''you have to support a vote for the man who sent the weapons that killed your family''#this genocide has shown just how many white people/westerners see brown & black people as political tools & collateral damage#.bdo
0 notes
Last Seen Blogs

majujpjack
Sem título

gympreneurs
Gympreneurs Official

poetsandwriters
Lines We Live By

rinstaro
K O R E