#Landsat-8
Video
Wildfires in Sicily da European Space Agency
Tramite Flickr:
Wildfires around the city of Palermo in Sicily, Italy, captured by the Landsat-8 mission on 25 July 2023. Data from the mission's SWIR bands, which penetrate the smoke of the fire, has been overlaid on the optical image to provide a clearer view of the fire front and affected area at the time of the acquisition. Credits: USGS/ESA
#ESA#European Space Agency#Space#Space Technology#Earth from Space#Observing the Earth#Earth Observation#Earth Explorer#Satellite image#Wildfires#Sicily#Sicilia#Italy#Italia#Palermo#Fire#Landsat-8#flickr
0 notes
Text
Pan-sharpening a composite 3-band 4-3-2 RGB true colour Landsat-8 satellite image of Gebel Asyut el-Gharbi
How do you enhance the resolution of a composite 3 band satellite image? Here's how!
In my previous post, I described how to create a composite true colour Landsat-8 image in ArcGIS for use as a base map. The resulting colour image had the same resolution as the three bands (red, green and blue) combined to create it. Landsat-8 visible light (red, green and blue) bands, near infra-red (NIR), and short-wave infra-red (SWIR) bands are 30m resolution. Thermal infra-red (TIR) bands…

View On WordPress
#ArcGIS#archaeology#Asyut#Egypt#Gebel Asyut el-Gharbi#GIS#Landsat-8#Pan-sharpening#Satellite imagery#Satellite remote sensing
0 notes
Text
NASA Inspires Your Crafty Creations for World Embroidery Day
It’s amazing what you can do with a little needle and thread! For #WorldEmbroideryDay, we asked what NASA imagery inspired you. You responded with a variety of embroidered creations, highlighting our different areas of study.
Here’s what we found:
Webb’s Carina Nebula
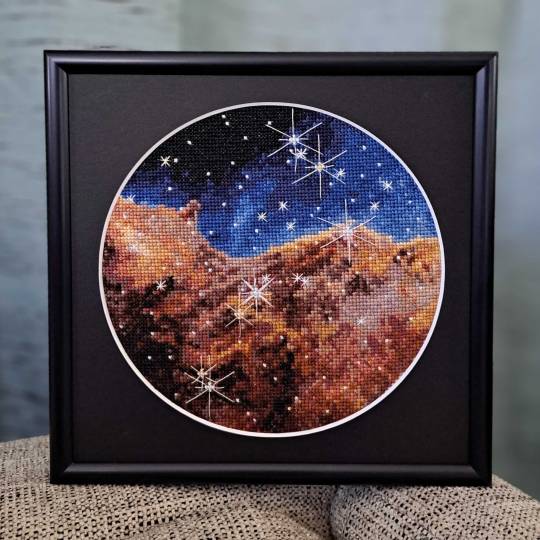
Wendy Edwards, a project coordinator with Earth Science Data Systems at NASA, created this embroidered piece inspired by Webb’s Carina Nebula image. Captured in infrared light, this image revealed for the first time previously invisible areas of star birth. Credit: Wendy Edwards, NASA. Pattern credit: Clare Bray, Climbing Goat Designs
Wendy Edwards, a project coordinator with Earth Science Data Systems at NASA, first learned cross stitch in middle school where she had to pick rotating electives and cross stitch/embroidery was one of the options. “When I look up to the stars and think about how incredibly, incomprehensibly big it is out there in the universe, I’m reminded that the universe isn’t ‘out there’ at all. We’re in it,” she said. Her latest piece focused on Webb’s image release of the Carina Nebula. The image showcased the telescope’s ability to peer through cosmic dust, shedding new light on how stars form.
Ocean Color Imagery: Exploring the North Caspian Sea
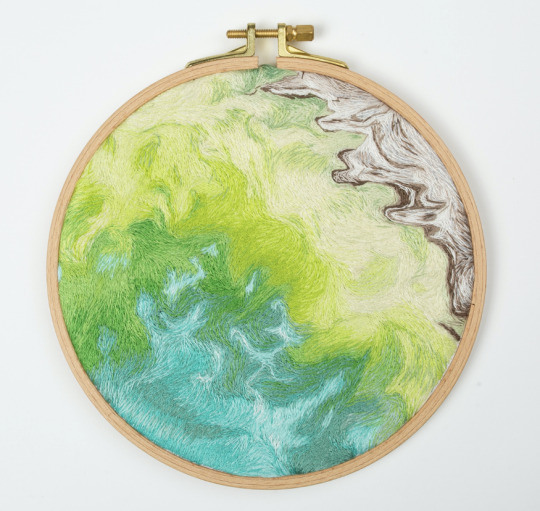
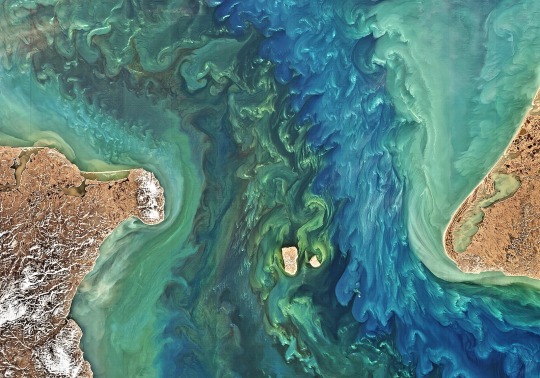
Danielle Currie of Satellite Stitches created a piece inspired by the Caspian Sea, taken by NASA’s ocean color satellites. Credit: Danielle Currie/Satellite Stitches
Danielle Currie is an environmental professional who resides in New Brunswick, Canada. She began embroidering at the beginning of the Covid-19 pandemic as a hobby to take her mind off the stress of the unknown. Danielle’s piece is titled “46.69, 50.43,” named after the coordinates of the area of the northern Caspian Sea captured by LandSat8 in 2019.
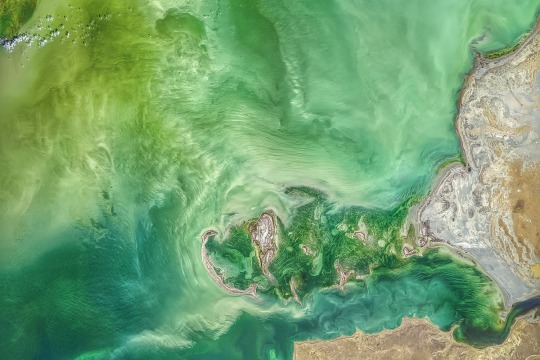
An image of the Caspian Sea captured by Landsat 8 in 2019. Credit: NASA
Two Hubble Images of the Pillars of Creation, 1995 and 2015
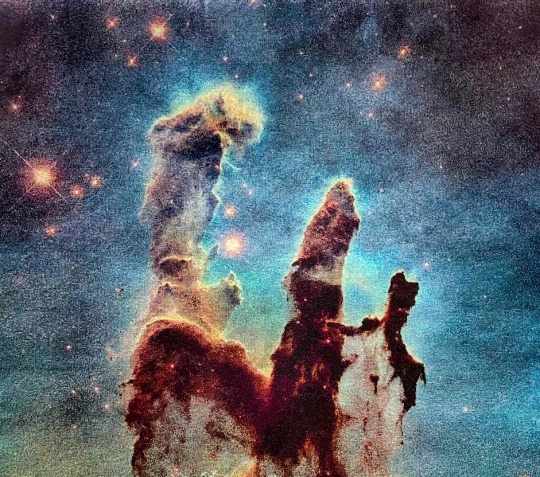
Melissa Cole of Star Stuff Stitching created an embroidery piece based on the Hubble image Pillars of Creation released in 1995. Credit: Melissa Cole, Star Stuff Stitching
Melissa Cole is an award-winning fiber artist from Philadelphia, PA, USA, inspired by the beauty and vastness of the universe. They began creating their own cross stitch patterns at 14, while living with their grandparents in rural Michigan, using colored pencils and graph paper. The Pillars of Creation (Eagle Nebula, M16), released by the Hubble Telescope in 1995 when Melissa was just 11 years old, captured the imagination of a young person in a rural, religious setting, with limited access to science education.
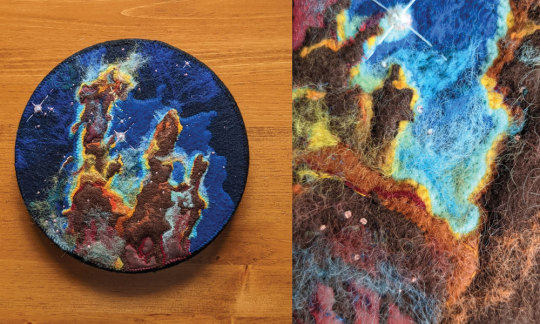
Lauren Wright Vartanian of the shop Neurons and Nebulas created this piece inspired by the Hubble Space Telescope’s 2015 25th anniversary re-capture of the Pillars of Creation. Credit: Lauren Wright Vartanian, Neurons and Nebulas
Lauren Wright Vartanian of Guelph, Ontario Canada considers herself a huge space nerd. She’s a multidisciplinary artist who took up hand sewing after the birth of her daughter. She’s currently working on the illustrations for a science themed alphabet book, made entirely out of textile art. It is being published by Firefly Books and comes out in the fall of 2024. Lauren said she was enamored by the original Pillars image released by Hubble in 1995. When Hubble released a higher resolution capture in 2015, she fell in love even further! This is her tribute to those well-known images.
James Webb Telescope Captures Pillars of Creation

Darci Lenker of Darci Lenker Art, created a rectangular version of Webb’s Pillars of Creation. Credit: Darci Lenker of Darci Lenker Art
Darci Lenker of Norman, Oklahoma started embroidery in college more than 20 years ago, but mainly only used it as an embellishment for her other fiber works. In 2015, she started a daily embroidery project where she planned to do one one-inch circle of embroidery every day for a year. She did a collection of miniature thread painted galaxies and nebulas for Science Museum Oklahoma in 2019. Lenker said she had previously embroidered the Hubble Telescope’s image of Pillars of Creation and was excited to see the new Webb Telescope image of the same thing. Lenker could not wait to stitch the same piece with bolder, more vivid colors.
Milky Way
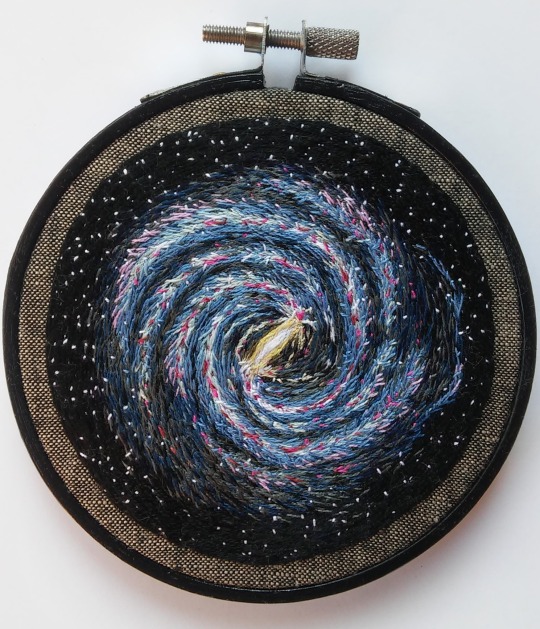
Darci Lenker of Darci Lenker Art was inspired by NASA’s imaging of the Milky Way Galaxy. Credit: Darci Lenker
In this piece, Lenker became inspired by the Milky Way Galaxy, which is organized into spiral arms of giant stars that illuminate interstellar gas and dust. The Sun is in a finger called the Orion Spur.
The Cosmic Microwave Background
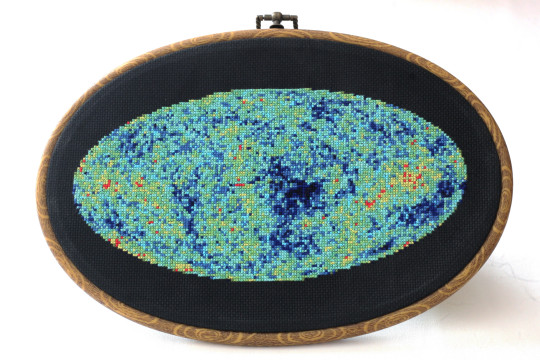
This image shows an embroidery design based on the cosmic microwave background, created by Jessica Campbell, who runs Astrostitches. Inside a tan wooden frame, a colorful oval is stitched onto a black background in shades of blue, green, yellow, and a little bit of red. Credit: Jessica Campbell/ Astrostitches
Jessica Campbell obtained her PhD in astrophysics from the University of Toronto studying interstellar dust and magnetic fields in the Milky Way Galaxy. Jessica promptly taught herself how to cross-stitch in March 2020 and has since enjoyed turning astronomical observations into realistic cross-stitches. Her piece was inspired by the cosmic microwave background, which displays the oldest light in the universe.

The full-sky image of the temperature fluctuations (shown as color differences) in the cosmic microwave background, made from nine years of WMAP observations. These are the seeds of galaxies, from a time when the universe was under 400,000 years old. Credit: NASA/WMAP Science Team
GISSTEMP: NASA’s Yearly Temperature Release
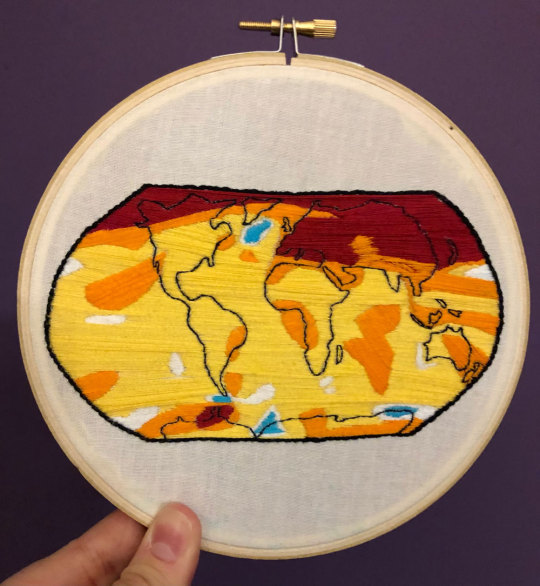
Katy Mersmann, a NASA social media specialist, created this embroidered piece based on NASA’s Goddard Institute for Space Studies (GISS) global annual temperature record. Earth’s average surface temperature in 2020 tied with 2016 as the warmest year on record. Credit: Katy Mersmann, NASA
Katy Mersmann is a social media specialist at NASA’s Goddard Space Flight Center in Greenbelt, Md. She started embroidering when she was in graduate school. Many of her pieces are inspired by her work as a communicator. With climate data in particular, she was inspired by the researchers who are doing the work to understand how the planet is changing. The GISTEMP piece above is based on a data visualization of 2020 global temperature anomalies, still currently tied for the warmest year on record.
In addition to embroidery, NASA continues to inspire art in all forms. Check out other creative takes with Landsat Crafts and the James Webb Space telescope public art gallery.
Make sure to follow us on Tumblr for your regular dose of space!
#NASA#creativity#fiber art#embroidery#art#art challenge#needlework#crafts#handmade#textile art#cross stitch#stitching#inspiration#inspo#Earth#Earth science#Hubble#James Webb Space Telescope#climate change#water#nebula#stars
6K notes
·
View notes
Text
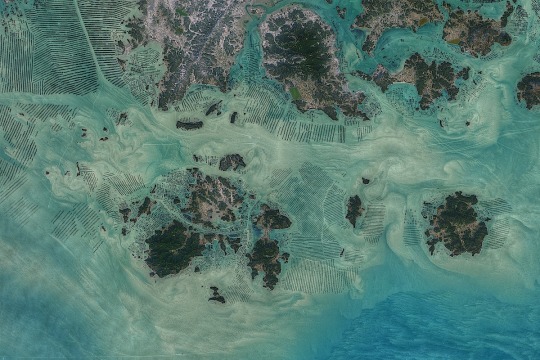
Some cool satellite imagery I collected for something at work. All images are taken from NASA's Ocean Color Web at the Ocean Biology Distributed Active Archive Center (OB.DAAC).
Info about each image under cut.
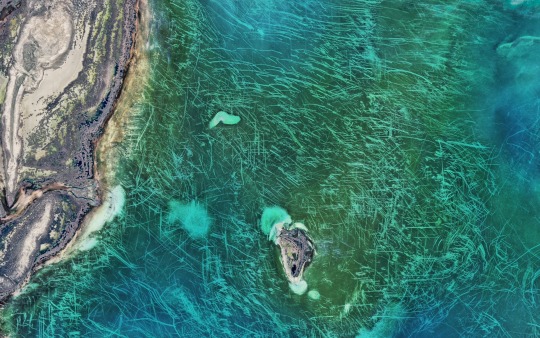
1. South Korean Aquaculture - Aquaculture operations off the southern end of the Korean Peninsula, featuring tide-drive swirls of suspended sediment and phytoplankton (captured by Landsat 8 on Feb. 19, 2021)
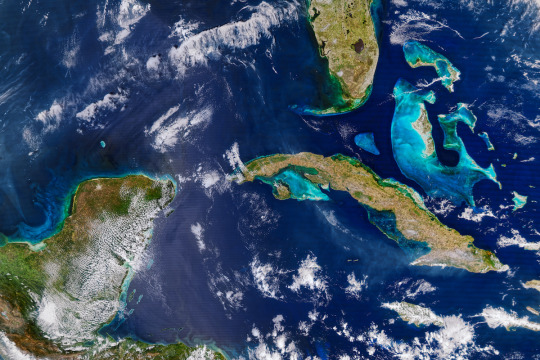
2. Smoke on Blue Waters - Coastal waters of the SE Gulf of Mexico, Western Caribbean Sea, and Lucayan Archipelago. Smoke plumes from forest fires in Cuba can also be seen (captured by Aqua-MODIS sensor on March 1, 2023)
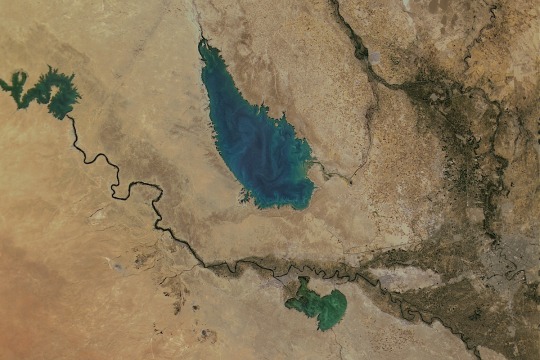
3. Mesopotamia- The artificial Lake Tharthar near Baghdad and the Tigris and Euphrates Rivers (captured by SeaHawk/HawkEye on September 11, 2021)
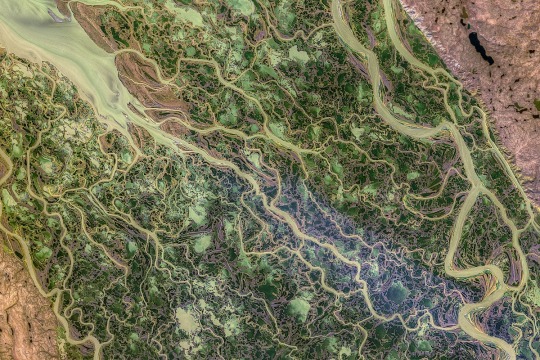
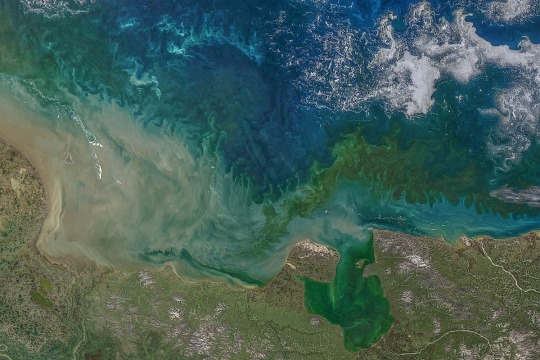
4. Mackenzie River Delta - A heavy sediment load delivered by Canada's Mackenzie River to its delta by the Beaufort Sea (collected by Landsat 8 on September 9, 2021)
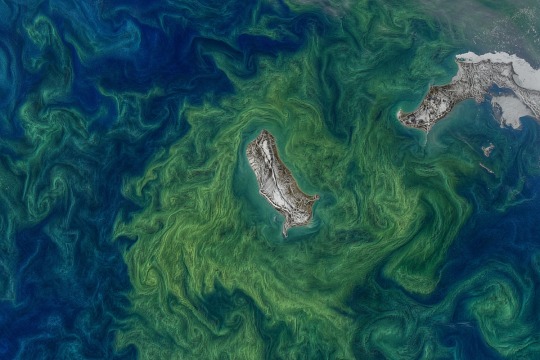
5. Svenskøya - Dense blooms of phytoplankton around the island of Svenskøya in the Svalbard Archipelago (captured by Landsat 8 on July 6, 2021)
6. East Siberian Sea - Color from phytoplankton, suspended sediments, and colored dissolved organic matter from sea ice (captured by Aqua/MODIS on July 20, 2020)
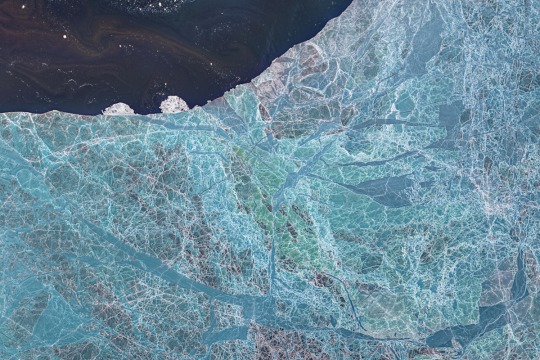
7. Laptev Sea Ice - Thin sea ice in the southern Laptev Sea transmitting colors of water, algae, sediment, colored dissolved organic matter, and the ice itself (captured by Landsat 8 on June 12, 2020)
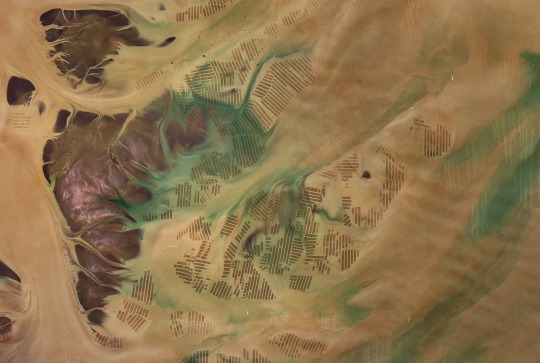
8. Chinese Aquaculture - Aquaculture in the Yellow Sea off the coast of Jiangsu Province (captured by Landsat 8 on March 8, 2017)
9. Ice Gouges in the Caspian Sea - Lines on the floor of the Caspian Sea in the Tyuleniy Archipelago that were gouged out by ice (captured by Landsat 8/OLI on April 6, 2016)
10. The Bering Strait - The Bering Strait joining the Bering (south) and Chukchi (north) seas. It is the only connection between the Pacific and Arctic Oceans (captured by Landsat-8/OLI on June 17, 2015)
27 notes
·
View notes
Photo
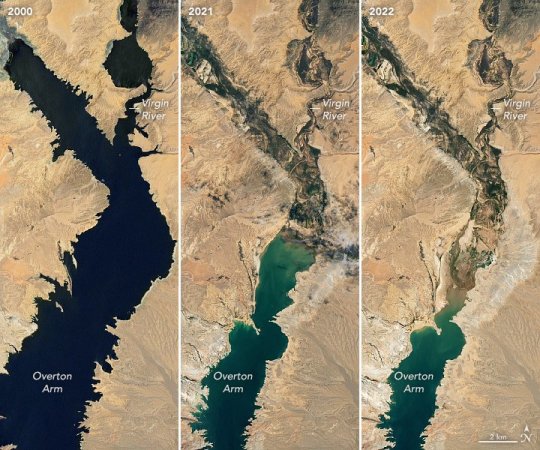
Lake Mead Keeps Dropping
Continuing a 22-year downward trend, water levels in Lake Mead stand at their lowest since April 1937, when the reservoir was still being filled for the first time. As of July 18, 2022, Lake Mead was filled to just 27 percent of capacity.
Continuing a 22-year downward trend, water levels in Lake Mead stand at their lowest since April 1937, when the reservoir was still being filled for the first time. As of July 18, 2022, Lake Mead was filled to just 27 percent of capacity.
The largest reservoir in the United States supplies water to millions of people across seven states, tribal lands, and northern Mexico. It now also provides a stark illustration of climate change and a long-term drought that may be the worst in the U.S. West in 12 centuries.
The low water level comes at time when 74 percent of nine Western states face some level of drought; 35 percent of the area is in extreme or exceptional drought. In Colorado, location of the headwaters of the Colorado River, 83 percent of the state is now in drought, and the snowpack from last winter was below average in many places.
The natural-color images above were acquired on July 6, 2000, and July 3, 2022, by Landsat 7 and Landsat 8. The detailed images below also include a view from Landsat 8 on July 8, 2021 (middle). The light-colored fringes along the shorelines in 2021 and 2022 are mineralized areas of the lakeshore that were formerly underwater when the reservoir was filled closer to capacity. The phenomenon is often referred to as a “bathtub ring.”
The lake elevation data below come from the U.S. Bureau of Reclamation (USBR), which manages Lake Mead, Lake Powell, and other portions of the Colorado River watershed. As of July 18, 2022, the water elevation at the Hoover Dam was 1041.30 feet (317.4 meters) above sea level; the water elevation at the end of July 2000 (around the time of the Landsat 7 image above) was 1199.97 feet (341 meters). Lake levels at the dam should stay above 1000 feet to continue operating hydropower turbines at normal levels.
At maximum capacity, Lake Mead would reach an elevation 1,220 feet (372 meters) near the dam and would hold 9.3 trillion gallons (36 trillion liters) of water. The lake last approached full capacity in the summers of 1983 and 1999.
About 10 percent of the water in Lake Mead comes from local precipitation and groundwater each year, with the rest coming from snowmelt in the Rocky Mountains that flows down the Colorado River watershed through Lake Powell, Glen Canyon, and the Grand Canyon. The Colorado River basin is managed by USBR and other agencies to provide electric power and water to roughly 40 million people—most notably the cities of San Diego, Las Vegas, Phoenix, Los Angeles—and 4 to 5 million acres of farmland in the Southwest. The river water is allotted to states (including tribal lands) and Mexico through laws like the 1922 Colorado River Compact.
Above Lake Mead, Lake Powell is currently filled to just 27 percent of capacity, and the entire Colorado river system stands at 35 percent. USBR announced in August 2021 that state water allocations would be cut in 2022; further modeling and negotiation is underway for 2023 allocations. In June 2022, USBR issued an emergency request to the Colorado River basin states to reduce water usage by 2 million to 4 million acre-feet over the next 18 months.
In addition to serving as a major drinking and irrigation source for the Southwest, Lake Mead is a national recreation area that is particularly popular with boaters. According to the National Park Service, five of six boating ramps/launches are now closed. “Declining water levels due to climate change and 20 years of ongoing drought have reshaped the park’s shorelines,” the Park Service said on its website. “As Lake Mead continues to recede, extending launch ramps becomes more difficult and more expensive due to the topography and projected decline in water levels.”
NASA Earth Observatory images by Lauren Dauphin, using Landsat data from the U.S. Geological Survey and and lake elevation data from the Bureau of Reclamation. Story by Michael Carlowicz.
409 notes
·
View notes
Text
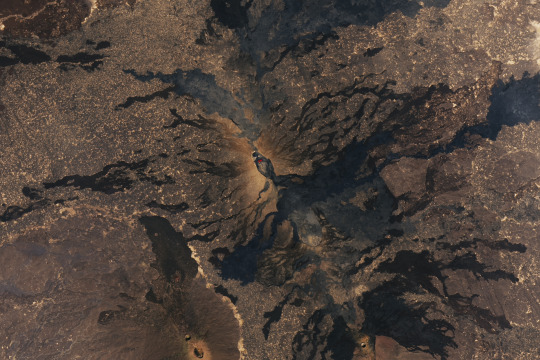
Erta Ale volcano in Ethiopia
The image was acquired by the OLI (Operational Land Imager) on Landsat 8 on November 27, 2023
15 notes
·
View notes
Text
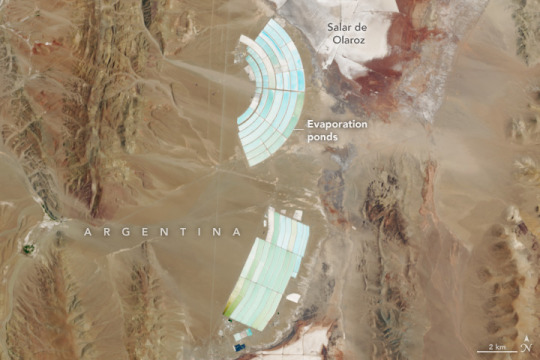
Mining Lithium in Argentina
Some of the largest known deposits of lithium—a soft silvery metal that powers batteries in cell phones, laptops, and electric vehicles—lie in one of the driest places on Earth. Much of the surveyed deposits of this metal are located in the arid salt flats of South America, where Chile, Argentina, and Bolivia meet.
The Altiplano-Puna Plateau is an elevated 500,000-square-kilometer area in the Central Andes, and the second highest plateau on Earth after the Tibetan Plateau. Several climatic and geologic factors converged in these dry plains to create large underground lithium deposits.
The Altiplano-Puna sits on one of Earth’s largest known reservoirs of active magma. Although the area receives very little precipitation (less than 30 centimeters [12 inches] a year), hydrothermal fluids associated with this volcanic activity naturally replenish underground aquifers. Over time, rocks containing trace quantities of lithium have weathered causing the metal to build up in the aquifers. According to the U.S. Geological Survey, about half of the world’s measured lithium resources are in these underground deposits in Bolivia, Argentina, and Chile, an area known as the “lithium triangle.”
The image above, acquired by the OLI (Operational Land Imager) on Landsat 8, shows lithium mines in northwestern Argentina’s Jujuy province, near the country’s border with Chile. The light blue evaporation ponds of the mines stand out. The mines are located just south of a large salt flat, known as the Salar de Olaroz.
To harvest the lithium, wells are tapped into the lithium-rich brine beneath the surface. They shunt the brine toward rectangular evaporation ponds lined with plastic. Once there, the briny mixture stays in the ponds for months at a time, where sunshine and wind separate out lithium, salt, and other substances through evaporation. This lithium-rich solution is then processed into lithium carbonate or lithium hydroxide.
Landsat images show the mine immediately adjacent to Salar de Olaroz has expanded several times since 2016, and it is now one of the largest lithium mines in Argentina. In 2018, evaporation ponds were developed for another mine 2 kilometers to the south. Global production of lithium has increased almost ten-fold over the last two decades, from approximately 15,000 metric tons in 2001 to 146,000 metric tons in 2022.
NASA Earth Observatory image by Wanmei Liang, using Landsat data from the U.S. Geological Survey. Story by Emily Cassidy.
9 notes
·
View notes
Text
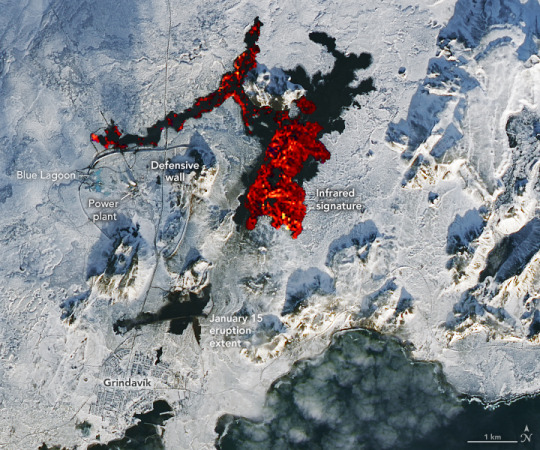
Another Eruption in Iceland
"After a lull in activity, fresh lava has once again poured from the Reykjanes peninsula in southwestern Iceland.
The latest eruption—the third in the region since December 2023—began early on February 8, 2024, with lava spraying up to heights of 80 meters (260 feet) along a 3-kilometer (1.8-mile) long fissure near Mount Sýlingarfell. The small peak is north of the fishing village Grindavík and east of the Svartsengi power station and Blue Lagoon geothermal spa.
The image above was acquired on February 10, 2024, by the OLI-2 (Operational Land Imager-2) on Landsat 9. Infrared and visible observations (bands 7-6-3) have been overlain on a natural-color image to help distinguish the heat signature of the lava. Still recent but cooler lava expelled near Grindavík in January appears black.
The topography around the fissure meant that much of the fresh lava flowed east into unpopulated areas rather than south toward Grindavík. Some lava also flowed west into the vicinity of the power plant and spa.
Earthen defensive walls protected both facilities, though lava did burn through a key hot water pipeline and two roads. According to the Icelandic National Broadcasting Service RÚV, authorities are in the process of restoring hot water to homes in the area after conducting repairs on the pipeline.
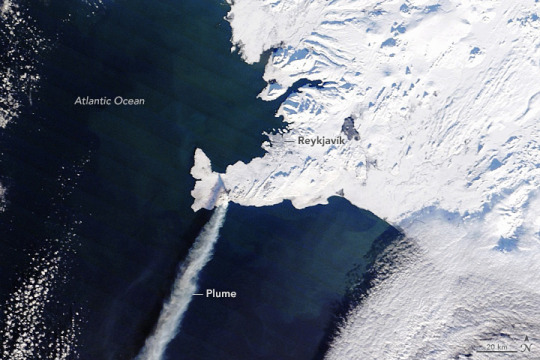
About seven hours after the eruption began, the MODIS (Moderate Resolution Imaging Spectroradiometer) on NASA’s Terra satellite captured this image of a plume of gas and ash streaming to the southwest. This eruption was effusive—not explosive like the Eyjafjallajökull eruption in 2010—and the plume contained minimal ash, so it did not cause any disruptions to either domestic or international flights.
Volcanic plumes like the one shown here typically contain water vapor, sulfur dioxide, carbon dioxide, and small amounts of other volcanic gases. Researchers from the Icelandic Met Office and the University of Iceland have noted that, at times, magma has interacted with groundwater, adding to the amount of water vapor in the plume. The TROPOMI (Tropospheric Monitoring Instrument) on the Sentinel-5 Precursor missionobserved sulfur dioxide (SO2) within the plume, Michigan Tech volcanologist Simon Carn noted on X.
After the initial burst of activity on February 8, the intensity of the eruption faded. In an update on February 9, the Icelandic Met Office reported that seismic sensors had stopped detecting volcanic tremors and that a recent drone flight showed no activity over the eruption site—signs that the latest eruption was ending.
However, on February 12, the agency reported that the land surface above an underground magma reservoir near Svartsengi had again begun to swell by 0.5 to 1 centimeters per day, a rate similar to what was observed prior to other recent eruptions. “It is therefore highly likely that the cycle continues in a few weeks with another dyke propagation and a volcanic eruption,” the agency said."
NASA Earth Observatory image by Lauren Dauphin, using MODIS data from NASA EOSDIS LANCE and GIBS/Worldview. Story by Adam Voiland.
8 notes
·
View notes
Text
WHY IS IT SO FUCKING HARD TO FIND OUT HOW TO CITE COPYRIGHTED DATASETS IN REPORTS???? JUST GIVE ME SOMETHING TO COPY AND PASTE AND LET ME BE DONE WITH IT
i feel like im chasing my fucking tail here!! NASA, babe, i desperately want to cite your Landsat 8 data that i used for my GIS report, but i cannot for the Life Of Me figure out how to do it.
#if anyone from nasa sees this#im so sorry#im just very stressed and everything is confusing#signed A Very Tired University Student
11 notes
·
View notes
Text
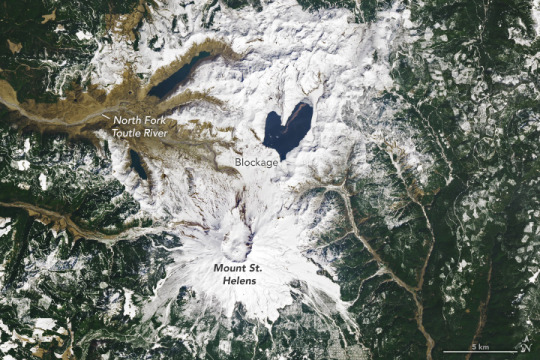
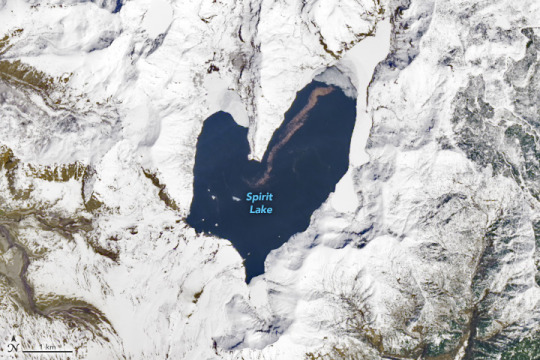
The Lovely Shape of Spirit Lake
"Spirit Lake is resilient. The lake and once-popular tourist site in south-central Washington was nearly obliterated in May 1980 during the events that unfolded around the cataclysmic eruption of Mount St. Helens. The lake survived, and it took on a lovely new shape.
The OLI (Operational Land Imager) on Landsat 8 acquired these images on April 26, 2023. A white blanket of snow contrasts with the dark-blue water, emphasizing the lake’s heart-like shape when viewed from above.
Prior to the eruption, Spirit Lake had a smaller footprint that consisted of west and east arms connected by a narrow span of water—similar in shape to the top-half of a heart. Then, on May 18, 1980, the volcano’s north flank let loose, producing the largest-known landslide in recorded history, followed by a lateral blast and shock wave as the eruption unfolded. The water in Spirit Lake was temporarily displaced but eventually flowed back into the basin.
A “new” lake reformed atop the debris from the landslide. The fully-heart shaped lake was broader and shallower, and the elevation of its surface higher by nearly 60 meters (200 feet). Some of the landslide debris formed a blockage, or natural dam, on the lake’s southwest side. Without an outlet, water levels continued to rise until engineers constructed a drainage tunnel in 1985.
From the 1920s through the 1970s, Spirit Lake drew tourists to its shores. Cabins and lodges lined the lake, and people could swim, boat, and fish in its waters. Today, those lakeside features are buried in avalanche debris below the modern lake.
Fishing and swimming are prohibited, and access is limited to preserve the site as a natural laboratory for studying the landscape’s recovery. For example, scientists think that the trees uprooted by the volcanic blast and still floating in the lake, visible as the brown line in the detailed image above, have become an important part of the lake’s ecosystem."
NASA Earth Observatory images by Wanmei Liang, using Landsat data from the U.S. Geological Survey. Story by Kathryn Hansen.
6 notes
·
View notes
Photo

With the weather getting warmer, the impact of uneven tree distribution on New York City’s streets become apparent yet again.
In connection with the newest #ArtOnTheStoop, Mona Chalabi created these two maps of Brooklyn highlighting the connection between temperature and trees based on data from the US Geological Survey’s Landsat 8 satellite published by the New York City Council, and a census of street trees in New York City conducted by volunteers working with NYC Parks.
You may notice from Chalabi’s work that greater concentrations of trees can be found in wealthier neighborhoods and that “greenery keeps the wealthier neighborhoods cooler in summer.” This data has serious health implications for those living in less tree-dense areas who are subject to higher air conditioning-related costs as well as increased risk for heatstroke and even death. “Doesn’t everyone deserve a little green shade, regardless of their race or income?”
#Brooklyn Museum#brooklyn#museum#art#Mona Chalabi#BkMSocialAction#MonaChalabiBkM#Illustration#climate crisis#data
104 notes
·
View notes
Photo
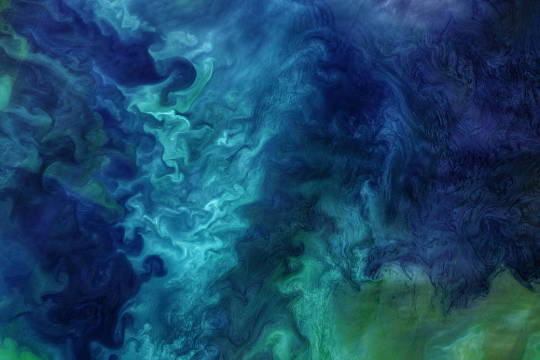
Phytoplankton blooms in the Chukchi Sea, seen by satellite – June 2018
Regardless of the amount of winter ice cover, the waters off of the Alaskan coast usually come alive each spring with blooms of phytoplankton. These blooms can form striking patterns of blue and green seawater, such as those visible in this image of the Chukchi Sea acquired on June 18, 2018, by the Operational Land Imager (OLI) on Landsat 8.
from here
36 notes
·
View notes
Text
'I see your true colours . . ' creating a composite 'true colour' Landsat-8 satellite image of Gebel Asyut el-Gharbi
How to create a colour image from a three greyscale satellite bands.
The various Landsat datasets are a commonly used medium resolution, free, source of satellite imagery, available from the United States Geological Survey’s earthexplorer portal. I’m all in favour of free satellite imagery, but because they are free data, you’ll need to do a little processing before you can use them as a colour base map for your research. In this post, I will explain how Landsat…

View On WordPress
#ArcGIS#archaeology#Asyut#Composite raster#Egypt#Gebel Asyut el-Gharbi#GIS#Landsat-8#Satellite imagery#Satellite remote sensing#True colour
0 notes
Text
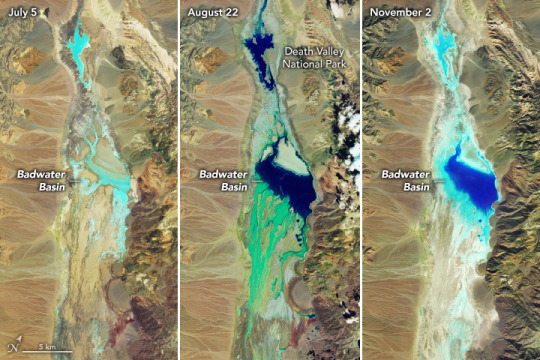
NASA Earth
Badwater Basin in California’s Death Valley National Park is normally a vast and dry salt flat. But record rainfall from Hurricane Hilary—which soaked Southern California in August 2023—created a large temporary lake in the desert basin.
Flash floods from the hurricane damaged roads and other infrastructure, causing the national park to close for nearly two months. When visitors returned in mid-October, they witnessed an infrequent sight in this notoriously hot and dry place: a shallow ephemeral lake stretching for miles in Badwater Basin.
This series of images, acquired with the Landsat 8 and 9 satellites, reveals hydrologic changes in the basin relative to August’s heavy rain. The images are enhanced-color to emphasize the presence of water, which appears in shades of blue. Observers on the ground reported springs flowing, bighorn sheep feeding on new greenery, and even some wildflowers blooming—a rarity outside of springtime.
2 notes
·
View notes
Text
Landslides in São Paulo, Brazil
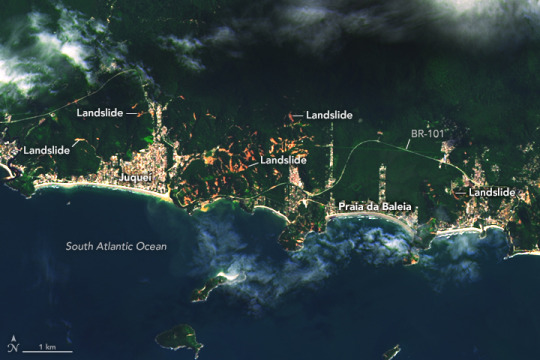
On February 19, 2023, torrential rain pounded São Paulo, a state in southeast Brazil. The water saturated soils and led to deadly flooding and landslides in the region.
The coastal municipality of São Sebastião was among the hardest-hit areas. This image (right), acquired on February 26, 2023, with the Operational Land Imager (OLI) on Landsat 8, shows numerous landslides across the hilly landscape between São Sebastião’s beach communities of Jaqueí and Praia da Baleia. The other image (left), acquired with OLI-2 on Landsat 9, shows a more typical view of the same area several months before the storm.
“Areas with very dense concentrations of landsliding, as seen here, are quite unusual but not unprecedented,” said Robert Emberson, a landslide expert with NASA’s Earth Applied Sciences Disasters program area. He added that landslide events of this extent require extremely intense localized rainfall.
That’s what happened in São Paulo when a storm delivered a huge amount of rain in a short amount of time. According to news reports, parts of the state saw more than 680 millimeters (26 inches) in a single day, exceeding the 24-hour rainfall record in some of the affected areas.
Continue reading.
#brazil#brazilian politics#politics#environmental justice#environmentalism#mod nise da silveira#image description in alt
6 notes
·
View notes
Photo
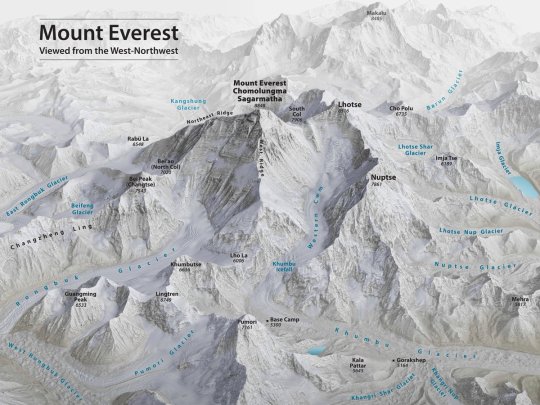
Mount Everest 3D Map by Tom Patterson, with English annotation, based on data from the US National Snow and Ice Data Center and Landsat 8.
by @vintagemapstore
119 notes
·
View notes
Last Seen Blogs