#oakaland
Text


ESTEBAN RAHEEM ABDUL RAHEEM SAMAYOA (RAHRAH) — “LA MESA,” OIL PASTEL ON CANVAS, 34 X 44 INCHES, ©2023.
#ASTÉTICAS#ASTETICAS#ART#ARTS#ARTIST#ARTISTS#OAKALAND#AINT NO DOGS IN HEAVEN#PAINTER#PAINTING#PAINTERS#PAINTINGS#OIL PASTEL#OIL#PAINT#OIL PAINT#LA MESA#ESTEBAN SAMAYOA#RAHEEM ABDUL RAHEEM#RAH RAH
1 note
·
View note
Photo

Did the type treatment for @mockingbirdlanemarket a Halloween market coming this October..if you’re in the Bay Area make sure you give them a follow to know when applications open up 🎃👻. . . . #halloweenmarket #witches #indiemarket #alameda #bayareaevents #darkart #oakaland #spooky #allthingshalloween #bayareamakers (at Oakland, California)
#bayareamakers#alameda#spooky#witches#allthingshalloween#halloweenmarket#oakaland#indiemarket#darkart#bayareaevents
2 notes
·
View notes
Text
Presidential Election 2020 Electoral College Map. (2020 Forecast Map/Prediction Map). Donald Trump vs Joe Biden. October 27, 2020.

My Twitter: https://twitter.com/StatesPoll/status/1321174108176961537
This Map Created with www.Mapchart.net
US Presidential Election 2020:
Donald Trump vs Joe Biden
October 27~, 2020
Trump 285 / Biden 232 / Toss up 21
Posts will continue to be updated.
Latest Polls/Party ID+VBM+In person Statistcs.
Last updated: 8:30 PM EST. October 27. 2020
MI/NC Polls + Oakaland County, Michigan(10/27)
Rating Changes:
AZ: Lean Trump-> Toss up (New AZ Poll)
MN: Toss up -> Lean Biden(Gravis Poll)
* My analysis is neutral, not biased.
Based on 2012/2016/2018 Exit Polls + Voter registration +Trends + Party ID %.
About the details below(Read more)
Based on
1) Midterm Election 2018 Fox New Voter Analysis
https://www.foxnews.com/midterms-2018/voter-analysis
2) Exit Poll 2012/2016/2018
http://www.cnn.com/election/2012/results/race/president/
https://www.cnn.com/election/2016/results/exit-polls
https://edition.cnn.com/election/2018/exit-polls
3) Latest Poll(adjustment)
4) Voter registration statistics + VBM
I. Rust Belt (MI/OH/PA/WI)
1. Michigan.
1) Election 2018 Fox News Voter Analysis
Michigan Senate Race 2018. 3,909 Respondents(Voters)
https://www.foxnews.com/midterms-2018/voter-analysis?filter=MI&type=S
Party ID with leaners: REP 43% / DEM 42% / IND 15%
2) Latest Poll
(1) Ipsos, 10/20-10/26. 652 LV.
https://statespoll.com/post/633174244060200960
Poll results: Biden 53% / Trump 43%
Adjusted %: Biden 47.87% / Trump 47.73%. Biden +0.14%
(2) ABC/WAPO. 10/20-10/25. 789 LV.
https://statespoll.com/post/633218746193002496
Poll results: Biden 51% / Trump 44%
Adjusted %: Trump 50.0%(?) / Biden 47.2%(?). Trump +2.8%(?)
3) Michigan 2020 Forecast
(1) Party ID % 2020 forecast
Based on Voter registration+Fox new voter analysis adjustment+
Early voting(VBM+In person)
With Leaners: REP 49% / DEM 42% / IND 9%
Exlcude Leaners: REP 40% / DEM 33% / IND 27%
VBM+in person 55% / Election Day 45% Model.
Details About My Michigan Party ID % Model(with Leaners)
Read My Analysis Post: https://statespoll.com/post/632689663662063616
TargetSmart Early Voting Model, Oakland County. Michigan. Oct. 7
https://targetearly.targetsmart.com/
DEM 46.7% / REP 41.7%. D+4.0%. considering ED. Trump is likely to flip
Oakland county.
(2) Rate Michigan.
1) Party ID %: Favor REP
2) Current Early Voting: Favor Trump
3) Poll % (adjusted %): Toss up
But I dunno each numbers of Trump’s REP/DEM/IND and Biden’s
REP/DEM/IND, And considering Oakland County Early voting numbers
Conclusion) MI: Tilt Trump
2. Wisconsin
1) Voter Registration Statistics
2) Election 2018 Fox News Voter Analysis
Wisconsin Governor Race 2018. 4,683 Respondents(Voters)
https://www.foxnews.com/midterms-2018/voter-analysis?filter=WI&type=G
(1) Party ID%, Wisconsin with leaner: REP 45% / DEM 43% / IND 13%
3) Latest Poll
(1) Ipsos, 10/20-10/26. 664 LV.
https://statespoll.com/post/633089252265230336
Poll results: Biden 53% / Trump 44%
Adjusted %: Trump 48.92% / Biden 48.5%. Trump +0.42%
(2) Gravis, 10/23. 677 LV.
https://statespoll.com/post/632918928174235648
Poll results: Biden 54% / Trump 43%
Adjusted %: Biden 49.54% / Trump 48% Biden +1.54%
(3) RMG Research, 10/14-10/20. 800 LV.
https://statespoll.com/post/632687368476016640
Poll results: Biden 50% / Trump 44%
Adjusted %: Trump 48.74% / Biden 47.9%. Trump +0.84%
4) Wisconsin 2020 Forecast
(1) Party ID % 2020
Based on Fox new voter analysis adjustment+Trends
Exclude leaners: REP 40% / DEM 32% / IND 28%
with leaners: REP 50% / DEM 42% / IND 8%
VBM+in person 50% / Election Day 50% Model.
Details About My Wisconsin Party ID % Model(with Leaners)
Read My Analysis Post: https://statespoll.com/post/632687368476016640
(2) Rate Wisconsin
1) Party ID %: Favor REP
2) Vote-By-Mail+in person: Favor Trump
according to Wisconsin TargetSmart Early Voting Model
https://targetearly.targetsmart.com
WOW Counties +Racine+Sheboygan+Brown+Winnebago+Outagamie:
Ultra Trending R. 1st time/Infrequent Voters also.
Wisconsin Ealry Voting Analysis October 25. 2020
https://statespoll.com/post/633006764145737728
3) Poll % (adjusted %): Toss up
Conclusion) WI: Toss up
3. Pennsylvania
1) Election 2018 Fox News Voter Analysis
Pennsylvania Senate Race 2018. 3,925 Respondents(Voters)
https://www.foxnews.com/midterms-2018/voter-analysis?filter=PA&type=S
(1) Party ID%, Pennsylvania with leaner, PA Sen 2018
with leaner REP 45% / DEM 44% / IND 11%
2) Pennsylvania Party ID % Statistics
https://www.dos.pa.gov/VotingElections/OtherServicesEvents/VotingElectionStatistics/Documents/currentvotestats.xlsx
(1) October 5, 2020: Total 8,897,739
Dem: 4,168,900 (46.85%) / Rep: 3,451,514 (38.79%). D +8.06%
(2) November 6, 2018: Total 8,609,880
Dem: 4,111,325 (47.75%) / Rep: 3,270,882 (37.99%). D +9.76%
(3) November 8, 2016: Total 8,722,977
Dem: 4,217,456 (48.35%) / Rep: 3,301,182 (37.84%). D +10.51%
3) Latest Poll
(1) Civiqs, 10/23-10/26. 1,145 LV.
https://statespoll.com/post/633134014505598976
Poll results: Biden 52% / Trump 45%
Adjusted %: Trump 50.23% / Biden 47.65%. Trump +2.58%
(2) Trafalgar, 10/24-10/25. 1,076 LV.
https://twitter.com/RobertCahaly/status/1321103067933249536
Poll results: Trump 48.4% / Biden 47.6%. Trump +0.8%
(3) InsiderAdvantage, 10/25. 400 LV.
https://statespoll.com/post/633091095658627072
Poll results: Trump 48.4% / Biden 45.5%
Adjusted %: Trump 49.04% / Biden 44.25%. Trump +4.79%
(4) Ipsos, 10/20-10/26. 655 LV.
https://statespoll.com/post/632453093361090560
Poll results(5way race): Biden 51% / Trump 44%
Adjusted %: Trump 48.2% / Biden 46.9%. Trump +1.3%
4) Pennsylvania 2020 Forecast
(1) Party ID % 2020
Based on Voter registration Trends+Fox new voter analysis adjustment
+ VBM+In person 41% / Election Day 59% Model
with leaner: REP 50% / DEM 42% / IND 8%
exclude Leaner: REP 44% / DEM 40% / IND 16%
Details about my PA model
read my Post: https://statespoll.com/post/632453093361090560
(2) Realistic Race % 2020 forecast
White 81% / Black 10% / Latino 6% / Asian 1% / Other 2%
(3) Rate Pennsylvania.
1) Party ID %: Favor REP
2) Vote-By-Mail: Let’s see
3) Poll % (adjusted %): Tilt~Lean Trump.
Conclusion) PA: Tilt Trump
4. Ohio
1) Election 2018 Fox News Voter Analysis
Ohio Governor Race 2018. 3,819 Respondents(Voters)
https://www.foxnews.com/midterms-2018/voter-analysis?filter=OH&type=G
Party ID with leaner: REP 48% / DEM 41% / IND 12%
2) Latest Poll
3) Ohio 2020 Forecast
Considering White-Evangelical’s turnout might be higher in Ohio
(1) Party ID%
Based on Voter registration+Fox new voter analysis adjustment+Trends
in 2020 it might be something like
exclude leaners: REP 39% / DEM 31% / IND 30%
with leaners: REP 52% / DEM 41% / IND 7%
TargetSmart Model 10/26. 2,201,511+ Casted ballot(40.1% of 2016 Total)
REP 45.9% DEM 41.7% Other 12.5%. and REP might take leads ED
(2) Rate Ohio
Party ID %: Likely REP
Poll % (adjusted %+ cosindered Libertarian&Green):
Early Voting: heavily favor REP
Conclusion: Likely Trump
* 2016 Results: TRUMP(REP) 51.69% / Hillary(DEM) 43.56%. R +8.13%
II. Other Swing States (AZ/FL/GA/IA/NC/NV/TX)
5. Arizona
1) Arizona Party ID % Statistics
Active voters only
(1) August 4, 2020: Total 3,989,214
Rep: 1,389,960(34.84%) Dem 1,293,074(32.41%). R +2.43%
https://azsos.gov/sites/default/files/State_Voter_Reigstration_2020_Primary.pdf
(2) November 6, 2018: Total 3,712,500
Rep: 1,287,831 (34.69%) Dem 1,150,436(30.99%). R +3.7%
https://apps.azsos.gov/election/voterreg/2018-10-01.pdf
(3) October 28, 2016: Total 3,588,466
Rep: 1,239,614(34.54%) Dem 1,091,323(30.41%). R +4.13%
https://apps.azsos.gov/election/voterreg/2016-11-08.pdf
2) Election 2018 Fox News Voter Analysis
Arizona Senate 2018. 3,717 Respondents(Voters)
https://www.foxnews.com/midterms-2018/voter-analysis?filter=AZ&type=S
Despite of White-Evangelical’s Low turnout (Presidential election 2012 Exit Poll 21% vote share, 2018: 13% share. 8% lower than 2012)
Party ID with leaner:
REP 47% Sinema 10% / McSally 89%
DEM 41% Sinema 95% / McSally 4%
IND 12% Sinema 54% / McSally 37%
Trump approval: Approve 49% / Disapprove 51%
3) Latest Poll
(1) OH Predictive Insights, 10/22-10/25. 716 LV.
https://statespoll.com/post/633156779701829632
Poll results: Biden 49% / Trump 46%
Adjusted %: Biden 49.32% / Trump 47.85%. Biden +1.47%
4) Arizona 2020 Forecast
Considering White-Evangelical’s turnout might be higher in preisdential year
(1) Party ID%
2018 AZGov Exit Poll(Exclude Leaners):
https://edition.cnn.com/election/2018/exit-polls/arizona
REP 38% / DEM 31% / IND 31%
With Leaners: REP 49% / DEM 44% / IND 7%
Exclude Leaners: REP 40% / DEM 35% / IND 25%
About the details read my analysis Post:
https://statespoll.com/post/633140302377598976
(2) Rate Arizona
Party ID %:
Vote-By-Mail:
Poll % (adjusted %+ cosindered Libertarian&Green): Tilt Biden
But I dunno Trump really gonna get 88% of Rep in AZ. Let’s see
Conclusion: Toss up
6. Florida
1) Florida Party ID % Statistics
https://dos.myflorida.com/elections/data-statistics/voter-registration-statistics/voter-registration-reportsxlsx/voter-registration-by-party-affiliation/
(1) August 31, 2020: Total 14,065,627
Dem: 5,203,795 (37.0%) / Rep: 5,020,199 (35.69%). D +1.31%
(2) End of 2018: Total 13,396,622
Dem: 4,975,895 (37.14%) / Rep: 4,718,720 (35.22%). D +1.92%
(3) End of 2016: Total 12,959,185
Dem: 4,905,705 (37.86%) / Rep: 4,575,277 (35.31%). D +2.55%
2) Election 2018 Fox News Voter Analysis
Florida Senate Race 2018. 3,717 Respondents(Voters)
https://www.foxnews.com/midterms-2018/voter-analysis?filter=FL&type=S
Party ID with leaner: REP 46% / DEM 42% / IND 14%
3) Latest Poll
(1) FAU, 10/24-10/25. 937 LV.
https://statespoll.com/post/633132642007711744
Poll results: Biden 50% / Trump 48%
Adjusted: Trump 50.96% / Biden 45.07%. Trump +5.89%
(2) Susquehanna(Rep pollster), 10/23-10/25. 400 LV.
https://overland.amgreatness.com/app/uploads/2020/10/Toplines-Florida-CFAG-Oct252020.pdf
Poll results: Trump 49% / Biden 44% / Jorgensen 2%. Trump +5%
(3) Yougov, 10/20-10/23. 1,228 LV.
https://statespoll.com/post/632963089572282369
Poll results: Biden 50% / Trump 48%
Adjusted: Trump 52.6% / Biden 45.3%. Trump +7.3%
4) Florida 2020 Forecast
(1) 2020 Party ID %
Based on Voter registration Trends+Fox new voter analysis adjustment.
+Early Voting(VBM+in person)
2018 FL GOV Exit Poll(Exclude Leaners): REP 38% / DEM 33% /IND 29%
https://edition.cnn.com/election/2018/exit-polls/florida
Exclude leaners: REP 41% / DEM 32% / IND 27%
with leaners: REP 51% / DEM 42% / IND 7%
Details of My FL Party ID model,
Read My Analysis post: https://statespoll.com/post/633155102813847552/
(2) Rate Florida.
Party ID % Trends:(Nov 2016: D +2.5% -> Sept 2020: D +1.3%)
Vote-By-Mail:
Florida VBM+in person mid results (Oct. 13)
https://www.nbcnews.com/politics/2020-elections/florida-results
Mail-in ballots requested: 5,629,666
DEM 45.3% / REP 31.3% / Other 23.4%
Mail-in and early in-person ballots returned: 1,780,584
DEM 50.8% / REP 29.2% / Other 20%
Poll % (adjusted %): Likely Trump
Conclusion: Lean~Likely Trump
7. Nevada
1) Nevada Party ID % Statistics(Active Registered Voters)
https://www.nvsos.gov/sos/elections/voters/voter-registration-statistics
(1) Oct 1, 2020: Total 1,742,477
https://www.nvsos.gov/sos/home/showdocument?id=8998
Dem 654,724 (37.57%) Rep 566,265(32.5%) D+5.07%
(2) Jan 3, 2019: Total 1.582 Million
Dem 607.4k(38.39%) Rep 528.7k(33.42%) D+4.97%
(3) Oct 21, 2016: Total 1,464,819
https://www.nvsos.gov/sos/home/showdocument?id=4518
Dem 577,679(39.44%) Rep 488,861(33.37%) D+6.07%
2) Election 2018 Fox News Voter Analysis
Nevada Senate Race 2018. 3,400 Respondents(Voters)
https://www.foxnews.com/midterms-2018/voter-analysis?filter=NV&type=S
Party ID with leaners: DEM 44% / REP 42% / IND 14%s
3) Latest Poll
(1) NYT/Siena 10/23-10/26, 809 LV.
https://statespoll.com/post/633152355607707648
Poll results: Biden 49% / Trump 43% / Jorgensen 3%
Adjusted %: Biden 49.1% / Trump 47.1% / Jorgensen 1.6%. Biden +2.0%
4) Nevada 2020 Forecast
(1) 2020 Party ID %
Based on Voter registration Trends+Fox new voter analysis adjustment.
exclude leaners: DEM 33% / REP 29% / IND 38%
with leaners: REP 47.5% / DEM 43% / IND 9.5%
(2) Rate Nevada
1) Party ID %:
2) Poll %: Tilt~Lean Biden
3) Vote-By-Mail+in person:
My Analysis Post(Nevada Early Voting):
https://statespoll.com/post/633151892259831808
Conclusion: Tilt Biden
8. Minnesota
1) Election 2018 Fox News Voter Analysis
Minnesota Special Senate Race 2018. 4,201 Respondents(Voters)
https://www.foxnews.com/midterms-2018/voter-analysis?filter=MN&type=S2
(1) Party ID%, Minnesota with leaner, MN Special Sen 2018
with leaners: DEM 46% / REP 40% / IND 14%
2) Latest Poll
(1) Gravis, 10/24-10/26. 657 LV.
https://statespoll.com/post/633157198621622272
Poll results : Biden 53% / Trump 39%
Adjusted %: Biden 50.13% / Trump 42.15%. Biden +7.98%
3) Minnesota 2020 Forecast
(1) Party ID %
Voter registration+Fox new voter analysis adjustment+Trends
With Leaner: REP 45% / DEM 44% / IND 11%
Exclude Leaner: REP 38% / DEM 35% / IND 27%
Detials: https://statespoll.com/post/632594716317384704
(2) Rate Minnesota
3) Vote-By-Mail+in person:
=> Oct 24: DEM 47.4% / REP 29.9% / IND + Other 22.7%
=> Oct 27: DEM 47.4% / REP 30.0% / IND + Other 22.6%
Poll %: Likely Dem
Conclusion: Lean Dem
9. North Carolina
1) Party Statistics Trends %
2016 Results: TRUMP 49.83% / Hillary 46.17%
Party registration statistics Trends.
2016->2020 Dem’s margins reduced -3.82%
(1) October 10, 2020: Total 7,242,242
https://vt.ncsbe.gov/RegStat/Results/?date=10%2F10%2F2020
Dem 2,585,688 (35.70%) / Rep 2,185,854 (30.18%). D +5.52%
(2) November, 8th 2016: Total 6,918,150
https://vt.ncsbe.gov/RegStat/Results/?date=11%2F08%2F2016
Dem 2,733,188(39.51%) / Rep 2,086,942(30.17%). D +9.34%
2) Latest Poll
(1) SurveyUSA, 10/23-10/26. 627 LV.
https://statespoll.com/post/632543897604751360
Poll results : Trump 48% / Biden 48%
Adjusted %: Trump 52.6% / Biden 44.7%. Trump +7.9%
(2) Ipsos, 10/20-10/26. 647 LV.
https://statespoll.com/post/633176589443710976
Poll results : Biden 49% / Trump 48%
Adjusted %: Trump 50.78% / Biden 46.79%. Trump +3.99%
(3) Yougov, 10/20-10/23. 1,022 LV
https://statespoll.com/post/632816505386647552
Poll results : Biden 51% / Trump 47%
Adjusted %: Trump 50.98% / Biden 46.95%. Trump +4.03%
3) North Carolina Forecast
(1) Party ID
Based on Voter registration Trends
VBM+In person(60%) DEM 55.5% / REP 38.5% / IND 6%
EDay(40%) REP 65% DEM 25% IND 10%
My Model(With leaners): REP 51% / DEM 42% / IND7%
exclude leaners: REP 35% / DEM 30% / IND 35%
Details of My NC Party ID Model.(with leaners)
Read my post: https://statespoll.com/post/632543897604751360
(2) Rate NC
Poll % (adjusted %+ cosindered Libertarian&Green): Lean Trump
Party ID % Trends: Favor REP(Nov 2016: D +9.3% -> Oct 2020: D +5.5%)
Current Early voting REP is narrowing gap radically
VBM: favor REP
Conclusion: Lean Trump
10. Georgia
1) Election 2018 Fox News Voter Analysis
Georgia Governor Race 2018. 3,955 Respondents(Voters)
https://www.foxnews.com/midterms-2018/voter-analysis?filter=GA&type=G
Party ID with leaner: REP 48% DEM 41% IND 11%
2) Latest Poll
(1) Civiqs 10/23-10/26, 1,041 LV.
https://statespoll.com/post/633133585426251776
Poll results: Biden 51% / Trump 46%
Adjusted: Trump 51.7% / Biden 46.3%. Tump +5.4%
(2) Yougov 10/20-10/23, 1,090 LV.
https://statespoll.com/post/632961884585426944
Poll results: Trump 48% / Biden 48%
Adjusted: Trump 53.7% / Biden 44.1%. Trump +9.6%
(3) AJC 10/14-10/23, 1,145 LV.
https://statespoll.com/post/633036015536406528
Poll results: Biden 46.5% / Trump 46.2%
Adjusted: Trump 50.85% / Biden 43.4%. Trump +6.45%
(4) Landmark 10/21, 500 LV.
Poll results: Trump 50% / Biden 46%
Notable results: 72% GA White voters are favoring Trump.
3) Georgia 2020 Forecast
Considering White-Evangelical’s turnout might be higher in preisdential year.
(1) Party ID %
Based on foxnews voter analysis adjustment.
exclude leaners: REP 41% / DEM 32% / IND 27%
with leaners: REP 52% / DEM 41% / IND 7%
(2) Rate Georgia
Party ID %: Likely REP
Early Voting: Huge Favor GOP
Poll % (adjusted %+ cosindered Libertarian&Green): Likely Trump
Conclusion: Likely Trump
11. Iowa
1) Election 2018 Fox News Voter Analysis
Iowa Governor Race 2018. 3,955 Respondents(Voters)
https://www.foxnews.com/midterms-2018/voter-analysis?filter=GA&type=G
Despite of White-Evangelical’s Low turnout (Presidential election 2016 Exit Poll 34% vote share, 2018: 23% share. 11% lower than 2016)
Final results: Kim Reynolds(Rep) 50.3% / Fred Hubbell(Dem) 47.5%
Party ID with leaner:
REP 47% Hubbell 11% Reynolds 87%
DEM 36% Hubbell 94% Reynolds 5%
IND 17%
1) Iowa Party ID % Statistics(Active Registered Voters)
https://sos.iowa.gov/elections/voterreg/county.html
(1) September 1, 2020: Total 2,027,777
https://sos.iowa.gov/elections/pdf/VRStatsArchive/2020/CoSept20.pdf
Dem 684,093 (33.73%) Rep 691,239 (34.09%) R +0.36%
(2) November 1, 2016: Total 1,996,153
https://sos.iowa.gov/elections/pdf/VRStatsArchive/2016/CoNov16.pdf
Dem 629,081 (31.51%) Rep 662,167(33.17%) R +1.66%
2) Latest Poll
(1) Emerson, 10/19-10/21. 435 LV.
https://statespoll.com/post/632849562979188736
Poll Results: Trump 48% / Biden 48% (Push undecided)
Adjusted: Trump 51.6% / Biden 44.2%. Trump +7.4%
(2) InsiderAdvantage, 10/18-10/19. 400 LV.
https://statespoll.com/post/632551635927941120
Poll Results: Biden 45.1% / Trump 44.6%
Adjusted: Trump 52.7% / Biden 42.7%. Trump +10%
3) Iowa 2020 Forecast
Considering White-Evangelical’s turnout might be higher in preisdential year.
(1) Party ID
Based on Voter registration Trends+Fox new voter analysis adjustment.
exclude leaners: REP 40% / DEM 30% / IND 30%
with leaners: REP 53% / DEM 36% / IND 11%
(2) Rate Iowa
Party ID %: Likely REP
Poll % (adjusted %+ cosindered Libertarian&Green): Likely Trump
Conclusion: Likely Trump
* 2016 Results: TRUMP(REP) 51.15 / Hillary(DEM) 41.74% R +9.41%
12. Texas
1) Election 2018 Fox News Voter Analysis
Texas Senate Race 2018. 3,747 Respondents(Voters)
https://www.foxnews.com/midterms-2018/voter-analysis?filter=TX&type=S
REP 49% / dem 41% / IND 10%. Final Results: Cruz 50.9% / Beto 48.3%
Current Early Voting numbers.
TargetSmart Model :
10/21/2020 REP 50.3% / DEM 40.9% / IND 8.8%
10/25/2020 REP 51.9% / DEM 38.9% / IND 9.2%
Considering ED might be : REP 52%+ / DEM 39% or less / IND 9%
(2018: R +8% -> 2020: Might be R +13% or more. )
2) Latest Poll
(1) Yougov, 10/13-10/20. 1,000 LV.
https://statespoll.com/post/633051947607490561
Poll Results: Trump 50.0% / Biden 44.7%
Adjusted: Trump 54.1% / Biden 43.87%. Trump +10.23%
III. NH/ME(Semi Blue States ME2/NE2: Swing district)
13. Maine
Maine Governor Race 2018. 2,734 Respondents(Voters)
https://www.foxnews.com/midterms-2018/voter-analysis?filter=ME&type=G
Party ID%(With Leaners): DEM 41% / REP 41% / IND 18%
ME Party ID % Statistics(Active Registered Voters)
https://www.maine.gov/sos/cec/elec/data/index.html
1) ME Party ID % Statistics(Active Registered Voters)
https://www.maine.gov/sos/cec/elec/data/index.html
(1) 7/14/2020: Total 1,063,383
https://www.maine.gov/sos/cec/elec/data/data-pdf/r-e-active.pdf
DEM 386,786(36.4%) / REP 295,122(27.8%). D +8.6%
(2) 11/6/2018: Total 1,054,952
https://www.maine.gov/sos/cec/elec/data/data-pdf/r-e-active1118.pdf
DEM 348,657(33.05%) / REP 287,955(27.3%). D +5.75%
(3) 11/8/2016: Total 1,058,444
https://www.maine.gov/sos/cec/elec/data/r-e-active-11-8-16.pdf
DEM 338,352(32.0%) / REP 285,320(27.0%). D +5.0%
2) Maine 2020 Forecast
ME-2: Lean Trump
My Post(ME-2): https://statespoll.com/post/632560185693618176
ME-1: Solid Biden. ME(Statewide): Nearly Solid Biden.
14. NE-2 District
Current Early Voting TargetSmart Model:
10/27 DEM 48.7% / REP 45.3% / IND 6.0%
*FYI 2016 EV(58,667 Votes): DEM 52.5% / REP 42.0% / IND 5.6%
I guess in the end, with Election Day: REP 51% / DEM 42% / IND 7%
Conclusion: Tilt~Lean Trump
1 note
·
View note
Text

Oakland, I'm home!#oakaland #landscape #life
1 note
·
View note
Video
No Wahala Wednesday, tonight in Oakland at Liege! Party with @unitedtribesof_africa the Diaspora 👑 #nowahalawednesdays #liege #oakaland (at Lola's African Apparel)
0 notes
Photo

Derras de barras se distribuye en Estados Unidos #bayarea #oakaland #sanfrancisco #califaz #reporteilegalUSA #wilsonposada @reporteilegal @shobiz1218 #DetrasDeBarras #spia104 #represent #mycrew #bigprops @dermafilia_tattoo #undergroundsound #hiphopmexicano #familia
#sanfrancisco#spia104#oakaland#reporteilegalusa#detrasdebarras#wilsonposada#represent#mycrew#bigprops#familia#undergroundsound#hiphopmexicano#bayarea#califaz
0 notes
Photo

Hello dancing friends! I'm stoked to be part of this local sound collective of talented DJs, and we've put together a fun party happening this Friday, Sept 15th in East Oakland. The intention is to turn this into a regularly monthly party so your presence and support is greatly appreciated! Very affordable cover at the door but let me if u wanna DM I can out u on da list 💌😎🙌 #danceparty #oakaland #eastbay #localDJs #acidhouse #deephouse #techhouse #electronic #dancemusic #housemusic #housemusiclovers #dancevibes #goodvibes #eastoakland
#deephouse#techhouse#dancemusic#danceparty#goodvibes#oakaland#housemusic#housemusiclovers#acidhouse#dancevibes#eastbay#eastoakland#localdjs#electronic
0 notes
Photo

LETTTTSSSSSS GOOOOOOO!!!!! 🖌: @tysonbeck #nbachamps #warriors #gsw #bayarea #sanfrancisco #oakaland
0 notes
Video
Who wants to see @blegit72 on #NOVULTURES tag him and let him know! #brodeezytaughtme #Blegit #Thesavage #originalsavage #sickwitit #vallejo #oakaland #eastoakland #bayarea #realhiphop #hiphoplegend #slap #boy #wakeshitup # #media #podcast #connectedandrespected #slapsondeck #journalism #legend #livinglegend #theclick #e40 #ombpeezy #nephthepharoah #dshot #sugat #cellycell
#nephthepharoah#brodeezytaughtme#journalism#podcast#sickwitit#cellycell#dshot#realhiphop#connectedandrespected#livinglegend#hiphoplegend#slap#novultures#vallejo#slapsondeck#eastoakland#thesavage#media#e40#theclick#bayarea#blegit#wakeshitup#originalsavage#ombpeezy#legend#sugat#oakaland#boy
1 note
·
View note
Photo

Bus stop in Downtown Oakland, California.
33 notes
·
View notes
Text
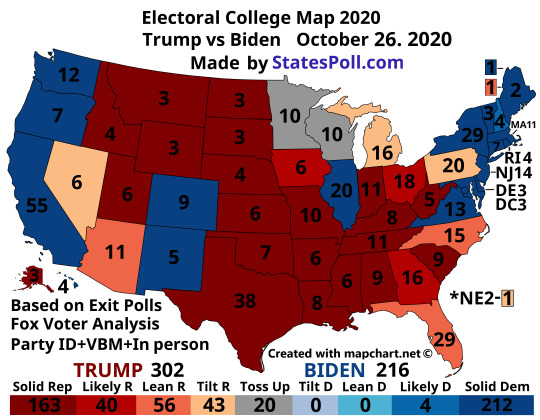
Presidential Election 2020 Electoral College Map. (2020 Forecast Map/Prediction Map). Donald Trump vs Joe Biden. October 26, 2020.
My Twitter: https://twitter.com/StatesPoll/status/1320912406466408448
This Map Created with www.Mapchart.net
US Presidential Election 2020:
Donald Trump vs Joe Biden
October 26~, 2020
Trump 302 / Biden 216 / Toss up 20
Posts will continue to be updated.
Latest Polls/Party ID+VBM+In person Statistcs.
Last updated: 9 AM EST. October 27. 2020
FL/GA/PA Polls + Oakaland County, Michigan(10/27)
Rating Changes:
WI: Tilt Trump->Toss up, PA: Toss up-> Tilt Trump
* My analysis is neutral, not biased.
Based on 2012/2016/2018 Exit Polls + Voter registration +Trends + Party ID %.
About the details below(Read more)
Based on
1) Midterm Election 2018 Fox New Voter Analysis
https://www.foxnews.com/midterms-2018/voter-analysis
2) Exit Poll 2012/2016/2018
http://www.cnn.com/election/2012/results/race/president/
https://www.cnn.com/election/2016/results/exit-polls
https://edition.cnn.com/election/2018/exit-polls
3) Latest Poll(adjustment)
4) Voter registration statistics + VBM
I. Rust Belt (MI/OH/PA/WI)
1. Michigan.
1) Election 2018 Fox News Voter Analysis
Michigan Senate Race 2018. 3,909 Respondents(Voters)
https://www.foxnews.com/midterms-2018/voter-analysis?filter=MI&type=S
Party ID with leaners: REP 43% / DEM 42% / IND 15%
2) Latest Poll
(1) Gravis, 10/24. 679 LV.
https://statespoll.com/post/632961349208719360
Poll results: Biden 55% / Trump 42%
Adjusted %: Trump 48.44% / Biden 48.26%. Trump +0.18%
(2) PPP(Dem Pollster), 10/21-10/22. 804 LV.
https://statespoll.com/post/632689663662063616
Poll results: Biden 50% / Trump 43%
Notable Results, MISen, Among Black voters: Peter 70% / James 19%
Adjusted %: Trump 47.5% / Biden 45.6%. Trump +1.9%
(3) Trafalgar, 10/15-10/18. 1,034 LV.
https://d3n8a8pro7vhmx.cloudfront.net/restoration/pages/1001/attachments/original/1603307463/RSTP_MI_'20_Oct_Press_Report.pdf
Poll results: Trump 46.7% / Biden 44.9%. Trump +1.8%
3) Michigan 2020 Forecast
(1) Party ID % 2020 forecast
Based on Voter registration+Fox new voter analysis adjustment+
Early voting(VBM+In person)
With Leaners: REP 49% / DEM 42% / IND 9%
Exlcude Leaners: REP 40% / DEM 33% / IND 27%
VBM+in person 55% / Election Day 45% Model.
Details About My Michigan Party ID % Model(with Leaners)
Read My Analysis Post: https://statespoll.com/post/632689663662063616
TargetSmart Early Voting Model, Oakland County. Michigan. Oct. 7
https://targetearly.targetsmart.com/
DEM 46.7% / REP 41.7%. D+4.0%. considering ED. Trump is likely to flip
Oakland county.
(2) Rate Michigan.
1) Party ID %: Favor REP
2) Current Early Voting: Favor Trump
3) Poll % (adjusted %): Lean Trump
Conclusion) MI: Tilt~Lean Trump
2. Wisconsin
1) Voter Registration Statistics
2) Election 2018 Fox News Voter Analysis
Wisconsin Governor Race 2018. 4,683 Respondents(Voters)
https://www.foxnews.com/midterms-2018/voter-analysis?filter=WI&type=G
(1) Party ID%, Wisconsin with leaner: REP 45% / DEM 43% / IND 13%
3) Latest Poll
(1) Ipsos, 10/20-10/26. 664 LV.
https://statespoll.com/post/633089252265230336
Poll results: Biden 53% / Trump 44%
Adjusted %: Trump 48.92% / Biden 48.5%. Trump +0.42%
(2) Gravis, 10/23. 677 LV.
https://statespoll.com/post/632918928174235648
Poll results: Biden 54% / Trump 43%
Adjusted %: Biden 49.54% / Trump 48% Biden +1.54%
(3) RMG Research, 10/14-10/20. 800 LV.
https://statespoll.com/post/632687368476016640
Poll results: Biden 50% / Trump 44%
Adjusted %: Trump 48.74% / Biden 47.9%. Trump +0.84%
4) Wisconsin 2020 Forecast
(1) Party ID % 2020
Based on Fox new voter analysis adjustment+Trends
Exclude leaners: REP 40% / DEM 32% / IND 28%
with leaners: REP 50% / DEM 42% / IND 8%
VBM+in person 50% / Election Day 50% Model.
Details About My Wisconsin Party ID % Model(with Leaners)
Read My Analysis Post: https://statespoll.com/post/632687368476016640
(2) Rate Wisconsin
1) Party ID %: Favor REP
2) Vote-By-Mail+in person: Favor Trump
according to Wisconsin TargetSmart Early Voting Model
https://targetearly.targetsmart.com
WOW Counties +Racine+Sheboygan+Brown+Winnebago+Outagamie:
Ultra Trending R. 1st time/Infrequent Voters also.
Wisconsin Ealry Voting Analysis October 25. 2020
https://statespoll.com/post/633006764145737728
3) Poll % (adjusted %): Toss up
Conclusion) WI: Toss up
3. Pennsylvania
1) Election 2018 Fox News Voter Analysis
Pennsylvania Senate Race 2018. 3,925 Respondents(Voters)
https://www.foxnews.com/midterms-2018/voter-analysis?filter=PA&type=S
(1) Party ID%, Pennsylvania with leaner, PA Sen 2018
with leaner REP 45% / DEM 44% / IND 11%
2) Pennsylvania Party ID % Statistics
https://www.dos.pa.gov/VotingElections/OtherServicesEvents/VotingElectionStatistics/Documents/currentvotestats.xlsx
(1) October 5, 2020: Total 8,897,739
Dem: 4,168,900 (46.85%) / Rep: 3,451,514 (38.79%). D +8.06%
(2) November 6, 2018: Total 8,609,880
Dem: 4,111,325 (47.75%) / Rep: 3,270,882 (37.99%). D +9.76%
(3) November 8, 2016: Total 8,722,977
Dem: 4,217,456 (48.35%) / Rep: 3,301,182 (37.84%). D +10.51%
3) Latest Poll
(1) Civiqs, 10/23-10/26. 1,145 LV.
https://statespoll.com/post/633134014505598976
Poll results: Biden 52% / Trump 45%
Adjusted %: Trump 50.23% / Biden 47.65%. Trump +2.58%
(2) Trafalgar, 10/24-10/25. 1,076 LV.
https://twitter.com/RobertCahaly/status/1321103067933249536
Poll results: Trump 48.4% / Biden 47.6%. Trump +0.8%
(3) InsiderAdvantage, 10/25. 400 LV.
https://statespoll.com/post/633091095658627072
Poll results: Trump 48.4% / Biden 45.5%
Adjusted %: Trump 49.04% / Biden 44.25%. Trump +4.79%
(4) Ipsos, 10/20-10/26. 655 LV.
https://statespoll.com/post/632453093361090560
Poll results(5way race): Biden 51% / Trump 44%
Adjusted %: Trump 48.2% / Biden 46.9%. Trump +1.3%
4) Pennsylvania 2020 Forecast
(1) Party ID % 2020
Based on Voter registration Trends+Fox new voter analysis adjustment
+ VBM+In person 41% / Election Day 59% Model
with leaner: REP 50% / DEM 42% / IND 8%
exclude Leaner: REP 44% / DEM 40% / IND 16%
Details about my PA model
read my Post: https://statespoll.com/post/632453093361090560
(2) Realistic Race % 2020 forecast
White 81% / Black 10% / Latino 6% / Asian 1% / Other 2%
(3) Rate Pennsylvania.
1) Party ID %: Favor REP
2) Vote-By-Mail: Let’s see
3) Poll % (adjusted %): Tilt~Lean Trump.
Conclusion) PA: Tilt Trump
4. Ohio
1) Election 2018 Fox News Voter Analysis
Ohio Governor Race 2018. 3,819 Respondents(Voters)
https://www.foxnews.com/midterms-2018/voter-analysis?filter=OH&type=G
Party ID with leaner: REP 48% / DEM 41% / IND 12%
2) Latest Poll
3) Ohio 2020 Forecast
Considering White-Evangelical’s turnout might be higher in Ohio
(1) Party ID%
Based on Voter registration+Fox new voter analysis adjustment+Trends
in 2020 it might be something like
exclude leaners: REP 39% / DEM 31% / IND 30%
with leaners: REP 52% / DEM 41% / IND 7%
TargetSmart Model 10/26. 2,201,511+ Casted ballot(40.1% of 2016 Total)
REP 45.9% DEM 41.7% Other 12.5%. and REP might take leads ED
(2) Rate Ohio
Party ID %: Likely REP
Poll % (adjusted %+ cosindered Libertarian&Green):
Early Voting: heavily favor REP
Conclusion: Likely Trump
* 2016 Results: TRUMP(REP) 51.69% / Hillary(DEM) 43.56%. R +8.13%
II. Other Swing States (AZ/FL/GA/IA/NC/NV/TX)
5. Arizona
1) Arizona Party ID % Statistics
Arizona Voter Registration %
10/28/2016: REP +148,291
10/20/2020: REP +113,896
https://twitter.com/mantlehog/status/1318572169748676608
According to Twitter user Billy Newby
-----------
https://twitter.com/mantlehog/status/1318575045141254144
---------
https://azsos.gov/elections/voter-registration-historical-election-data
Active voters only
(1) August 4, 2020: Total 3,989,214
Rep: 1,389,960(34.84%) Dem 1,293,074(32.41%). R +2.43%
https://azsos.gov/sites/default/files/State_Voter_Reigstration_2020_Primary.pdf
(2) November 6, 2018: Total 3,712,500
Rep: 1,287,831 (34.69%) Dem 1,150,436(30.99%). R +3.7%
https://apps.azsos.gov/election/voterreg/2018-10-01.pdf
(3) October 28, 2016: Total 3,588,466
Rep: 1,239,614(34.54%) Dem 1,091,323(30.41%). R +4.13%
https://apps.azsos.gov/election/voterreg/2016-11-08.pdf
2) Election 2018 Fox News Voter Analysis
Arizona Senate 2018. 3,717 Respondents(Voters)
https://www.foxnews.com/midterms-2018/voter-analysis?filter=AZ&type=S
Despite of White-Evangelical’s Low turnout (Presidential election 2012 Exit Poll 21% vote share, 2018: 13% share. 8% lower than 2012)
Party ID with leaner:
REP 47% Sinema 10% / McSally 89%
DEM 41% Sinema 95% / McSally 4%
IND 12% Sinema 54% / McSally 37%
Trump approval: Approve 49% / Disapprove 51%
3) Latest Poll
(1) Susquehanna Polling & Research Inc. 10/19-10/22. 500 LV.
https://overland.amgreatness.com/app/uploads/2020/10/Toplines-ArizonaStatewide-CFAG-Oct2020.pdf
Poll results: Trump 47% / Biden 46%. Trump +1%
(2) Ipsos 10/14-10/21. 658 LV.
https://statespoll.com/post/632656270366785536
Poll results: Biden 50% / Trump 46%
Adjusted %: Trump 50.8% / Biden 45.9%. Trump +4.9%
4) Arizona 2020 Forecast
Considering White-Evangelical’s turnout might be higher in preisdential year
(1) Party ID%
2018 AZGov Exit Poll(Exclude Leaners):
https://edition.cnn.com/election/2018/exit-polls/arizona
REP 38% / DEM 31% / IND 31%
With Leaners: REP 51% / DEM 42% / IND 7%
Exclude Leaners: REP 40% / DEM 32% / IND 28%
About the details read my analysis Post:
https://statespoll.com/post/632547841755217920
(2) Rate Arizona
Party ID %:
Vote-By-Mail: Current EV in AZ. Trending R(Including Maricopa county)
Favor Trump
Poll % (adjusted %+ cosindered Libertarian&Green): Lean Trump
Voter registration: Considering Turnout(77%ish) Dem narrowed gaps
about 0.3%ish, 2016 was Trump +3.5%.
Trump's 2016 margins 3.5-0.3%= 3.2%
So Arizona Voter registration number is still favor Trump.
Conclusion: Lean Trump
6. Florida
1) Florida Party ID % Statistics
https://dos.myflorida.com/elections/data-statistics/voter-registration-statistics/voter-registration-reportsxlsx/voter-registration-by-party-affiliation/
(1) August 31, 2020: Total 14,065,627
Dem: 5,203,795 (37.0%) / Rep: 5,020,199 (35.69%). D +1.31%
(2) End of 2018: Total 13,396,622
Dem: 4,975,895 (37.14%) / Rep: 4,718,720 (35.22%). D +1.92%
(3) End of 2016: Total 12,959,185
Dem: 4,905,705 (37.86%) / Rep: 4,575,277 (35.31%). D +2.55%
2) Election 2018 Fox News Voter Analysis
Florida Senate Race 2018. 3,717 Respondents(Voters)
https://www.foxnews.com/midterms-2018/voter-analysis?filter=FL&type=S
Party ID with leaner: REP 46% / DEM 42% / IND 14%
3) Latest Poll
(1) FAU, 10/24-10/25. 937 LV.
https://statespoll.com/post/633132642007711744
Poll results: Biden 50% / Trump 48%
Adjusted: Trump 50.96% / Biden 45.07%. Trump +5.89%
(2) Yougov, 10/20-10/23. 1,228 LV.
https://statespoll.com/post/632963089572282369
Poll results: Biden 50% / Trump 48%
Adjusted: Trump 52.6% / Biden 45.3%. Trump +7.3%
(3) Rasmussen, 10/20-10/21. 800 LV
https://www.rasmussenreports.com/public_content/politics/elections/election_2020/florida_trump_49_biden_46
Poll results: Trump 50% / Biden 46%. Trump +4.0%
(4) St. Pete Polls, 10/21-10/22. 2,527 LV.
https://statespoll.com/post/632773010577866752
Poll results: Biden 48.9% / Trump 47.4%
Notable results, Among Hispanic: Biden 49.9% / Trump 47.3%.
Biden +2.6% (2016 FL Exit Poll, Hispanic: Hillary 62% / Trump 35%.)
Adjusted %: Trump 49.1% / Biden 47.2%. Trump +1.9%
4) Florida 2020 Forecast
(1) 2020 Party ID %
Based on Voter registration Trends+Fox new voter analysis adjustment.
+Early Voting(VBM+in person)
2018 FL GOV Exit Poll(Exclude Leaners): REP 38% / DEM 33% /IND 29%
https://edition.cnn.com/election/2018/exit-polls/florida
Exclude leaners: REP 42% / DEM 32% / IND 26%
with leaners: REP 53% / DEM 40% / IND 7%
Details of My FL Party ID model,
Read My Analysis post: https://statespoll.com/post/632594327193993216
(2) Rate Florida.
Party ID % Trends:(Nov 2016: D +2.5% -> Sept 2020: D +1.3%)
Vote-By-Mail:
Florida VBM+in person mid results (Oct. 13)
https://www.nbcnews.com/politics/2020-elections/florida-results
Mail-in ballots requested: 5,629,666
DEM 45.3% / REP 31.3% / Other 23.4%
Mail-in and early in-person ballots returned: 1,780,584
DEM 50.8% / REP 29.2% / Other 20%
Poll % (adjusted %): Likely Trump
Conclusion: Lean~Likely Trump
* 2016 Results: TRUMP(REP) 49.02% / Hillary(DEM) 47.82%. R +1.2%
7. Nevada
1) Nevada Party ID % Statistics(Active Registered Voters)
https://www.nvsos.gov/sos/elections/voters/voter-registration-statistics
(1) Oct 1, 2020: Total 1,742,477
https://www.nvsos.gov/sos/home/showdocument?id=8998
Dem 654,724 (37.57%) Rep 566,265(32.5%) D+5.07%
(2) Jan 3, 2019: Total 1.582 Million
Dem 607.4k(38.39%) Rep 528.7k(33.42%) D+4.97%
(3) Oct 21, 2016: Total 1,464,819
https://www.nvsos.gov/sos/home/showdocument?id=4518
Dem 577,679(39.44%) Rep 488,861(33.37%) D+6.07%
2) Election 2018 Fox News Voter Analysis
Nevada Senate Race 2018. 3,400 Respondents(Voters)
https://www.foxnews.com/midterms-2018/voter-analysis?filter=NV&type=S
Party ID with leaners: DEM 44% / REP 42% / IND 14%s
3) Latest Poll
(1) Civiqs, 10/17-10/20. 712 LV.
https://statespoll.com/post/632594187760664576
Poll results: Biden 52% / Trump 43%
Adjusted %: Trump 49.175% / Biden 48.875%. Trump +0.3%
4) Nevada 2020 Forecast
(1) 2020 Party ID %
Based on Voter registration Trends+Fox new voter analysis adjustment.
exclude leaners: DEM 33% / REP 29% / IND 38%
with leaners: REP 47.5% / DEM 43% / IND 9.5%
(2) Rate Nevada
1) Party ID %:
2) Poll %: Toss up
3) Vote-By-Mail+in person:
Nevada VBM. Oct. 14 Returned: 51,847
DEM 53.2% / REP 24.4% / Other 21.7%
=> Oct. 21: DEM 50.2% / REP 41.7% IND 8.1%
=> Oct. 24: DEM 47.3% / REP 44.6% / IND 8.1%
My Analysis Post(Nevada Early Voting):
https://statespoll.com/post/632915230244175872
NV Early voting is radically Trending R.
Conclusion: Tilt Trump
* 2016 Results: Hillary(DEM) 47.92% / TRUMP(REP) 45.5% / D+2.42%
8. Minnesota
1) Election 2018 Fox News Voter Analysis
Minnesota Special Senate Race 2018. 4,201 Respondents(Voters)
https://www.foxnews.com/midterms-2018/voter-analysis?filter=MN&type=S2
(1) Party ID%, Minnesota with leaner, MN Special Sen 2018
with leaners: DEM 46% / REP 40% / IND 14%
2) Latest Poll
(1) Civiqs, 10/17-10/20. 840 LV.
https://statespoll.com/post/632594716317384704
Poll results : Biden 53% / Trump 43%
Adjusted %: Biden 48.96% / Trump 48.64%. Biden +0.32%
(2) Minnesota: KSTP/SurveyUSA 10/16-10/20. 625 LV Smith vs Lewis
https://kstp.com/politics/kstpsurveyusa-smith-lewis-senate-race-now-a-dead-heat-october-21-2020/5901843/?cat=1
Smith 43% / Lewis 42%. Smith +1%
3) Minnesota 2020 Forecast
(1) Party ID %
Voter registration+Fox new voter analysis adjustment+Trends
With Leaner: REP 45% / DEM 44% / IND 11%
Exclude Leaner: REP 38% / DEM 35% / IND 27%
Detials: https://statespoll.com/post/632594716317384704
(2) Rate Minnesota
Poll: Tilt DEM~Lean DEM
3) Vote-By-Mail+in person:
https://targetearly.targetsmart.com/
Last updated Oct. 20
Mail-in and early in-person ballots returned: 936,493
DEM 48.5% / REP 28.9% / IND+OTHER 22.6%
=> OCT 21: DEM 48.0% / REP 29.3% / IND+Other
=> Oct 24: DEM 47.4% / REP 29.9% / IND + Other 22.7%
Poll %: Toss up
Minnesota early voting analysis post:
https://statespoll.com/post/632227687289765888
Conclusion: Toss up
9. North Carolina
1) Party Statistics Trends %
2016 Results: TRUMP 49.83% / Hillary 46.17%
Party registration statistics Trends.
2016->2020 Dem’s margins reduced -3.82%
(1) October 10, 2020: Total 7,242,242
https://vt.ncsbe.gov/RegStat/Results/?date=10%2F10%2F2020
Dem 2,585,688 (35.70%) / Rep 2,185,854 (30.18%). D +5.52%
(2) November, 8th 2016: Total 6,918,150
https://vt.ncsbe.gov/RegStat/Results/?date=11%2F08%2F2016
Dem 2,733,188(39.51%) / Rep 2,086,942(30.17%). D +9.34%
2) Latest Poll
(1) Yougov, 10/20-10/23. 1,022 LV
https://statespoll.com/post/632816505386647552
Poll results : Biden 51% / Trump 47%
Adjusted %: Trump 50.98% / Biden 46.95%. Trump +4.03%
(2) Trafalgar, 10/20-10/22. 1,098 LV
https://drive.google.com/file/d/1F50GhQFuthpATgxIiDqADXjmgk_iNFBm/view
Poll results : Trump 48.8% / Biden 46.0%. Trump +2.8%
(3) Ipsos, 10/14-10/20. 660 LV.
https://statespoll.com/post/632543897604751360
Poll results : Biden 49% / Trump 46%
Adjusted %: Trump 49.8% / Biden 46.8%. Trump +3.0%
(4) Data for Progress, 10/15-10/18. 929 LV.
https://statespoll.com/post/632816505386647552
Poll results : Biden 48% / Trump 44%
Adjusted %: Trump 51.5% / Biden 44.6%. Trump +6.9%
3) North Carolina Forecast
(1) Party ID
Based on Voter registration Trends
VBM+In person(60%) DEM 55.5% / REP 38.5% / IND 6%
EDay(40%) REP 65% DEM 25% IND 10%
My Model(With leaners): REP 51% / DEM 42% / IND7%
exclude leaners: REP 35% / DEM 30% / IND 35%
Details of My NC Party ID Model.(with leaners)
Read my post: https://statespoll.com/post/632543897604751360
(2) Rate NC
Poll % (adjusted %+ cosindered Libertarian&Green): Lean Trump
Party ID % Trends: Favor REP(Nov 2016: D +9.3% -> Oct 2020: D +5.5%)
Current Early voting REP is narrowing gap radically
VBM: favor REP
Conclusion: Lean Trump
10. Georgia
1) Election 2018 Fox News Voter Analysis
Georgia Governor Race 2018. 3,955 Respondents(Voters)
https://www.foxnews.com/midterms-2018/voter-analysis?filter=GA&type=G
Party ID with leaner: REP 48% DEM 41% IND 11%
2) Latest Poll
(1) Civiqs 10/23-10/26, 1,041 LV.
https://statespoll.com/post/633133585426251776
Poll results: Biden 51% / Trump 46%
Adjusted: Trump 51.7% / Biden 46.3%. Tump +5.4%
(2) Yougov 10/20-10/23, 1,090 LV.
https://statespoll.com/post/632961884585426944
Poll results: Trump 48% / Biden 48%
Adjusted: Trump 53.7% / Biden 44.1%. Trump +9.6%
(3) AJC 10/14-10/23, 1,145 LV.
https://statespoll.com/post/633036015536406528
Poll results: Biden 46.5% / Trump 46.2%
Adjusted: Trump 50.85% / Biden 43.4%. Trump +6.45%
(4) Landmark 10/21, 500 LV.
Poll results: Trump 50% / Biden 46%
Notable results: 72% GA White voters are favoring Trump.
3) Georgia 2020 Forecast
Considering White-Evangelical’s turnout might be higher in preisdential year.
(1) Party ID %
Based on foxnews voter analysis adjustment.
exclude leaners: REP 41% / DEM 32% / IND 27%
with leaners: REP 52% / DEM 41% / IND 7%
(2) Rate Georgia
Party ID %: Likely REP
Early Voting: Huge Favor GOP
Poll % (adjusted %+ cosindered Libertarian&Green): Likely Trump
Conclusion: Likely Trump
11. Iowa
1) Election 2018 Fox News Voter Analysis
Iowa Governor Race 2018. 3,955 Respondents(Voters)
https://www.foxnews.com/midterms-2018/voter-analysis?filter=GA&type=G
Despite of White-Evangelical’s Low turnout (Presidential election 2016 Exit Poll 34% vote share, 2018: 23% share. 11% lower than 2016)
Final results: Kim Reynolds(Rep) 50.3% / Fred Hubbell(Dem) 47.5%
Party ID with leaner:
REP 47% Hubbell 11% Reynolds 87%
DEM 36% Hubbell 94% Reynolds 5%
IND 17%
1) Iowa Party ID % Statistics(Active Registered Voters)
https://sos.iowa.gov/elections/voterreg/county.html
(1) September 1, 2020: Total 2,027,777
https://sos.iowa.gov/elections/pdf/VRStatsArchive/2020/CoSept20.pdf
Dem 684,093 (33.73%) Rep 691,239 (34.09%) R +0.36%
(2) November 1, 2016: Total 1,996,153
https://sos.iowa.gov/elections/pdf/VRStatsArchive/2016/CoNov16.pdf
Dem 629,081 (31.51%) Rep 662,167(33.17%) R +1.66%
2) Latest Poll
(1) Emerson, 10/19-10/21. 435 LV.
https://statespoll.com/post/632849562979188736
Poll Results: Trump 48% / Biden 48% (Push undecided)
Adjusted: Trump 51.6% / Biden 44.2%. Trump +7.4%
(2) InsiderAdvantage, 10/18-10/19. 400 LV.
https://statespoll.com/post/632551635927941120
Poll Results: Biden 45.1% / Trump 44.6%
Adjusted: Trump 52.7% / Biden 42.7%. Trump +10%
3) Iowa 2020 Forecast
Considering White-Evangelical’s turnout might be higher in preisdential year.
(1) Party ID
Based on Voter registration Trends+Fox new voter analysis adjustment.
exclude leaners: REP 40% / DEM 30% / IND 30%
with leaners: REP 53% / DEM 36% / IND 11%
(2) Rate Iowa
Party ID %: Likely REP
Poll % (adjusted %+ cosindered Libertarian&Green): Likely Trump
Conclusion: Likely Trump
* 2016 Results: TRUMP(REP) 51.15 / Hillary(DEM) 41.74% R +9.41%
12. Texas
1) Election 2018 Fox News Voter Analysis
Texas Senate Race 2018. 3,747 Respondents(Voters)
https://www.foxnews.com/midterms-2018/voter-analysis?filter=TX&type=S
REP 49% / dem 41% / IND 10%. Final Results: Cruz 50.9% / Beto 48.3%
Current Early Voting numbers.
TargetSmart Model :
10/21/2020 REP 50.3% / DEM 40.9% / IND 8.8%
10/25/2020 REP 51.9% / DEM 38.9% / IND 9.2%
Considering ED might be : REP 52%+ / DEM 39% or less / IND 9%
(2018: R +8% -> 2020: Might be R +13% or more. )
2) Latest Poll
(1) Yougov, 10/13-10/20. 1,000 LV.
https://statespoll.com/post/633051947607490561
Poll Results: Trump 50.0% / Biden 44.7%
Adjusted: Trump 54.1% / Biden 43.87%. Trump +10.23%
(2) University of Texas at Tyler, 10/13-10/20. 925 LV.
https://statespoll.com/post/633022385368547329
Poll Results: Biden 48% / Trump 45%
Adjusted: Trump 50.84% / Biden 45.54%. Trump +5.3%
Conclusion: Solid Trump.
III. NH/ME(Semi Blue States ME2/NE2: Swing district)
13. Maine
Maine Governor Race 2018. 2,734 Respondents(Voters)
https://www.foxnews.com/midterms-2018/voter-analysis?filter=ME&type=G
Party ID%(With Leaners): DEM 41% / REP 41% / IND 18%
ME Party ID % Statistics(Active Registered Voters)
https://www.maine.gov/sos/cec/elec/data/index.html
1) ME Party ID % Statistics(Active Registered Voters)
https://www.maine.gov/sos/cec/elec/data/index.html
(1) 7/14/2020: Total 1,063,383
https://www.maine.gov/sos/cec/elec/data/data-pdf/r-e-active.pdf
DEM 386,786(36.4%) / REP 295,122(27.8%). D +8.6%
(2) 11/6/2018: Total 1,054,952
https://www.maine.gov/sos/cec/elec/data/data-pdf/r-e-active1118.pdf
DEM 348,657(33.05%) / REP 287,955(27.3%). D +5.75%
(3) 11/8/2016: Total 1,058,444
https://www.maine.gov/sos/cec/elec/data/r-e-active-11-8-16.pdf
DEM 338,352(32.0%) / REP 285,320(27.0%). D +5.0%
2) Maine 2020 Forecast
(1) Party ID%
Based on Voter registration Trends+Fox new voter analysis adjustment.
exclude leaners: DEM 35% / REP 32% / IND 33%
with leaners: DEM 44% / REP 42% / IND 14%
(2) Vote-By-Mail+in person:
ME-2: Lean Trump
My Post(ME-2): https://statespoll.com/post/632560185693618176
ME-1: Solid Biden. ME(Statewide): Nearly Solid Biden.
14. NE-2 District
Current Early Voting TargetSmart Model:
10/22 DEM 49.8% / REP 44.4% / IND 5.8%
10/26 DEM 48.8% / REP 45.3% / IND 5.9%
*FYI 2016 EV(58,667 Votes): DEM 52.5% / REP 42.0% / IND 5.6%
Plus REP is narrowing EV Gaps day by day
I guess in the end, with Election Day: REP 51% / DEM 42% / IND 7%
Conclusion: Tilt~Lean Trump
#Electoral map#Electoral college map#electoral map 2020#electoral college map 2020#forecast map#prediction map#election 2020
1 note
·
View note
Text
its a beautiful day in the bay
and i am going up to pano to checkout the view and smoke some blunts with tha homegirls. (if you live in the bay && haven't checked out the view up at panoramic way you need to GET YOUR LIFE TOGETHER && go do that shit!) unfortunately for me, i have one final, boring ass art history class this evening..... tempted not to go but whatever ill just have a whiskey sour before hand && then i will doodle and write poems during lecture.
its amazing what sunshine can do to me <3
//happysunshinerant
0 notes
Text
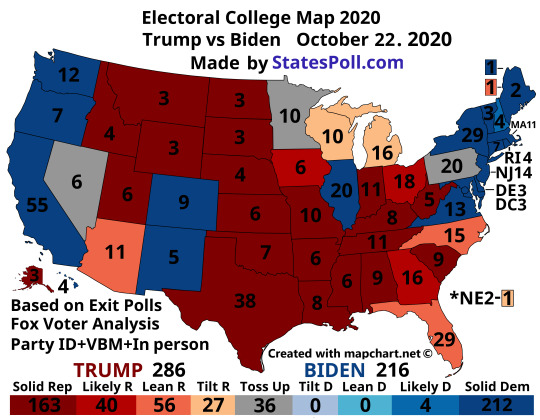
Presidential Election 2020 Electoral College Map. (2020 Forecast Map/Prediction Map). Donald Trump vs Joe Biden. October 22, 2020.
My Twitter:
This Map Created with www.Mapchart.net
US Presidential Election 2020:
Donald Trump vs Joe Biden
October 22~, 2020
Trump 286 / Biden 216 / Toss up 36
Posts will continue to be updated.
Latest Polls/Party ID+VBM+In person Statistcs.
Last updated: 9 PM EST. October 24. 2020
PA Poll + Oakland County(Michigan)
Rating Changes:
* My analysis is neutral, not biased.
Based on 2012/2016/2018 Exit Polls + Voter registration +Trends + Party ID %.
About the details below(Read more)
Based on
1) Midterm Election 2018 Fox New Voter Analysis
https://www.foxnews.com/midterms-2018/voter-analysis
2) Exit Poll 2012/2016/2018
http://www.cnn.com/election/2012/results/race/president/
https://www.cnn.com/election/2016/results/exit-polls
https://edition.cnn.com/election/2018/exit-polls
3) Latest Poll(adjustment)
4) Voter registration statistics + VBM
I. Rust Belt (MI/OH/PA/WI)
1. Michigan.
1) Election 2018 Fox News Voter Analysis
Michigan Senate Race 2018. 3,909 Respondents(Voters)
https://www.foxnews.com/midterms-2018/voter-analysis?filter=MI&type=S
Party ID with leaners: REP 43% / DEM 42% / IND 15%
2) Latest Poll
(1) PPP(Dem Pollster), 10/21-10/22. 804 LV.
https://statespoll.com/post/632689663662063616
Poll results: Biden 50% / Trump 43%
Notable Results, MISen, Among Black voters: Peter 70% / James 19%
Adjusted %: Trump 47.5% / Biden 45.6%. Trump +1.9%
(2) ZIA Poll, 10/11-10/18. 2,851 LV.
https://mirsnews.com/pdfs/poll_cross_tabs/1603227211.pdf
Poll results: Trump 49% / Biden 45%. Trump +4%
(3) Epic-MRA, 10/15-10/19. 600 LV.
https://statespoll.com/post/632689663662063616
Poll results: Biden 48% / Trump 39%
Adjusted %: Trump 44.4% / Biden 43.2%. Trump +1.2%
(4) Data for Progress, 10/15-10/18. 830 LV.
https://statespoll.com/post/632689663662063616
Poll results: Biden 50% / Trump 45%
Adjusted %: Trump 51.89% / Biden 46.15%. Trump +5.74%
3) Michigan 2020 Forecast
(1) Party ID % 2020 forecast
Based on Voter registration+Fox new voter analysis adjustment+
Early voting(VBM+In person)
with leaner: REP 49% / DEM 43% / IND 8%
Exclude Leaner: REP 38% / DEM 34% / IND 28%
VBM+in person 55% / Election Day 45% Model.
Details About My Michigan Party ID % Model(with Leaners)
Read My Analysis Post: https://statespoll.com/post/632689663662063616
(2) Rate Michigan.
1) Party ID %: Favor REP
2) Current Vote-By-Mail: Favor Trump
According to https://targetearly.targetsmart.com/
* Oakland County: 292,584+ voters casted ballot
(About 44% of 2016 Total votes)
DEM 46.5% REP 41.2% IND 12.3% <- October 23. 2020
REP even takes the leads among did not vote in 2016 group
Total: 70,601. REP 27,725 (39.3%) > DEM 27,113 (38.4%)
Considering ED(45% Share) might favor Trump.
(sth like T 60 B 30 Margins) I guess Trump might flip Oakland County.
(FYI even 2018 John james got 42.4% in Oakaland. considering
3rd parties and Biden doesnt have INC advantges like Stabenow and
Early voting favor Trump. Trump just needs to improve James+6.2%ish
= flip Oakaland county.)
Kent/Macomb: REP takes the leads in Early voting + consider ED
3) Poll % (adjusted %): Lean Trump
Conclusion) MI: Tilt~Lean Trump
2. Wisconsin
1) Voter Registration Statistics
2) Election 2018 Fox News Voter Analysis
Wisconsin Governor Race 2018. 4,683 Respondents(Voters)
https://www.foxnews.com/midterms-2018/voter-analysis?filter=WI&type=G
(1) Party ID%, Wisconsin with leaner: REP 45% / DEM 43% / IND 13%
3) Latest Poll
(1) RMG Research, 10/14-10/20. 800 LV.
https://statespoll.com/post/632687368476016640
Poll results: Biden 50% / Trump 44%
Adjusted %: Trump 48.74% / Biden 47.9%. Trump +0.84%
(2) Ipsos, 10/13-10/19. 663 LV.
https://statespoll.com/post/632453769149480960
Poll results: Biden 51% / Trump 45% / Joregensen 2% / West 1%
Adjusted %: Trump 49.3% / Biden 47.0%. Trump +2.3%
(3) Trafalgar, 10/14-10/16. 1,051 LV
https://www.thetrafalgargroup.org/news/wi-pres-1020/
Poll results : Biden 47.6% / Trump 46.3%. Biden +1.3%
(4) Yougov, 10/13-10/16. 1,112 LV.
https://statespoll.com/post/632328485513445376
Poll results: Biden 51% / Trump 46%
Adjusted %: Trump 50.7% / Biden 47.9%. Tump +2.8%
4) Wisconsin 2020 Forecast
(1) Party ID % 2020
Based on Fox new voter analysis adjustment+Trends
Exclude leaners: REP 40% / DEM 32% / IND 28%
with leaners: REP 50% / DEM 42% / IND 8%
VBM+in person 50% / Election Day 50% Model.
Details About My Wisconsin Party ID % Model(with Leaners)
Read My Analysis Post: https://statespoll.com/post/632687368476016640
(2) Rate Wisconsin
1) Party ID %: Favor REP
2) Vote-By-Mail+in person: Favor Trump
according to Wisconsin TargetSmart Early Voting Model
https://targetearly.targetsmart.com
WOW Counties +Racine+Sheboygan+Brown+Winnebago+Outagamie:
Ultra Trending R. 1st time/Infrequent Voters also.
3) Poll % (adjusted %): Tilt Trump
Conclusion) WI: Tilt Trump
3. Pennsylvania
1) Election 2018 Fox News Voter Analysis
Pennsylvania Senate Race 2018. 3,925 Respondents(Voters)
https://www.foxnews.com/midterms-2018/voter-analysis?filter=PA&type=S
(1) Party ID%, Pennsylvania with leaner, PA Sen 2018
with leaner REP 45% / DEM 44% / IND 11%
2) Pennsylvania Party ID % Statistics
https://www.dos.pa.gov/VotingElections/OtherServicesEvents/VotingElectionStatistics/Documents/currentvotestats.xlsx
(1) October 5, 2020: Total 8,897,739
Dem: 4,168,900 (46.85%) / Rep: 3,451,514 (38.79%). D +8.06%
(2) September 21, 2020: Total 8,800,420
Dem: 4,138,254 (47.02%) / Rep: 3,405,240 (38.69%). D +8.33%
(3) November 6, 2018: Total 8,609,880
Dem: 4,111,325 (47.75%) / Rep: 3,270,882 (37.99%). D +9.76%
(4) November 8, 2016: Total 8,722,977
Dem: 4,217,456 (48.35%) / Rep: 3,301,182 (37.84%). D +10.51%
3) Latest Poll
(1) Gravis, 10/23. 602 LV.
https://statespoll.com/post/632453093361090560
Poll results: Biden 51% / Trump 44%
Adjusted: Trump 48.57% / Biden 46.84%. Trump +1.73%
(2) Muhlenberg College, 10/13-10/20. 416 LV.
https://statespoll.com/post/632773657270353921
Poll results: Biden 51% / Trump 44%
Adjusted %: Trump 49.4% / Biden 46.4%. Trump +3.0%
(3) Suffolk, 10/15-10/19. 500 LV.
https://statespoll.com/post/632585614659911680
Poll results: Biden 48.6% / Trump 42.4%
Adjusted %: Biden 46.4% / Trump 45.7%. Biden +0.7%
(4) Ipsos, 10/13-10/19. 653 LV.
https://statespoll.com/post/632453093361090560
Poll results: Biden 49% / Trump 45%
Adjusted %: : Trump 49.4% / Biden 45.2%. Trump +4.2%
4) Pennsylvania 2020 Forecast
(1) Party ID % 2020
Based on Voter registration Trends+Fox new voter analysis adjustment
+ VBM+In person 41% / Election Day 59% Model
with leaner: REP 50% / DEM 42% / IND 8%
exclude Leaner: REP 44% / DEM 40% / IND 16%
Details about my PA model
read my Post: https://statespoll.com/post/632453093361090560
(2) Realistic Race % 2020 forecast
White 81% / Black 10% / Latino 6% / Asian 1% / Other 2%
(3) Rate Pennsylvania.
1) Party ID %: slightly faovr REP
2) Vote-By-Mail: Republican is narrowing gaps.
3) Poll % (adjusted %): Tilt R
Conclusion) PA: Toss up
4. Ohio
1) Election 2018 Fox News Voter Analysis
Ohio Governor Race 2018. 3,819 Respondents(Voters)
https://www.foxnews.com/midterms-2018/voter-analysis?filter=OH&type=G
Party ID with leaner: REP 48% / DEM 41% / IND 12%
2) Latest Poll
(1) Morning Consult 10/2-10/11, 2,283 LV.
https://statespoll.com/post/631874761949118464
Poll results: Trump 49% / Biden 46%.
Adjusted %: Trump 50.86% / Biden 45.08%. Trump +5.78%
(2) Yougov, 9/30-10/2. 1,114 LV.
https://statespoll.com/post/631093235366920192
Poll results: Trump 47% / Biden 47%.
Adjusted %(by statespoll):Trump 50.4% / Biden 45.5%.
3) Ohio 2020 Forecast
Considering White-Evangelical’s turnout might be higher in Ohio
(1) Party ID%
Based on Voter registration+Fox new voter analysis adjustment+Trends
in 2020 it might be something like
exclude leaners: REP 39% / DEM 31% / IND 30%
with leaners: REP 52% / DEM 41% / IND 7%
(2) Rate Ohio
Party ID %: Likely REP
Poll % (adjusted %+ cosindered Libertarian&Green): Likely Trump
Early Voting heavily favor REP
Conclusion: Likely Trump
* 2016 Results: TRUMP(REP) 51.69% / Hillary(DEM) 43.56%. R +8.13%
II. Other Swing States (AZ/FL/GA/IA/NC/NV/TX)
5. Arizona
1) Arizona Party ID % Statistics
Arizona Voter Registration %
10/28/2016: REP +148,291
10/20/2020: REP +113,896
https://twitter.com/mantlehog/status/1318572169748676608
According to Twitter user Billy Newby
-----------
Billy Newby@mantlehog
Replying to @GuruLidar and @JaredKi62866526I
think the final GOP advantage will be 135-140k, but that might be
conservative considering the counties outstanding. Very close to 2016 once the
remaining counties are factored in.
https://twitter.com/mantlehog/status/1318575045141254144
----------
DEM narrowed gap 10K. with 77%ish turnout (2016: 74.17%)
Dem actually narrowed Approximately 7.7K, abou less than 0.3%ish of
Total votes. (2016: Trump +3.5%)
https://azsos.gov/elections/voter-registration-historical-election-data
Active voters only
(1) August 4, 2020: Total 3,989,214
Rep: 1,389,960(34.84%) Dem 1,293,074(32.41%). R +2.43%
https://azsos.gov/sites/default/files/State_Voter_Reigstration_2020_Primary.pdf
(2) November 6, 2018: Total 3,712,500
Rep: 1,287,831 (34.69%) Dem 1,150,436(30.99%). R +3.7%
https://apps.azsos.gov/election/voterreg/2018-10-01.pdf
(3) October 28, 2016: Total 3,588,466
Rep: 1,239,614(34.54%) Dem 1,091,323(30.41%). R +4.13%
https://apps.azsos.gov/election/voterreg/2016-11-08.pdf
2) Election 2018 Fox News Voter Analysis
Arizona Senate 2018. 3,717 Respondents(Voters)
https://www.foxnews.com/midterms-2018/voter-analysis?filter=AZ&type=S
Despite of White-Evangelical’s Low turnout (Presidential election 2012 Exit Poll 21% vote share, 2018: 13% share. 8% lower than 2012)
Party ID with leaner:
REP 47% Sinema 10% / McSally 89%
DEM 41% Sinema 95% / McSally 4%
IND 12% Sinema 54% / McSally 37%
Trump approval: Approve 49% / Disapprove 51%
3) Latest Poll
(1) Susquehanna Polling & Research Inc. 10/19-10/22. 500 LV.
https://overland.amgreatness.com/app/uploads/2020/10/Toplines-ArizonaStatewide-CFAG-Oct2020.pdf
Poll results: Trump 47% / Biden 46%
(2) Ipsos 10/14-10/21. 658 LV.
https://statespoll.com/post/632656270366785536
Poll results: Biden 50% / Trump 46%
Adjusted %: Trump 50.8% / Biden 45.9%. Trump +4.9%
(3) RMG Research, 10/14-10/19. 800 LV.
https://statespoll.com/post/632547841755217920
Poll results: Biden 47% / Trump 46%
Adjusted %: Trump 49.8% / Biden 46.2%. Trump +3.6%
(4) Data Orbital, 10/16-10/18. 550 LV.
https://statespoll.com/post/632508759509434368/
Poll results: Biden 47.1% / Trump 41.8% / Joregensen 2.9%
Adjusted %: Biden 48.85% / Trump 46.75%. Biden +2.1%
FYI)
Data orbital overestimated Trump in 2016(Trump +8%. Final results
Trump +3.5%) And overestimated sinema in 2018
Data Orbital 10/16-10/17. 2018. 600 LVSinema 47% / McSally 40%.
Sinema +7%(final results margin was Sinema +2.4%.)
https://www.dataorbital.com/the-blog/new-survey-sinema-leads-mcsally-in-latest-survey
4) Arizona 2020 Forecast
Considering White-Evangelical’s turnout might be higher in preisdential year
(1) Party ID%
With Leaners: REP 51% / DEM 42% / IND 7%
About the details read my analysis Post:
https://statespoll.com/post/632547841755217920
(2) Rate Arizona
Party ID %:
Vote-By-Mail: Current EV in AZ. Trending R(Including Maricopa county)
Favor Trump
Poll % (adjusted %+ cosindered Libertarian&Green): Lean Trump
Voter registration: Considering Turnout(77%ish) Dem narrowed gaps
about 0.3%ish, 2016 was Trump +3.5%.
Trump's 2016 margins 3.5-0.3%= 3.2%
So Arizona Voter registration number is still favor Trump.
Conclusion: Lean Trump
6. Florida
1) Florida Party ID % Statistics
https://dos.myflorida.com/elections/data-statistics/voter-registration-statistics/voter-registration-reportsxlsx/voter-registration-by-party-affiliation/
(1) August 31, 2020: Total 14,065,627
Dem: 5,203,795 (37.0%) / Rep: 5,020,199 (35.69%). D +1.31%
(2) February 29, 2020: Total 13,730,763
Dem: 5,115,768 (37.26%) / Rep: 4,832,285 (35.19%). D +2.07%
(3) End of 2018: Total 13,396,622
Dem: 4,975,895 (37.14%) / Rep: 4,718,720 (35.22%). D +1.92%
(4) End of 2016: Total 12,959,185
Dem: 4,905,705 (37.86%) / Rep: 4,575,277 (35.31%). D +2.55%
2) Election 2018 Fox News Voter Analysis
Florida Senate Race 2018. 3,717 Respondents(Voters)
https://www.foxnews.com/midterms-2018/voter-analysis?filter=FL&type=S
Party ID with leaner: REP 46% / DEM 42% / IND 14%
3) Latest Poll
(1) Rasmussen, 10/20-10/21. 800 LV
https://www.rasmussenreports.com/public_content/politics/elections/election_2020/florida_trump_49_biden_46
Poll results: Trump 50% / Biden 46%. Trump +4.0%
(2) St. Pete Polls, 10/21-10/22. 2,527 LV.
https://statespoll.com/post/632773010577866752
Poll results: Biden 48.9% / Trump 47.4%
Notable results, Among Hispanic: Biden 49.9% / Trump 47.3%.
Biden +2.6% (2016 FL Exit Poll, Hispanic: Hillary 62% / Trump 35%.)
Adjusted %: Trump 49.1% / Biden 47.2%. Trump +1.9%
(3) Civiqs, 10/17-10/20. 863 LV
https://statespoll.com/post/632594327193993216
Poll results: Biden 51% / Trump 47%
Adjusted %: Trump 52.4% / Biden 44.1%. Trump +7.3%
4) Florida 2020 Forecast
(1) 2020 Party ID %
Based on Voter registration Trends+Fox new voter analysis adjustment.
+Early Voting(VBM+in person)
Exclude leaners: REP 41% / DEM 34% / IND 25%
2018 FL GOV Exit Poll(Exclude Leaners): REP 38% / DEM 33% /IND 29%
https://edition.cnn.com/election/2018/exit-polls/florida
with leaners: REP 51% / DEM 40% / IND 9%
Details of My FL Party ID model,
Read My Analysis post: https://statespoll.com/post/632594327193993216
(2) Rate Florida.
Party ID % Trends:(Nov 2016: D +2.5% -> Sept 2020: D +1.3%)
Vote-By-Mail:
Florida VBM+in person mid results (Oct. 13)
https://www.nbcnews.com/politics/2020-elections/florida-results
Mail-in ballots requested: 5,629,666
DEM 45.3% / REP 31.3% / Other 23.4%
Mail-in and early in-person ballots returned: 1,780,584
DEM 50.8% / REP 29.2% / Other 20%
Poll % (adjusted %): Likely Trump
Conclusion: Lean~Likely Trump
* 2016 Results: TRUMP(REP) 49.02% / Hillary(DEM) 47.82%. R +1.2%
7. Minnesota
1) Election 2018 Fox News Voter Analysis
Minnesota Special Senate Race 2018. 4,201 Respondents(Voters)
https://www.foxnews.com/midterms-2018/voter-analysis?filter=MN&type=S2
(1) Party ID%, Minnesota with leaner, MN Special Sen 2018
with leaners: DEM 46% / REP 40% / IND 14%
2) Latest Poll
(1) Civiqs, 10/17-10/20. 840 LV.
https://statespoll.com/post/632594716317384704
Poll results : Biden 53% / Trump 43%
Adjusted %: Biden 48.96% / Trump 48.64%. Biden +0.32%
(2) Minnesota: KSTP/SurveyUSA 10/16-10/20. 625 LV Smith vs Lewis
https://kstp.com/politics/kstpsurveyusa-smith-lewis-senate-race-now-a-dead-heat-october-21-2020/5901843/?cat=1
Smith 43% / Lewis 42%. Smith +1%
3) Minnesota 2020 Forecast
(1) Party ID %
Voter registration+Fox new voter analysis adjustment+Trends
With Leaner: REP 44% / DEM 42% / IND 14%
Exclude Leaner: REP 38% / DEM 35% / IND 27%
Detials: https://statespoll.com/post/632594716317384704
(2) Rate Minnesota
Poll: Tilt DEM~Lean DEM
3) Vote-By-Mail+in person:
https://targetearly.targetsmart.com/
Last updated Oct. 20
Mail-in and early in-person ballots returned: 936,493
DEM 48.5% / REP 28.9% / IND+OTHER 22.6%
=> OCT 21: DEM 48.0% / REP 29.3% / IND+Other
Poll %: Toss up
Minnesota early voting analysis post:
https://statespoll.com/post/632227687289765888
Conclusion: Toss up
8. North Carolina
1) Party Statistics Trends %
2016 Results: TRUMP 49.83% / Hillary 46.17%
Party registration statistics Trends.
2016->2020 Dem’s margins reduced -3.82%
(1) October 10, 2020: Total 7,242,242
https://vt.ncsbe.gov/RegStat/Results/?date=10%2F10%2F2020
Dem 2,585,688 (35.70%) / Rep 2,185,854 (30.18%). D +5.52%
(2) December, 12th 2018: Total 7,129,017
https://vt.ncsbe.gov/RegStat/Results/?date=12%2F08%2F2018
Dem 2,696,715(37.82%) / Rep 2,124,202 (29.8%). D +8.02%
(3) November, 8th 2016: Total 6,918,150
https://vt.ncsbe.gov/RegStat/Results/?date=11%2F08%2F2016
Dem 2,733,188(39.51%) / Rep 2,086,942(30.17%). D +9.34%
2) Latest Poll
(1) Data for Progress, 10/15-10/18. 929 LV.
https://statespoll.com/post/632816505386647552
Poll results : Biden 48% / Trump 44%
Adjusted %: Trump 51.5% / Biden 44.6%. Trump +6.9%
(2) Ipsos, 10/14-10/20. 660 LV.
https://statespoll.com/post/632543897604751360
Poll results : Biden 49% / Trump 46%
Adjusted %: Trump 49.8% / Biden 46.8%. Trump +3.0%
3) North Carolina Forecast
(1) Party ID
Based on Voter registration Trends
VBM+In person(60%) DEM 55.5% / REP 38.5% / IND 6%
EDay(40%) REP 65% DEM 25% IND 10%
My Model(With leaners): REP 51% / DEM 42% / IND7%
exclude leaners: REP 35% / DEM 30% / IND 35%
Details of My NC Party ID Model.(with leaners)
Read my post: https://statespoll.com/post/632543897604751360
(2) Rate NC
Poll % (adjusted %+ cosindered Libertarian&Green): Lean Trump
Party ID % Trends: Favor REP(Nov 2016: D +9.3% -> Oct 2020: D +5.5%)
Current Early voting REP is narrowing gap radically
VBM: favor REP
Conclusion: Lean Trump
9. Nevada
1) Nevada Party ID % Statistics(Active Registered Voters)
https://www.nvsos.gov/sos/elections/voters/voter-registration-statistics
(1) Oct 1, 2020: Total 1,742,477
https://www.nvsos.gov/sos/home/showdocument?id=8998
Dem 654,724 (37.57%) Rep 566,265(32.5%) D+5.07%
(2) September 1, 2020: Total 1,682,436
https://www.nvsos.gov/sos/home/showdocument?id=8858
Dem 639,665 (38.02%) Rep 548,129(32.58%) D+5.44%
(3) April 1, 2020: Total 1,614,872
https://www.nvsos.gov/sos/home/showdocument?id=8514
Dem 623,394 (38.6%) Rep 528,119(32.7%) D+5.9%
(4) March 2, 2020: Total 1,594,557
https://www.nvsos.gov/sos/home/showdocument?id=8433
Dem 611,355 (38.34%) Rep 524,652(32.9%) D+5.44%
(5) Jan 3, 2019: Total 1.582 Million
Dem 607.4k(38.39%) Rep 528.7k(33.42%) D+4.97%
(6) Oct 21, 2016: Total 1,464,819
https://www.nvsos.gov/sos/home/showdocument?id=4518
Dem 577,679(39.44%) Rep 488,861(33.37%) D+6.07%
2) Election 2018 Fox News Voter Analysis
Nevada Senate Race 2018. 3,400 Respondents(Voters)
https://www.foxnews.com/midterms-2018/voter-analysis?filter=NV&type=S
Party ID with leaners: DEM 44% / REP 42% / IND 14%s
3) Latest Poll
(1) Civiqs, 10/17-10/20. 712 LV.
https://statespoll.com/post/632594187760664576
Poll results: Biden 52% / Trump 43%
Adjusted %: Trump 49.175% / Biden 48.875%. Trump +0.3%
4) Nevada 2020 Forecast
(1) 2020 Party ID %
Based on Voter registration Trends+Fox new voter analysis adjustment.
exclude leaners: DEM 33% / REP 29% / IND 38%
with leaners: REP 47.5% / DEM 43% / IND 9.5%
(2) Rate Nevada
1) Party ID %:
2) Poll %: Toss up
3) Vote-By-Mail+in person:
Nevada VBM. Oct. 14 Returned: 51,847
DEM 53.2% / REP 24.4% / Other 21.7%
=> Oct. 21: DEM 50.2% / REP 41.7% IND 8.1%
NV Early voting is radically Trending R.
Conclusion: Toss up
* 2016 Results: Hillary(DEM) 47.92% / TRUMP(REP) 45.5% / D+2.42%
10. Georgia
1) Election 2018 Fox News Voter Analysis
Georgia Governor Race 2018. 3,955 Respondents(Voters)
https://www.foxnews.com/midterms-2018/voter-analysis?filter=GA&type=G
Party ID with leaner: REP 48% DEM 41% IND 11%
2) Latest Poll
(1) Landmark 10//21, 500 LV.
Poll results: Trump 50% / Biden 46%
Notable results: 72% GA White voters are favoring Trump.
(2) NYT/Siena 10/13-10/19, 759 LV.
https://statespoll.com/post/632550054936346624
Poll results: Trump 45% / Biden 45%
Adjusted %: Trump 52.85% / Biden 43.59%. Trump +9.26%
(3) Emerson 10/17-10/19, 506 LV.
https://statespoll.com/post/632455733446852608
Poll results(push undecided): Trump 48.42% / Biden 47.03%
Adjusted %: Trump 49.7% / Biden 44.8%. Trump +4.9%
3) Georgia 2020 Forecast
Considering White-Evangelical’s turnout might be higher in preisdential year.
(1) Party ID %
Based on foxnews voter analysis adjustment.
exclude leaners: REP 41% / DEM 32% / IND 27%
with leaners: REP 52% / DEM 41% / IND 7%
(2) Rate Georgia
Party ID %: Likely REP
Early Voting: Huge Favor GOP
Poll % (adjusted %+ cosindered Libertarian&Green): Likely Trump
Conclusion: Likely Trump
11. Iowa
1) Election 2018 Fox News Voter Analysis
Iowa Governor Race 2018. 3,955 Respondents(Voters)
https://www.foxnews.com/midterms-2018/voter-analysis?filter=GA&type=G
Despite of White-Evangelical’s Low turnout (Presidential election 2016 Exit Poll 34% vote share, 2018: 23% share. 11% lower than 2016)
Final results: Kim Reynolds(Rep) 50.3% / Fred Hubbell(Dem) 47.5%
Party ID with leaner:
REP 47% Hubbell 11% Reynolds 87%
DEM 36% Hubbell 94% Reynolds 5%
IND 17%
1) Iowa Party ID % Statistics(Active Registered Voters)
https://sos.iowa.gov/elections/voterreg/county.html
(1) September 1, 2020: Total 2,027,777
https://sos.iowa.gov/elections/pdf/VRStatsArchive/2020/CoSept20.pdf
Dem 684,093 (33.73%) Rep 691,239 (34.09%) R +0.36%
(2) November 1, 2018: Total 2,013,140
https://sos.iowa.gov/elections/pdf/VRStatsArchive/2018/CoNov18.pdf
Dem 627,430 (31.17%) Rep 649,944 (32.28%) R +1.09%
(3) November 1, 2016: Total 1,996,153
https://sos.iowa.gov/elections/pdf/VRStatsArchive/2016/CoNov16.pdf
Dem 629,081 (31.51%) Rep 662,167(33.17%) R +1.66%
2) Latest Poll
(1) Emerson, 10/19-10/21. 435 LV.
https://statespoll.com/post/632849562979188736
Poll Results: Trump 48% / Biden 48% (Push undecided)
Adjusted: Trump 51.6% / Biden 44.2%. Trump +7.4%
(2) InsiderAdvantage, 10/18-10/19. 400 LV.
https://statespoll.com/post/632551635927941120
Poll Results: Biden 45.1% / Trump 44.6%
Adjusted: Trump 52.7% / Biden 42.7%. Trump +10%
3) Iowa 2020 Forecast
Considering White-Evangelical’s turnout might be higher in preisdential year.
(1) Party ID
Based on Voter registration Trends+Fox new voter analysis adjustment.
exclude leaners: REP 40% / DEM 30% / IND 30%
with leaners: REP 53% / DEM 36% / IND 11%
(2) Rate Iowa
Party ID %: Likely REP
Poll % (adjusted %+ cosindered Libertarian&Green): Likely Trump
Conclusion: Likely Trump
* 2016 Results: TRUMP(REP) 51.15 / Hillary(DEM) 41.74% R +9.41%
12. Texas
1) Election 2018 Fox News Voter Analysis
Texas Senate Race 2018. 3,747 Respondents(Voters)
https://www.foxnews.com/midterms-2018/voter-analysis?filter=TX&type=S
REP 49% / dem 41% / IND 10%. Final Results: Cruz 50.9% / Beto 48.3%
Current Early Voting numbers. 10/21/2020
TargetSmart Model : REP 50.3% / DEM 40.9% / IND 8.8%
Considering ED might be : REP 52% / DEM 39~40% / IND 8~9%
(2018: R +8% -> 2020: Might be R +12~13%. )
Conclusion: Solid Trump.
III. NH/ME(Semi Blue States ME2/NE2: Swing district)
13. Maine
Maine Governor Race 2018. 2,734 Respondents(Voters)
https://www.foxnews.com/midterms-2018/voter-analysis?filter=ME&type=G
Party ID%(With Leaners): DEM 41% / REP 41% / IND 18%
ME Party ID % Statistics(Active Registered Voters)
https://www.maine.gov/sos/cec/elec/data/index.html
1) ME Party ID % Statistics(Active Registered Voters)
https://www.maine.gov/sos/cec/elec/data/index.html
(1) 7/14/2020: Total 1,063,383
https://www.maine.gov/sos/cec/elec/data/data-pdf/r-e-active.pdf
DEM 386,786(36.4%) / REP 295,122(27.8%). D +8.6%
(2) 11/6/2018: Total 1,054,952
https://www.maine.gov/sos/cec/elec/data/data-pdf/r-e-active1118.pdf
DEM 348,657(33.05%) / REP 287,955(27.3%). D +5.75%
(3) 11/8/2016: Total 1,058,444
https://www.maine.gov/sos/cec/elec/data/r-e-active-11-8-16.pdf
DEM 338,352(32.0%) / REP 285,320(27.0%). D +5.0%
2) Maine 2020 Forecast
(1) Party ID%
Based on Voter registration Trends+Fox new voter analysis adjustment.
exclude leaners: DEM 35% / REP 32% / IND 33%
with leaners: DEM 44% / REP 42% / IND 14%
(2) Vote-By-Mail+in person:
ME-2: Lean Trump
My Post(ME-2): https://statespoll.com/post/632560185693618176
ME-1: Solid Biden. ME(Statewide): Nearly Solid Biden.
14. NE-2 District
Current Early Voting TargetSmart Model: 10/22. 134,122+ voted already
DEM 49.8% / REP 44.4% / IND 5.8%
Compare with 2016(51,437 Votes): DEM 53.4% / REP 41.4% / IND 5.5%
Plus REP is narrowing EV Gaps day by day
I guess in the end, with Election Day: REP 50% / DEM 43% / IND 7%
Conclusion: Tilt Trump
1 note
·
View note
Text
Presidential Election 2020 Electoral College Map. (2020 Forecast Map/Prediction Map). Donald Trump vs Joe Biden. October 27, 2020.

My Twitter: https://twitter.com/StatesPoll/status/1321160480501559296
This Map Created with www.Mapchart.net
US Presidential Election 2020:
Donald Trump vs Joe Biden
October 27~, 2020
Trump 296 / Biden 222 / Toss up 20
Posts will continue to be updated.
Latest Polls/Party ID+VBM+In person Statistcs.
Last updated: 2:40 PM EST. October 27. 2020
FL/NV Polls + Oakaland County, Michigan(10/27)
Rating Changes:
NV: Tilt Trump-> Tilt Biden
* My analysis is neutral, not biased.
Based on 2012/2016/2018 Exit Polls + Voter registration +Trends + Party ID %.
About the details below(Read more)
Based on
1) Midterm Election 2018 Fox New Voter Analysis
https://www.foxnews.com/midterms-2018/voter-analysis
2) Exit Poll 2012/2016/2018
http://www.cnn.com/election/2012/results/race/president/
https://www.cnn.com/election/2016/results/exit-polls
https://edition.cnn.com/election/2018/exit-polls
3) Latest Poll(adjustment)
4) Voter registration statistics + VBM
I. Rust Belt (MI/OH/PA/WI)
1. Michigan.
1) Election 2018 Fox News Voter Analysis
Michigan Senate Race 2018. 3,909 Respondents(Voters)
https://www.foxnews.com/midterms-2018/voter-analysis?filter=MI&type=S
Party ID with leaners: REP 43% / DEM 42% / IND 15%
2) Latest Poll
(1) Gravis, 10/24. 679 LV.
https://statespoll.com/post/632961349208719360
Poll results: Biden 55% / Trump 42%
Adjusted %: Trump 48.44% / Biden 48.26%. Trump +0.18%
(2) PPP(Dem Pollster), 10/21-10/22. 804 LV.
https://statespoll.com/post/632689663662063616
Poll results: Biden 50% / Trump 43%
Notable Results, MISen, Among Black voters: Peter 70% / James 19%
Adjusted %: Trump 47.5% / Biden 45.6%. Trump +1.9%
(3) Trafalgar, 10/15-10/18. 1,034 LV.
https://d3n8a8pro7vhmx.cloudfront.net/restoration/pages/1001/attachments/original/1603307463/RSTP_MI_'20_Oct_Press_Report.pdf
Poll results: Trump 46.7% / Biden 44.9%. Trump +1.8%
3) Michigan 2020 Forecast
(1) Party ID % 2020 forecast
Based on Voter registration+Fox new voter analysis adjustment+
Early voting(VBM+In person)
With Leaners: REP 49% / DEM 42% / IND 9%
Exlcude Leaners: REP 40% / DEM 33% / IND 27%
VBM+in person 55% / Election Day 45% Model.
Details About My Michigan Party ID % Model(with Leaners)
Read My Analysis Post: https://statespoll.com/post/632689663662063616
TargetSmart Early Voting Model, Oakland County. Michigan. Oct. 7
https://targetearly.targetsmart.com/
DEM 46.7% / REP 41.7%. D+4.0%. considering ED. Trump is likely to flip
Oakland county.
(2) Rate Michigan.
1) Party ID %: Favor REP
2) Current Early Voting: Favor Trump
3) Poll % (adjusted %): Lean Trump
Conclusion) MI: Tilt~Lean Trump
2. Wisconsin
1) Voter Registration Statistics
2) Election 2018 Fox News Voter Analysis
Wisconsin Governor Race 2018. 4,683 Respondents(Voters)
https://www.foxnews.com/midterms-2018/voter-analysis?filter=WI&type=G
(1) Party ID%, Wisconsin with leaner: REP 45% / DEM 43% / IND 13%
3) Latest Poll
(1) Ipsos, 10/20-10/26. 664 LV.
https://statespoll.com/post/633089252265230336
Poll results: Biden 53% / Trump 44%
Adjusted %: Trump 48.92% / Biden 48.5%. Trump +0.42%
(2) Gravis, 10/23. 677 LV.
https://statespoll.com/post/632918928174235648
Poll results: Biden 54% / Trump 43%
Adjusted %: Biden 49.54% / Trump 48% Biden +1.54%
(3) RMG Research, 10/14-10/20. 800 LV.
https://statespoll.com/post/632687368476016640
Poll results: Biden 50% / Trump 44%
Adjusted %: Trump 48.74% / Biden 47.9%. Trump +0.84%
4) Wisconsin 2020 Forecast
(1) Party ID % 2020
Based on Fox new voter analysis adjustment+Trends
Exclude leaners: REP 40% / DEM 32% / IND 28%
with leaners: REP 50% / DEM 42% / IND 8%
VBM+in person 50% / Election Day 50% Model.
Details About My Wisconsin Party ID % Model(with Leaners)
Read My Analysis Post: https://statespoll.com/post/632687368476016640
(2) Rate Wisconsin
1) Party ID %: Favor REP
2) Vote-By-Mail+in person: Favor Trump
according to Wisconsin TargetSmart Early Voting Model
https://targetearly.targetsmart.com
WOW Counties +Racine+Sheboygan+Brown+Winnebago+Outagamie:
Ultra Trending R. 1st time/Infrequent Voters also.
Wisconsin Ealry Voting Analysis October 25. 2020
https://statespoll.com/post/633006764145737728
3) Poll % (adjusted %): Toss up
Conclusion) WI: Toss up
3. Pennsylvania
1) Election 2018 Fox News Voter Analysis
Pennsylvania Senate Race 2018. 3,925 Respondents(Voters)
https://www.foxnews.com/midterms-2018/voter-analysis?filter=PA&type=S
(1) Party ID%, Pennsylvania with leaner, PA Sen 2018
with leaner REP 45% / DEM 44% / IND 11%
2) Pennsylvania Party ID % Statistics
https://www.dos.pa.gov/VotingElections/OtherServicesEvents/VotingElectionStatistics/Documents/currentvotestats.xlsx
(1) October 5, 2020: Total 8,897,739
Dem: 4,168,900 (46.85%) / Rep: 3,451,514 (38.79%). D +8.06%
(2) November 6, 2018: Total 8,609,880
Dem: 4,111,325 (47.75%) / Rep: 3,270,882 (37.99%). D +9.76%
(3) November 8, 2016: Total 8,722,977
Dem: 4,217,456 (48.35%) / Rep: 3,301,182 (37.84%). D +10.51%
3) Latest Poll
(1) Civiqs, 10/23-10/26. 1,145 LV.
https://statespoll.com/post/633134014505598976
Poll results: Biden 52% / Trump 45%
Adjusted %: Trump 50.23% / Biden 47.65%. Trump +2.58%
(2) Trafalgar, 10/24-10/25. 1,076 LV.
https://twitter.com/RobertCahaly/status/1321103067933249536
Poll results: Trump 48.4% / Biden 47.6%. Trump +0.8%
(3) InsiderAdvantage, 10/25. 400 LV.
https://statespoll.com/post/633091095658627072
Poll results: Trump 48.4% / Biden 45.5%
Adjusted %: Trump 49.04% / Biden 44.25%. Trump +4.79%
(4) Ipsos, 10/20-10/26. 655 LV.
https://statespoll.com/post/632453093361090560
Poll results(5way race): Biden 51% / Trump 44%
Adjusted %: Trump 48.2% / Biden 46.9%. Trump +1.3%
4) Pennsylvania 2020 Forecast
(1) Party ID % 2020
Based on Voter registration Trends+Fox new voter analysis adjustment
+ VBM+In person 41% / Election Day 59% Model
with leaner: REP 50% / DEM 42% / IND 8%
exclude Leaner: REP 44% / DEM 40% / IND 16%
Details about my PA model
read my Post: https://statespoll.com/post/632453093361090560
(2) Realistic Race % 2020 forecast
White 81% / Black 10% / Latino 6% / Asian 1% / Other 2%
(3) Rate Pennsylvania.
1) Party ID %: Favor REP
2) Vote-By-Mail: Let���s see
3) Poll % (adjusted %): Tilt~Lean Trump.
Conclusion) PA: Tilt Trump
4. Ohio
1) Election 2018 Fox News Voter Analysis
Ohio Governor Race 2018. 3,819 Respondents(Voters)
https://www.foxnews.com/midterms-2018/voter-analysis?filter=OH&type=G
Party ID with leaner: REP 48% / DEM 41% / IND 12%
2) Latest Poll
3) Ohio 2020 Forecast
Considering White-Evangelical’s turnout might be higher in Ohio
(1) Party ID%
Based on Voter registration+Fox new voter analysis adjustment+Trends
in 2020 it might be something like
exclude leaners: REP 39% / DEM 31% / IND 30%
with leaners: REP 52% / DEM 41% / IND 7%
TargetSmart Model 10/26. 2,201,511+ Casted ballot(40.1% of 2016 Total)
REP 45.9% DEM 41.7% Other 12.5%. and REP might take leads ED
(2) Rate Ohio
Party ID %: Likely REP
Poll % (adjusted %+ cosindered Libertarian&Green):
Early Voting: heavily favor REP
Conclusion: Likely Trump
* 2016 Results: TRUMP(REP) 51.69% / Hillary(DEM) 43.56%. R +8.13%
II. Other Swing States (AZ/FL/GA/IA/NC/NV/TX)
5. Arizona
1) Arizona Party ID % Statistics
Arizona Voter Registration %
10/28/2016: REP +148,291
10/20/2020: REP +113,896
https://twitter.com/mantlehog/status/1318572169748676608
According to Twitter user Billy Newby
-----------
https://twitter.com/mantlehog/status/1318575045141254144
---------
https://azsos.gov/elections/voter-registration-historical-election-data
Active voters only
(1) August 4, 2020: Total 3,989,214
Rep: 1,389,960(34.84%) Dem 1,293,074(32.41%). R +2.43%
https://azsos.gov/sites/default/files/State_Voter_Reigstration_2020_Primary.pdf
(2) November 6, 2018: Total 3,712,500
Rep: 1,287,831 (34.69%) Dem 1,150,436(30.99%). R +3.7%
https://apps.azsos.gov/election/voterreg/2018-10-01.pdf
(3) October 28, 2016: Total 3,588,466
Rep: 1,239,614(34.54%) Dem 1,091,323(30.41%). R +4.13%
https://apps.azsos.gov/election/voterreg/2016-11-08.pdf
2) Election 2018 Fox News Voter Analysis
Arizona Senate 2018. 3,717 Respondents(Voters)
https://www.foxnews.com/midterms-2018/voter-analysis?filter=AZ&type=S
Despite of White-Evangelical’s Low turnout (Presidential election 2012 Exit Poll 21% vote share, 2018: 13% share. 8% lower than 2012)
Party ID with leaner:
REP 47% Sinema 10% / McSally 89%
DEM 41% Sinema 95% / McSally 4%
IND 12% Sinema 54% / McSally 37%
Trump approval: Approve 49% / Disapprove 51%
3) Latest Poll
(1) Susquehanna Polling & Research Inc. 10/19-10/22. 500 LV.
https://overland.amgreatness.com/app/uploads/2020/10/Toplines-ArizonaStatewide-CFAG-Oct2020.pdf
Poll results: Trump 47% / Biden 46%. Trump +1%
(2) Ipsos 10/14-10/21. 658 LV.
https://statespoll.com/post/632656270366785536
Poll results: Biden 50% / Trump 46%
Adjusted %: Trump 50.8% / Biden 45.9%. Trump +4.9%
4) Arizona 2020 Forecast
Considering White-Evangelical’s turnout might be higher in preisdential year
(1) Party ID%
2018 AZGov Exit Poll(Exclude Leaners):
https://edition.cnn.com/election/2018/exit-polls/arizona
REP 38% / DEM 31% / IND 31%
With Leaners: REP 51% / DEM 42% / IND 7%
Exclude Leaners: REP 40% / DEM 32% / IND 28%
About the details read my analysis Post:
https://statespoll.com/post/632547841755217920
(2) Rate Arizona
Party ID %:
Vote-By-Mail: Current EV in AZ. Trending R(Including Maricopa county)
Favor Trump
Poll % (adjusted %+ cosindered Libertarian&Green): Lean Trump
Voter registration: Considering Turnout(77%ish) Dem narrowed gaps
about 0.3%ish, 2016 was Trump +3.5%.
Trump's 2016 margins 3.5-0.3%= 3.2%
So Arizona Voter registration number is still favor Trump.
Conclusion: Lean Trump
6. Florida
1) Florida Party ID % Statistics
https://dos.myflorida.com/elections/data-statistics/voter-registration-statistics/voter-registration-reportsxlsx/voter-registration-by-party-affiliation/
(1) August 31, 2020: Total 14,065,627
Dem: 5,203,795 (37.0%) / Rep: 5,020,199 (35.69%). D +1.31%
(2) End of 2018: Total 13,396,622
Dem: 4,975,895 (37.14%) / Rep: 4,718,720 (35.22%). D +1.92%
(3) End of 2016: Total 12,959,185
Dem: 4,905,705 (37.86%) / Rep: 4,575,277 (35.31%). D +2.55%
2) Election 2018 Fox News Voter Analysis
Florida Senate Race 2018. 3,717 Respondents(Voters)
https://www.foxnews.com/midterms-2018/voter-analysis?filter=FL&type=S
Party ID with leaner: REP 46% / DEM 42% / IND 14%
3) Latest Poll
(1) FAU, 10/24-10/25. 937 LV.
https://statespoll.com/post/633132642007711744
Poll results: Biden 50% / Trump 48%
Adjusted: Trump 50.96% / Biden 45.07%. Trump +5.89%
(2) Susquehanna(Rep pollster), 10/23-10/25. 400 LV.
https://overland.amgreatness.com/app/uploads/2020/10/Toplines-Florida-CFAG-Oct252020.pdf
Poll results: Trump 49% / Biden 44% / Jorgensen 2%. Trump +5%
(3) Yougov, 10/20-10/23. 1,228 LV.
https://statespoll.com/post/632963089572282369
Poll results: Biden 50% / Trump 48%
Adjusted: Trump 52.6% / Biden 45.3%. Trump +7.3%
4) Florida 2020 Forecast
(1) 2020 Party ID %
Based on Voter registration Trends+Fox new voter analysis adjustment.
+Early Voting(VBM+in person)
2018 FL GOV Exit Poll(Exclude Leaners): REP 38% / DEM 33% /IND 29%
https://edition.cnn.com/election/2018/exit-polls/florida
Exclude leaners: REP 41% / DEM 32% / IND 27%
with leaners: REP 51% / DEM 42% / IND 7%
Details of My FL Party ID model,
Read My Analysis post: https://statespoll.com/post/633155102813847552/
(2) Rate Florida.
Party ID % Trends:(Nov 2016: D +2.5% -> Sept 2020: D +1.3%)
Vote-By-Mail:
Florida VBM+in person mid results (Oct. 13)
https://www.nbcnews.com/politics/2020-elections/florida-results
Mail-in ballots requested: 5,629,666
DEM 45.3% / REP 31.3% / Other 23.4%
Mail-in and early in-person ballots returned: 1,780,584
DEM 50.8% / REP 29.2% / Other 20%
Poll % (adjusted %): Likely Trump
Conclusion: Lean~Likely Trump
* 2016 Results: TRUMP(REP) 49.02% / Hillary(DEM) 47.82%. R +1.2%
7. Nevada
1) Nevada Party ID % Statistics(Active Registered Voters)
https://www.nvsos.gov/sos/elections/voters/voter-registration-statistics
(1) Oct 1, 2020: Total 1,742,477
https://www.nvsos.gov/sos/home/showdocument?id=8998
Dem 654,724 (37.57%) Rep 566,265(32.5%) D+5.07%
(2) Jan 3, 2019: Total 1.582 Million
Dem 607.4k(38.39%) Rep 528.7k(33.42%) D+4.97%
(3) Oct 21, 2016: Total 1,464,819
https://www.nvsos.gov/sos/home/showdocument?id=4518
Dem 577,679(39.44%) Rep 488,861(33.37%) D+6.07%
2) Election 2018 Fox News Voter Analysis
Nevada Senate Race 2018. 3,400 Respondents(Voters)
https://www.foxnews.com/midterms-2018/voter-analysis?filter=NV&type=S
Party ID with leaners: DEM 44% / REP 42% / IND 14%s
3) Latest Poll
(1) NYT/Siena 10/23-10/26, 809 LV.
https://statespoll.com/post/633152355607707648
Poll results: Biden 49% / Trump 43% / Jorgensen 3%
Adjusted %: Biden 49.1% / Trump 47.1% / Jorgensen 1.6%. Biden +2.0%
4) Nevada 2020 Forecast
(1) 2020 Party ID %
Based on Voter registration Trends+Fox new voter analysis adjustment.
exclude leaners: DEM 33% / REP 29% / IND 38%
with leaners: REP 47.5% / DEM 43% / IND 9.5%
(2) Rate Nevada
1) Party ID %:
2) Poll %: Tilt~Lean Biden
3) Vote-By-Mail+in person:
My Analysis Post(Nevada Early Voting):
https://statespoll.com/post/633151892259831808
Conclusion: Tilt Biden
8. Minnesota
1) Election 2018 Fox News Voter Analysis
Minnesota Special Senate Race 2018. 4,201 Respondents(Voters)
https://www.foxnews.com/midterms-2018/voter-analysis?filter=MN&type=S2
(1) Party ID%, Minnesota with leaner, MN Special Sen 2018
with leaners: DEM 46% / REP 40% / IND 14%
2) Latest Poll
(1) Civiqs, 10/17-10/20. 840 LV.
https://statespoll.com/post/632594716317384704
Poll results : Biden 53% / Trump 43%
Adjusted %: Biden 48.96% / Trump 48.64%. Biden +0.32%
(2) Minnesota: KSTP/SurveyUSA 10/16-10/20. 625 LV Smith vs Lewis
https://kstp.com/politics/kstpsurveyusa-smith-lewis-senate-race-now-a-dead-heat-october-21-2020/5901843/?cat=1
Smith 43% / Lewis 42%. Smith +1%
3) Minnesota 2020 Forecast
(1) Party ID %
Voter registration+Fox new voter analysis adjustment+Trends
With Leaner: REP 45% / DEM 44% / IND 11%
Exclude Leaner: REP 38% / DEM 35% / IND 27%
Detials: https://statespoll.com/post/632594716317384704
(2) Rate Minnesota
Poll: Tilt DEM~Lean DEM
3) Vote-By-Mail+in person:
https://targetearly.targetsmart.com/
Last updated Oct. 20
Mail-in and early in-person ballots returned: 936,493
DEM 48.5% / REP 28.9% / IND+OTHER 22.6%
=> OCT 21: DEM 48.0% / REP 29.3% / IND+Other
=> Oct 24: DEM 47.4% / REP 29.9% / IND + Other 22.7%
Poll %: Toss up
Minnesota early voting analysis post:
https://statespoll.com/post/632227687289765888
Conclusion: Toss up
9. North Carolina
1) Party Statistics Trends %
2016 Results: TRUMP 49.83% / Hillary 46.17%
Party registration statistics Trends.
2016->2020 Dem’s margins reduced -3.82%
(1) October 10, 2020: Total 7,242,242
https://vt.ncsbe.gov/RegStat/Results/?date=10%2F10%2F2020
Dem 2,585,688 (35.70%) / Rep 2,185,854 (30.18%). D +5.52%
(2) November, 8th 2016: Total 6,918,150
https://vt.ncsbe.gov/RegStat/Results/?date=11%2F08%2F2016
Dem 2,733,188(39.51%) / Rep 2,086,942(30.17%). D +9.34%
2) Latest Poll
(1) Yougov, 10/20-10/23. 1,022 LV
https://statespoll.com/post/632816505386647552
Poll results : Biden 51% / Trump 47%
Adjusted %: Trump 50.98% / Biden 46.95%. Trump +4.03%
(2) Trafalgar, 10/20-10/22. 1,098 LV
https://drive.google.com/file/d/1F50GhQFuthpATgxIiDqADXjmgk_iNFBm/view
Poll results : Trump 48.8% / Biden 46.0%. Trump +2.8%
(3) Ipsos, 10/14-10/20. 660 LV.
https://statespoll.com/post/632543897604751360
Poll results : Biden 49% / Trump 46%
Adjusted %: Trump 49.8% / Biden 46.8%. Trump +3.0%
(4) Data for Progress, 10/15-10/18. 929 LV.
https://statespoll.com/post/632816505386647552
Poll results : Biden 48% / Trump 44%
Adjusted %: Trump 51.5% / Biden 44.6%. Trump +6.9%
3) North Carolina Forecast
(1) Party ID
Based on Voter registration Trends
VBM+In person(60%) DEM 55.5% / REP 38.5% / IND 6%
EDay(40%) REP 65% DEM 25% IND 10%
My Model(With leaners): REP 51% / DEM 42% / IND7%
exclude leaners: REP 35% / DEM 30% / IND 35%
Details of My NC Party ID Model.(with leaners)
Read my post: https://statespoll.com/post/632543897604751360
(2) Rate NC
Poll % (adjusted %+ cosindered Libertarian&Green): Lean Trump
Party ID % Trends: Favor REP(Nov 2016: D +9.3% -> Oct 2020: D +5.5%)
Current Early voting REP is narrowing gap radically
VBM: favor REP
Conclusion: Lean Trump
10. Georgia
1) Election 2018 Fox News Voter Analysis
Georgia Governor Race 2018. 3,955 Respondents(Voters)
https://www.foxnews.com/midterms-2018/voter-analysis?filter=GA&type=G
Party ID with leaner: REP 48% DEM 41% IND 11%
2) Latest Poll
(1) Civiqs 10/23-10/26, 1,041 LV.
https://statespoll.com/post/633133585426251776
Poll results: Biden 51% / Trump 46%
Adjusted: Trump 51.7% / Biden 46.3%. Tump +5.4%
(2) Yougov 10/20-10/23, 1,090 LV.
https://statespoll.com/post/632961884585426944
Poll results: Trump 48% / Biden 48%
Adjusted: Trump 53.7% / Biden 44.1%. Trump +9.6%
(3) AJC 10/14-10/23, 1,145 LV.
https://statespoll.com/post/633036015536406528
Poll results: Biden 46.5% / Trump 46.2%
Adjusted: Trump 50.85% / Biden 43.4%. Trump +6.45%
(4) Landmark 10/21, 500 LV.
Poll results: Trump 50% / Biden 46%
Notable results: 72% GA White voters are favoring Trump.
3) Georgia 2020 Forecast
Considering White-Evangelical’s turnout might be higher in preisdential year.
(1) Party ID %
Based on foxnews voter analysis adjustment.
exclude leaners: REP 41% / DEM 32% / IND 27%
with leaners: REP 52% / DEM 41% / IND 7%
(2) Rate Georgia
Party ID %: Likely REP
Early Voting: Huge Favor GOP
Poll % (adjusted %+ cosindered Libertarian&Green): Likely Trump
Conclusion: Likely Trump
11. Iowa
1) Election 2018 Fox News Voter Analysis
Iowa Governor Race 2018. 3,955 Respondents(Voters)
https://www.foxnews.com/midterms-2018/voter-analysis?filter=GA&type=G
Despite of White-Evangelical’s Low turnout (Presidential election 2016 Exit Poll 34% vote share, 2018: 23% share. 11% lower than 2016)
Final results: Kim Reynolds(Rep) 50.3% / Fred Hubbell(Dem) 47.5%
Party ID with leaner:
REP 47% Hubbell 11% Reynolds 87%
DEM 36% Hubbell 94% Reynolds 5%
IND 17%
1) Iowa Party ID % Statistics(Active Registered Voters)
https://sos.iowa.gov/elections/voterreg/county.html
(1) September 1, 2020: Total 2,027,777
https://sos.iowa.gov/elections/pdf/VRStatsArchive/2020/CoSept20.pdf
Dem 684,093 (33.73%) Rep 691,239 (34.09%) R +0.36%
(2) November 1, 2016: Total 1,996,153
https://sos.iowa.gov/elections/pdf/VRStatsArchive/2016/CoNov16.pdf
Dem 629,081 (31.51%) Rep 662,167(33.17%) R +1.66%
2) Latest Poll
(1) Emerson, 10/19-10/21. 435 LV.
https://statespoll.com/post/632849562979188736
Poll Results: Trump 48% / Biden 48% (Push undecided)
Adjusted: Trump 51.6% / Biden 44.2%. Trump +7.4%
(2) InsiderAdvantage, 10/18-10/19. 400 LV.
https://statespoll.com/post/632551635927941120
Poll Results: Biden 45.1% / Trump 44.6%
Adjusted: Trump 52.7% / Biden 42.7%. Trump +10%
3) Iowa 2020 Forecast
Considering White-Evangelical’s turnout might be higher in preisdential year.
(1) Party ID
Based on Voter registration Trends+Fox new voter analysis adjustment.
exclude leaners: REP 40% / DEM 30% / IND 30%
with leaners: REP 53% / DEM 36% / IND 11%
(2) Rate Iowa
Party ID %: Likely REP
Poll % (adjusted %+ cosindered Libertarian&Green): Likely Trump
Conclusion: Likely Trump
* 2016 Results: TRUMP(REP) 51.15 / Hillary(DEM) 41.74% R +9.41%
12. Texas
1) Election 2018 Fox News Voter Analysis
Texas Senate Race 2018. 3,747 Respondents(Voters)
https://www.foxnews.com/midterms-2018/voter-analysis?filter=TX&type=S
REP 49% / dem 41% / IND 10%. Final Results: Cruz 50.9% / Beto 48.3%
Current Early Voting numbers.
TargetSmart Model :
10/21/2020 REP 50.3% / DEM 40.9% / IND 8.8%
10/25/2020 REP 51.9% / DEM 38.9% / IND 9.2%
Considering ED might be : REP 52%+ / DEM 39% or less / IND 9%
(2018: R +8% -> 2020: Might be R +13% or more. )
2) Latest Poll
(1) Yougov, 10/13-10/20. 1,000 LV.
https://statespoll.com/post/633051947607490561
Poll Results: Trump 50.0% / Biden 44.7%
Adjusted: Trump 54.1% / Biden 43.87%. Trump +10.23%
III. NH/ME(Semi Blue States ME2/NE2: Swing district)
13. Maine
Maine Governor Race 2018. 2,734 Respondents(Voters)
https://www.foxnews.com/midterms-2018/voter-analysis?filter=ME&type=G
Party ID%(With Leaners): DEM 41% / REP 41% / IND 18%
ME Party ID % Statistics(Active Registered Voters)
https://www.maine.gov/sos/cec/elec/data/index.html
1) ME Party ID % Statistics(Active Registered Voters)
https://www.maine.gov/sos/cec/elec/data/index.html
(1) 7/14/2020: Total 1,063,383
https://www.maine.gov/sos/cec/elec/data/data-pdf/r-e-active.pdf
DEM 386,786(36.4%) / REP 295,122(27.8%). D +8.6%
(2) 11/6/2018: Total 1,054,952
https://www.maine.gov/sos/cec/elec/data/data-pdf/r-e-active1118.pdf
DEM 348,657(33.05%) / REP 287,955(27.3%). D +5.75%
(3) 11/8/2016: Total 1,058,444
https://www.maine.gov/sos/cec/elec/data/r-e-active-11-8-16.pdf
DEM 338,352(32.0%) / REP 285,320(27.0%). D +5.0%
2) Maine 2020 Forecast
ME-2: Lean Trump
My Post(ME-2): https://statespoll.com/post/632560185693618176
ME-1: Solid Biden. ME(Statewide): Nearly Solid Biden.
14. NE-2 District
Current Early Voting TargetSmart Model:
10/27 DEM 48.7% / REP 45.3% / IND 6.0%
*FYI 2016 EV(58,667 Votes): DEM 52.5% / REP 42.0% / IND 5.6%
I guess in the end, with Election Day: REP 51% / DEM 42% / IND 7%
Conclusion: Tilt~Lean Trump
0 notes
Last Seen Blogs

lonex-wolf
25 | Suicidal

keiko113
Keiko113 ~ Graph / Création

voteforponton
vote for ponton

juanpesnaps
juanpesnaps

jamesdocuments-blog
Untitled