#wastewater is the ONLY metric we have left
Text
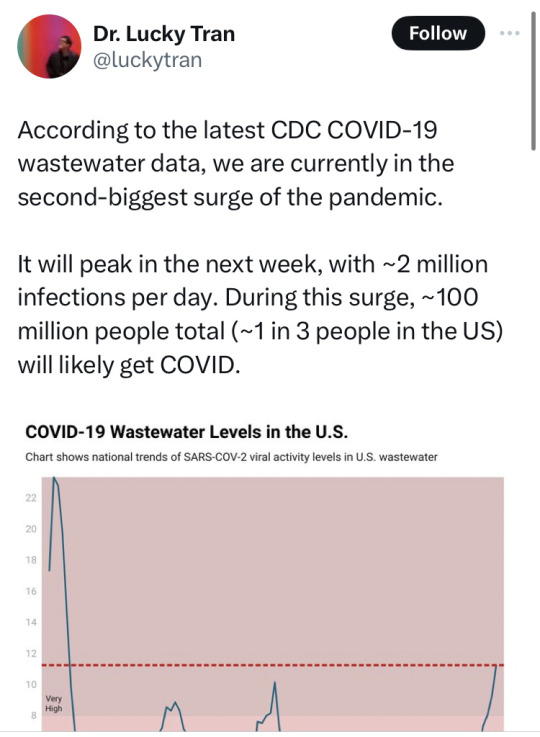
y’all do NOT go out next week unless you have to and wear your best masks and tape the edges down bc it’s just not worth it
#Canada is possibly worse than the US#hard to check bc our government won’t even track anymore#I wasn’t even able to report getting COVID to like anywhere#wastewater is the ONLY metric we have left#please take this seriously
18K notes
·
View notes
Text
The Weather
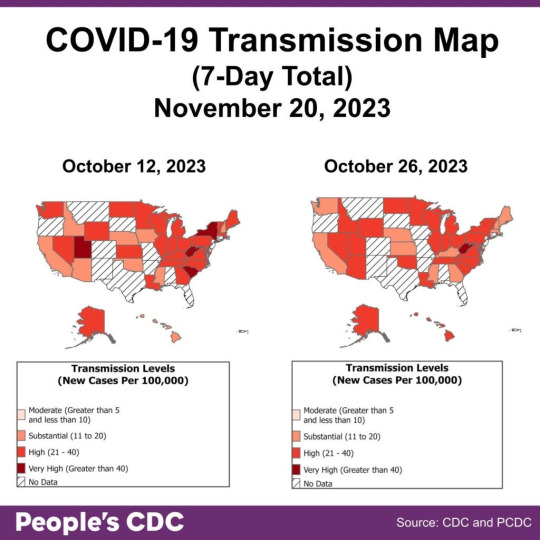
The CDC ended their national US COVID community-level transmission map in May. We created this map to document 7-day cumulative COVID rates based on laboratory-confirmed COVID cases in states that are still tracking and reporting. Obviously, this map cannot be relied upon to give accurate information about transmission risk because only a fraction of COVID cases are actually counted. Still, it provides us a visual reminder that the COVID pandemic is not over. You can read more about our map and methods here.
Wastewater
The wastewater monitoring landscape is in flux! We remind you that you should find the most local source of wastewater for you, and use that as your best source of pandemic monitoring. You might find your city or one nearby on Biobot’s website. Scroll to the bottom and click the “SHOW ALL” button.
You can also check out WastewaterSCAN. You will see two boxes next to the words “Local Data Near.” Put your zip code in one, and select the Sars-CoV-2 for the second box. Then, you’ll see the company’s assessment of your risk level.
The image below is the resulting risk level for 48081, a zip code in Macomb County, Michigan.

If you’re wanting a graph to compare current wastewater levels to previous periods of time, click “DASHBOARD” on the upper right hand corner of the site. A US map will come up with a search bar at the top of it. Put your zip code into the map or scroll into the nearest wastewater site manually. When you click on the purple dot representing your nearest monitoring site, you’ll see a panel on the left titled “Overview for [CITY, STATE].” On the upper right hand side of that panel, there is a purple arrow. Click it. Then you can see trends. “Last 3 months” is the default period of time, but you can change the period of time you’re looking at by clicking the down arrow and selecting a different range.
The image below shows a local graph for the wastewater site nearest that same Michigan zip code.

Below is the graph for national wastewater data. Your local data will likely differ from national trends, so it is best to look up the wastewater site nearest you.

Wins
We are heartened to see masks at protests throughout the country. Whether it’s #StopCopCity actions to oppose further militarization of police in this country or marches, die-ins, and disruptions to oppose occupation and genocide in Palestine, people see that we can demand and create another world together, and that we can keep each other safe while we do it.
Long COVID
A recent study has been published that is relevant for those considering taking nirmatrelvir (Paxlovid) or molnupiravir (Lagevrio) to reduce the risk of Long COVID. This study of Medicare enrollees, published in JAMA Internal Medicine, found that nirmatrelvir and molnupiravir were associated with a small reduction in the incidence of Long COVID.
On repeat infections, Nature Communications published a cohort study done in Spain and the UK comparing COVID cases, reinfections, and negative-test controls which demonstrated that reinfections had a higher risk of Long COVID. This is a big deal– it builds on the growing literature demonstrating the dangers of repeat infections, pointing again to the importance of taking this pandemic seriously and avoiding infection, as many times as we can.
Take Action
Sign NNU’s letter urging the CDC “to reject HICPAC’s weak draft and create a new one that protects health care workers and their patients!”
And check out this piece published in JAMA this week arguing that physicians, hospital administrators, and regulators have an ethical obligation to protect patients through masking.
Safer Gatherings
It’s that time of year again! Please ensure your holiday gatherings are as safe as possible by implementing as many layers of protection as you can!

On that note, we will not be publishing a Weather Report next week, because our team will be dedicating our time to revamping our current Safer Gathering Toolkit instead! We look forward to sharing with you soon!
#op#img#described in alt text#covid#covid pandemic#covid news#covid 19#covid19#covid-19#coronavirus#pandemic#sars cov 2#sars-cov-2#long covid#pcdc#people's cdc#medical#medical news#coronavirus pandemic
9 notes
·
View notes
Photo


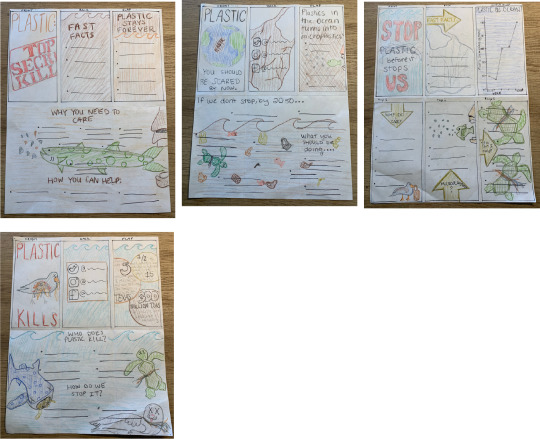
PLASTIC POLLUTION PROCESS BLOG
Proposal:

Research & Citations
How to stop the problem:
Shop with reusable bags. Switching to reusable will reduce your overall waste and keep sealife from harm.
Ask for no straw when ordering drinks and carry a collapsible one.
Sea Save Foundation actively seeks to change legislation by rallying constituents to contact their local representatives to sponsor or reject bills that have an impact on marine plastic pollution.
Photography and video documenting ocean pollution problems is in demand. Images can help tell stories and stand witness to the detrimental effects plastic pollution has on our ocean environments.
Donate to “Ocean Cleanup Project”- aims to clean half the Great Pacific Garbage Patch in a decade.
Dr. Chris Sherrington, principal consultant at Eunomia Research and Consulting, said that beach cleanups are one of the best ways to fight ocean plastic.
Support policies on cutting plastic use, like taxes on everyday plastic items and recycling incentives.
PREVENTION IS BETTER THAN A CURE
While some may have been dropped directly, and other plastics may have been washed up, there is a "flux" of litter between beaches and the sea. By removing beach litter, we are therefore cleaning the oceans.
Global Citizen campaigns on the Global Goals, which call for universal access to clean water and healthy environments. You can take action on these issues here: https://www.globalcitizen.org/en/take-action/
Lonely Whale launched a campaign with the ultimate goals of preventing 500 million straws from getting into the ocean sin 2017. They are getting restaurants, bars, sports stadiums, brands, etc to limit their use of straws and switch to sustainable alternatives. Called “#StopSucking”
#StopSucking is also getting individuals to pledge a plastic straw-free life.
You can use bamboo, paper, steel, rubber, or even glass straws.
What the problem is:
100,000 marine animals are killed by plastic bags each year.
By 2050, oceans will carry more plastic mass than fish
an estimated 99% of seabirds will have ingested plastic by 2050
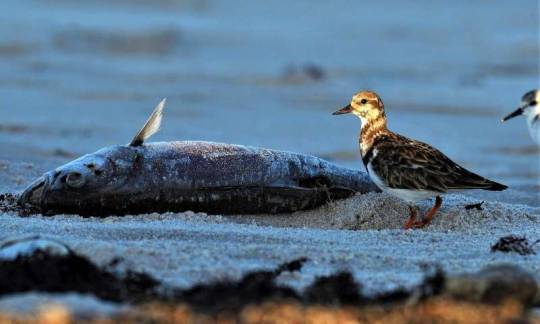
Plastic waste kills up to 1 million sea birds, 100,000 sea mammals, marine turtles and countless fish each year
80% of all pollution in oceans comes from land-based activities
Half of all plastics ever manufactured have been in THE LAST 15 YEARS
Nearly every species of seabird eats plastic
700 species have been affected by plastics
There are 5 massive patches of plastic in the world’s oceans.
The largest garbage patch is the size of Texas
A garbage truck of plastic is dumped into the ocean every minute.
If this continues, 12 billion metric tons of plastic waste will exist in the world by 2050
Corals that come into contact with plastic have an 89% chance of contracting disease, compared to corals that don’t: 4%
Global plastic production has quadrupled in the past 40 years
Of the 300 million tons of plastic that is produced annually, 50% is single-use plastics
A microplastic particle is smaller than 5 millimeters and is only visible under microscope
The average person consumes 70,000 microplastics each year, according to Environmental Pollution
Of the tested tap water worldwide, 83% is polluted with microplastic fibers
These microparticulates then end up in freshwater lakes, rivers, municipal treatment plants, and ultimately tap water. These sources affect not only our oceans, lakes, and springs, but the life of organisms that inhabit them.
Research at the State University of New York at Fredonia showed that 93% of tested bottled water had microplastics contamination
Unfortunately, microplastics are not being detected in water purification systems, so they can come from the tap water sources as well as being created from the machinery during the bottling process.
This presents a potential liability risk for beverage companies who are just now exploring how best to measure microplastics in their products.
The microplastics then enter the food chain as organisms consume them, transferring these toxins into their bodies. These toxins translocate up the food chain until they are served on our plates.
The consequences of toxin-sorbed microplastics ingested by fish can be two fold; exposure can be physical, causing tissue damage, or they can be chemical, resulting in bioaccumulation that causes liver toxicity.
A 2018 study in the journal Environmental Pollution concluded that people were more likely to ingest plastic through dust in their environment than by eating shellfish
Microplastics have been found in 90% of table salt, according to a study published in the journal Environmental Science & Technology. An average adult consumes approximately 2,000 microplastics per year through salt
American use 200 billion plastic bags a year, which require 12 million barrels of oil to manufacture
Plastic bags are used for an average of 12 minutes but take 1000 years to degrade in a landfill
According to Waste Management, only 1% of plastic bags are returned for recycling. That means an average family only recycles 15 bags a year, while the rest end up in landfills.
80% of all liter in our oceans is made of plastic.
According to the 2017 report from the United Nations Marine Conference, as many as 51 trillion microplastic particles litter our oceans and seas, which is 500 times more than the stars in our galaxy
Plastic does not break down organically like other waste- it turns into plastic microfibers
Eunomia Research & Consulting firm calculated that emissions of microplastics range from 0.5 to 1.4 million tonnes per year, with a mid-point estimate of 0.95 million tonnes. Vehicle tires are the biggest culprits, releasing 270 thousand tonnes of debris into our waterways annually.
Microplastics are also very absorbent, meaning they pick up the chemicals it floats in,,, which then travels up the foodchain.
“Despite the high profile of projects intended to clean up plastics floating in mid-ocean, relatively little actually ends up there. Barely 1% of marine plastics are found floating at or near the ocean surface, with an average global concentration of less than 1kg/km2. This concentration increases at certain mid-ocean locations, with the highest concentration recorded in the North Pacific Gyre at 18kg/km2.”
An estimated 4.8 million to 12.7 million metric tons of plastic waste enters the ocean every year
In a study where they looked at the layers of sand in Santa Barbara Basin, plastic sediments were found in layers before the year 1945, before plastic polymers were produced in high quantities or even widely used.
Humans have created 8.3 billion metric tons of plastic since 1950, a weight equivalent to 1 billion elephants.
More than 75% of this plastic has been thrown away, left to disintegrate throughout the global environment.
The country with the highest level of plastic contamination was the US, with 94% of taps containing traces of plastic.
The average US sample contained 4.8 fibers of plastic, compared to an average of 1.9 fibers in Europe.
That means that with nearly every cup of water, Americans are ingesting plastic fibers.
Microplastics are also getting swept up by the wind and falling from the sky, filling the air humans breathe, covering crops, and entering sources of waters.
In Paris, a team of researchers in 2015 estimated that 10 tons of plastic fibers fell from the sky each year and even entered people’s homes.
Straws might seem like a trivial place to start — but the US alone consumes 500 million straws each day
Straws are often mistaken for food by marine life, which, when swallowed, can cause injury or even death.
Sources:
“83% Of All Tap Water Around the World Has Plastic Fibers In It.” Global Citizen, www.globalcitizen.org/en/content/tap-water-contains-plastic-fibers/.
Brandon, Jennifer A., et al. “Multidecadal Increase in Plastic Particles in Coastal Ocean Sediments.” Science Advances, vol. 5, no. 9, 2019, doi:10.1126/sciadv.aax0587.
Catarino, Ana I., et al. “Low Levels of Microplastics (MP) in Wild Mussels Indicate That MP Ingestion by Humans Is Minimal Compared to Exposure via Household Fibres Fallout during a Meal.” Environmental Pollution, vol. 237, 2018, pp. 675–684., doi:10.1016/j.envpol.2018.02.069.
Chow, Lorraine. “80% Of Ocean Plastic Comes From Land-Based Sources, New Report Finds.” EcoWatch, EcoWatch, 29 June 2016, www.ecowatch.com/80-of-ocean-plastic-comes-from-land-based-sources-new-report-finds-1891173457.html.
“Help Save the Oceans With These 7 Alternatives to Plastic Straws.” Global Citizen, www.globalcitizen.org/en/content/alternatives-to-plastic-straws-eco-friendly/.
Lamb, Joleah B., et al. “Plastic Waste Associated with Disease on Coral Reefs.” Science, American Association for the Advancement of Science, 26 Jan. 2018, science.sciencemag.org/content/359/6374/460.
“Method Development for Microplastic Analysis in Wastewater.” Microplastics in Water and Wastewater, 2019, pp. 63–83., doi:10.2166/9781789060034_0063.
“Plastic Is Having a Profound Effect on Our Ocean.” Footprint Foundation, footprintusfoundation.org/plastic-pollution/?gclid=Cj0KCQjwpdqDBhCSARIsAEUJ0hN_WxN1D_ICinlRonBa58xxCDogxKW2Scc9jtZy07Qb_U9lOMSy6LAaAkVFEALw_wcB.
“Plastics 101: How to Stop Plastic Pollution in the Ocean.” Plastic Tides, 9 Nov. 2020, www.plastictides.org/plastics101/?gclid=Cj0KCQjwpdqDBhCSARIsAEUJ0hMVKdh_Er1viak6lOGF_DddbpMlEIDMIrAqVaMyjztZCG_PiocZ01kaAmp_EALw_wcB.
“Why We Care.” Sea Save, 16 Nov. 2020, seasave.org/plastic-pollution/.
0 notes
Text
Lake Erie provides drinking water for more people than any other, but algae blooms are making it toxic
https://sciencespies.com/environment/lake-erie-provides-drinking-water-for-more-people-than-any-other-but-algae-blooms-are-making-it-toxic/
Lake Erie provides drinking water for more people than any other, but algae blooms are making it toxic
Credit: CC0 Public Domain
Every year, an explosion of microscopic life reigns over western Lake Erie, forming a green slick of algae and bacteria so massive and vibrant that it can be seen from space.
The harmful algae bloom slimes fishing boats, paints beaches in toxins and engulfs water intake cribs. In 2014, it left 400,000 people without drinking water for three days after toxins infiltrated Toledo’s water system. Then-Gov. John Kasich declared a state of emergency and called in the National Guard to distribute bottled water in an incident that served notice that drinking water from Lake Erie was in peril.
This year, the bloom was among the most severe and toxic since scientists began keeping track in the early 2000s. At its peak, it coated around 620 square miles of Lake Erie’s surface waters, an area more than twice the size of Chicago, according to satellite imagery. The sheer weight of blue-green bacteria making up the bloom—forecast to be around 46,000 metric tons—was expected to be a new record.
“If you did a Google image search for “Toledo water,” what would pop up is the Toledo skyline where the Maumee River looks like the Chicago River on (St. Patrick’s Day),” Mayor Wade Kapszukiewicz said. “The only difference is we didn’t put any dye in it.”
Climate change is jeopardizing two of the most precious resources the Midwest possesses: food and water, according to federal studies. Greater rainfall and more powerful storms are eroding some of the richest soils in the United States and, in doing so, washing bloom-inducing fertilizers from farm fields into Lake Erie. More frequent torrential downpours are also overpowering antiquated sewer systems at times, releasing a profusion of raw sewage into waterways, further polluting and degrading water quality.
Meanwhile, warmer temperatures are allowing the microbes within algae blooms—particularly the toxin-producing bacteria—to flourish in greater numbers and for more months of the year, posing elevated and prolonged risks to drinking water, wildlife and the $15.1 billion tourism industry along Ohio’s coastline.
The Great Lakes are all connected and collectively hold 20% of the world’s fresh surface water, but each lake has unique features—depth, shape, size and surroundings—making them vulnerable to different aspects of climate change.
Algae blooms occur annually across the region in shallow, sheltered waters like Saginaw Bay in Lake Huron and Green Bay in Lake Michigan. A large algae bloom even developed once in the normally pristine waters of Lake Superior near the Apostle Islands, a harbinger that no environment is immune.
The danger is most acute in Lake Erie—the shallowest, southernmost and warmest of the Great Lakes—which is a natural incubator for these colonies of microorganisms.
While countries across the globe face drought and water insecurity, it’s a bitter irony that some communities sitting on the edge of the planet’s largest system of freshwater—more than 11 million people depend on Lake Erie for drinking water—are compelled to buy bottled water.
“As population explodes, water is going to be the most valuable resource on planet Earth by the end of this century. It therefore represents the greatest advantage that this part of the country has. This region—the Great Lakes region, the Snow Belt, the Rust Belt, whatever you want to call it—has faced hard times over the last 50-60 years,” Kapszukiewicz said. “But … if we can hold on, we may be the most valuable part of the country. Frankly, with what we have, (the Midwest) could be Saudi Arabia in 100 years. We just can’t squander it.”
Billions of dollars have been spent monitoring Lake Erie’s water quality, overhauling drinking water treatment and reducing sewage outflows. But the biggest contributor to these blooms—agricultural runoff, which is responsible for up to 89% of the phosphorus flowing into Lake Erie—remains largely unregulated.
“The amount of manure from pigs, chickens and cows that goes into the western basin, that seeps untreated directly into Lake Erie, is roughly equivalent to all human waste from the cities of Chicago and Los Angeles combined,” Kapszukiewicz said. “That’s just how much animal manure is going in untreated—I’m not even talking about what they spray on crops. This is why we’re living in the world we’re living in.”
The 1,500 square miles surrounding the Maumee River was once known as the Great Black Swamp, a marshland that fostered a wealth of wildlife and naturally filtered nutrients through plant roots.
When European settlers arrived in northwest Ohio in the early 1800s, they gradually drained the swamp, converting it to farmland and introducing the livestock that would produce a concentrated source of manure. Nearby cities boomed in size, not only pumping their own sewage waste into the rivers, but also adding in phosphate laundry detergents before they were banned nationwide in 1994.
In the ’60s and ’70s, Lake Erie was so rife with nutrient pollution it was declared “dead.” Under the Clean Water Act, implemented in 1972, the U.S. cracked down on municipal wastewater treatment facilities, industrial polluters and other contributors. And, for a while, the algae blooms subsided.
In the past two decades, however, the blooms have returned as large as ever.
Scientists say Lake Erie has endured harmful algae blooms historically, but the modern-day magnitude is believed to be increasing as a result of human activities and climate change.
Each year, as melting winter snowpack and spring rains cascade over the rural landscape of northwestern Ohio, a torrent of water flushes an unfathomable amount of manure and commercial fertilizer from farm fields into the Maumee River, a 137-mile waterway carrying waste from Fort Wayne, Indiana, to Toledo, and eventually flowing into the shallowest end of Erie. Meanwhile, throughout the year, Detroit routinely pumps wastewater and sewage into its namesake river, as do other major metros.
These rivers become fuses as fecal-laden waters plunge into western Lake Erie. Nutrients—particularly phosphorus—trigger an eruption of microscopic algae, according to Chris Winslow, director of the Ohio Sea Grant, a research and education collaborative led by Ohio State University.
Just as humans need vitamins to grow, so does algae. Iron, potassium and nitrogen are essential and available in ample amounts. Human and animal excrement contain the missing ingredient: phosphorus.
“You bump up the phosphorus, and they are just waiting to capitalize off of it,” Winslow said.
An analysis of aerial photographs and state permit data identified 775 hog, cattle, dairy and poultry operations in the Maumee River watershed in Ohio, Indiana and Michigan in 2018—a 42% increase since 2005, according to a report by the Environmental Law and Policy Center and the Environmental Working Group, nonprofit advocacy groups. Of the large-scale “factory farms” in the watershed, more than a quarter had expanded since being built. Although the Maumee only contributes 5% of the water entering Lake Erie, it is so loaded with phosphorus that it is the main driver of the algae blooms.
The most potent form of phosphorus, unblended with soils, acts as a catalyst for blooms each year. The amount of this full-strength phosphorus has increased 140% since 1990. Some experts suspect this can be attributed to a change in farming practices, namely no-till farming—a technique intended to curb soil erosion, but one in which layers of manure piled on top of farmland are more easily carried away by heavy rains.
Winslow said other factors are also at play.
“We have zebra mussels in our lake filtering the water differently than 40 years ago,” he said. “We have larger farm operations. We have increased rainfall and runoff to take nutrients from the land into the water. We have warmer temperatures, and these organisms like warmer temperatures. Some of these things have more of an impact than others, but there’s a lot of moving parts.”
This fall, the Ohio countryside was a desolate mud pit marked by rampant weeds, standing water and stunted crops.
Over 880,000 acres intended for corn and nearly 600,000 acres for soybeans were left barren this year, as farmers opted to take insurance money rather than risk a meager harvest.
Ty Higgins, spokesman for the Ohio Farm Bureau, described rural Ohio this fall as the “end of the world.”
Farmers, he said, can use drought-resistant corn. They can plant strains that perform better in heat. But there’s no silver bullet for rain.
“That’s one curveball Mother Nature can throw farmers that they don’t have a workaround,” Higgins said.
Climatologists say the region has become soggier.
A spike in greenhouse gases, largely from man-made carbon emissions, has driven global temperatures upward, according to the National Oceanic and Atmospheric Administration. For every degree of warming, the atmosphere can hold 4% more moisture, which can translate into heavier and more severe downpours.
Since 1951, the Great Lakes region has seen a 2.3 degree rise in temperatures, a 14% uptick in annual precipitation and a 35% increase in the most intense storms. In the past year, the rain, snow and flooding across the Midwest was one for the record books.
Between September 2018 and August 2019, the Buckeye State endured the wettest 12 months on record since NOAA began keeping precipitation statistics in 1895.
Chris Weaver, 45, of Lyons, was one of the few who decided to plant this year—not that he had much of a choice. His family-owned dairy peddles three commodities: milk, meat and manure. With 3,000 cows on one farm in Williams County, his employees work around the clock corralling cattle into milking stalls. He depends on 5,000 acres of cropland for feed.
And each fall, Weaver draws from a manure pond the size of a football field to fertilize his land.
Manure, some might argue, is the greatest commodity for farmers with livestock. Not only does it benefit crop growth, the excess can be sold. Weaver charges about $400 to cover an acre.
“Grandpa always told me, “It smells like money to me,”” said Higgins, the farm bureau spokesman.
In the fall of 2018, because of the onslaught of rain, most farmers didn’t get a chance to put fertilizer down. Those who did witnessed that money carried downstream in this year’s spring rains.
It wasn’t until July 1, about two months later than normal, that Weaver was able to get most of his corn, soybean and alfalfa crops in the ground. Weaver had some reserves to feed his cattle but not enough to make it a whole year without a harvest.
He was still anxiously monitoring the weather throughout the fall, praying there wouldn’t be an early frost. He managed to reap his corn by mid-October while his soybeans withstood several inches of snow in November. The harvest, he said, would be enough to make it without buying reserves.
“It has to be a one-off,” Weaver said, almost as if trying to convince himself. “We’ve had a lot of wetter years. But if it happens again next year, I’m going to really be scratching my head about what I’m doing.
“It’s hard to imagine,” he said, with his voice trailing off. If July 1 became the start of planting season, “I don’t think we’d ever have corn here ever again.”
In addition to sweeping manure and commercial fertilizer into waterways, the rain turns soil into claylike mud that prevents oxygen from reaching crop roots, killing the plants. Soggy soil also makes the land harder to tend, because large farms require heavy machinery, including tractors, prone to getting stuck in the muck.
Some farmers plant cover crops, such as peas and oats, in the fall to help absorb moisture from saturated soils and hold the nutrients from fertilizer in place. The problem is, these crops don’t offer much of a return on investment. And, at the end of the day, farming is a business.
Weaver, however, sees other benefits beyond the monetary value. His in-laws live in the Toledo area and go camping each year near the lakeshore. It’s also where he goes walleye fishing.
“Overall it’s something where maybe I’m breaking even, but I’m doing something to help the environment,” Weaver said. “I think every farmer is recognizing that (cities like Toledo) are affected, that they have to do better.
“We’re only an hour from Lake Erie, so it’s our backyard too.”
But Weaver is in the minority. According to the U.S. Department of Agriculture, cover crops were used on less than 10% of cropland in Ohio in 2017.
Downstream, the Toledo area braces each year for verdant, bacteria-choked waters, no-swim advisories at beaches and noxious odors from scummy bays.
The morning of Saturday, Aug. 2, 2014, Crystal Jankowski, nearly nine months pregnant, awoke before dawn and noticed a number of missed calls from family members. Jankowski, whose father was ailing from liver and kidney failure, feared grim news about his condition.
Instead, Jankowski was jolted by ominous instructions from her mother: “Tell Josh to go find water—now! There’s something wrong with the water.”
More than 400,000 people and hundreds of businesses adjacent to the world’s 13th largest lake suddenly found themselves without potable water.
The culprit was Microcystis aeruginosa, a blue-green cyanobacteria known to create a toxin more lethal than cyanide or antifreeze. Its poison, which can cause liver failure, was so efficient at killing animals that scientists originally termed it “fast death factor.” In one of the most deadly episodes, more than 50 people died in Brazil in 1996 when hospital patients were exposed to unfiltered water containing the toxin. Scientists say no deaths attributed to these toxins have been reported in the U.S.
In Toledo, the bloom had drifted from Maumee Bay and engulfed the city’s water intake 3 miles offshore and then stalled, leaving the neon green bloom to linger for days.
At the treatment plant, a lab test showed an alarming result: The drinking water had been compromised.
Following the historic shutdown, Ohioans went on a maddening search for water, many crossing state lines.
Josh Jankowski moved through the crush of people rummaging barren grocery store aisles. Nearly three hours later, he returned with a package of baby wipes and a bottle of Pedialyte.
Not long after that, Crystal Jankowski began having contractions. The couple rushed to the hospital, where the emergency room was abnormally busy for a Saturday morning.
“Everyone thought they were sick. They had woken up, drank their coffee, took a shower. And then the morning news told people not to drink the water, and, if you did, here are the symptoms,” she said.
Nurses told Crystal Jankowski to go home. She wasn’t ready to give birth, but even if she had been, the hospital was not accepting some patients for surgery because it didn’t have access to sterile water.
“It was just scary. Nothing prepared you for this,” she said.
The National Guard arrived to distribute one case of water per family, but fights broke out in the parking lot. Social media was filled with people describing futile searches for water.
“It brought out the best and worst of human nature at the same time,” Kapszukiewicz, the mayor, said. “There was a lot of generosity: neighbors helping neighbors, a sort of charitable spirit, a lot of volunteerism. But it also produced a sort of ghoulish (behavior). Convenience stores were quickly out of water all of a sudden. The price of bottled water spiked unnaturally at other stores. It was a traumatic event for the community, and five years later we’re still dealing with the aftershocks of it.”
With her contractions still far apart, Crystal Jankowski and her husband drove 40 miles to a friend’s house and filled coolers, jugs and other containers with water.
They delivered them to friends and family members, then Josh Jankowski boiled some water and drew his wife a lukewarm bath. Both went to sleep hoping the crisis would be resolved before their daughter was due.
The next afternoon, moments before Crystal Jankowski returned to the hospital, Toledo officials announced the drinking water was safe.
But even after 12 hours of labor and complications from bleeding, the water was still foremost in Crystal Jankowski’s mind.
“I was a big bubble of paranoia,” Crystal Jankowski, 31, said. “All these things were going through my head. Did the doctor wash his hands with old water? Are they covered in toxins now? I wasn’t intending to breastfeed, but I did. Because you need to mix the formula with water, and I didn’t know where they were getting their water.
“As a mom, it makes me want to cry,” Jankowski said, her voice quavering with emotion. “Every mother should enjoy the first time they hold their child. They shouldn’t be stressing about whether there are toxins in the water.”
Lake Erie’s noteworthy green tinge is the result of a medley of algae and bacteria. Phytoplankton, a microscopic green algae, is food for small organisms. Cyanobacteria, sometimes called blue-green algae, is actually an aquatic bacteria that captures sunlight for energy and produces oxygen like regular algae, but some also produce toxins that are harmful to humans and animals.
Microcystis aeruginosa is the most prevalent cyanobacteria found in Lake Erie. But it is just one of roughly a dozen that have collectively staked a larger claim since the introduction of invasive zebra and quagga mussels in the 1980s.
The fingernail-size shellfish filter copious amounts of water, ravenously eating the beneficial green algae and plankton that feed fish. The mussels don’t consume the cyanobacteria, which, in turn, allows it to increasingly dominate the bloom.
While every type of cyanobacteria doesn’t create toxins, it’s clear that Lake Erie’s annual bloom is becoming progressively more toxic. Since 2014, federal, state and local agencies have conducted routine water sampling for toxins, with 2019 being among the years when it was most severe.
Scientists are continuing to find new harmful substances produced by cyanobacteria, though they don’t fully understand why these bacteria secrete them.
Researchers have theories. Some believe the cyanobacteria are producing toxins to kill a perceived competitor. Others believe that the bacteria cells produce toxins as nourishment when they are stressed. There is also evidence that links toxin production to the levels of nitrogen (an abundant nutrient also found in excrement) in the water.
No matter the reason, residents of Toledo remain on high alert.
Since the crisis, the Jankowskis store more than a dozen jugs of water in the basement. They’ve had a $3,000 water filtration system installed for their shower and sinks. And they don’t drink from the tap.
Mayor Kapszukiewicz is trying to erase these kinds of fears. Elected three years after the water crisis, he tries to drink tap water in public whenever possible. He kept the pressure on suburban communities that threatened to bolt the Toledo water system, which would have been a significant financial loss for the city. And his administration created an online dashboard showing the safety of drinking water that he intends to retire because it has never dropped below the “Safe” threshold.
There are no federal regulations on the amount of cyanobacteria toxins that can be in drinking water. But, in the aftermath of August 2014, the Collins Park water treatment plant quadrupled its capacity for carbon activated powder and chlorine, chemicals used to remove these toxins.
Toledo also accelerated the construction timeline for a new form of water treatment using ozone, a technique that is much more efficient at destroying cyanobacteria toxins. Since the 2014 crisis, the city has also vowed to find an alternative water source.
Before 2014, it could take as long as 12 hours to get test results on water quality. Now, a network of buoys is the first line of defense and produces results almost immediately.
The buoys are equipped with underwater cameras that measure cloudiness and pigment, which signals the severity of the bloom and toxins, according to Ed Verhamme, a coastal engineer for LimnoTech, an environmental consulting firm.
“An entire day can go by and you only have an opportunity to look at two samples,” Verhamme said, referring to the former testing method. “That’s why buoys are so important because every 10 minutes they give you a proxy for intensity of the bloom.”
Applying chlorine, a chemical commonly used in water treatment, to water with large amounts of organic matter like algae can result in disinfection byproducts. The long-term health implications from consuming these substances are unclear. Research has linked some to an increased risk of certain cancers and miscarriage.
The new treatment is scheduled to go online August 2020 and should curb the amount of these incidental byproducts.
The adjustments that have been made and overhauls to come are unlikely to change things for Markie Miller, an activist for Toledoans for Safe Water, who has lived near Lake Erie her entire life. In the five years since the water ban, Miller, 30, said every summer is marked by caution and paranoia.
At the height of harmful algae blooms, many people will only drink bottled water. Drinking Toledo tap water has been compared to swallowing swimming pool water because of the pungent taste of residual chlorine. At local restaurants, complimentary glasses of water go untouched. Many of Miller’s friends don’t order coffee or other beverages that might require tap water as the base. And when using her Brita water filter, Miller sometimes will pour out an entire pitcher because she thinks the purified water still has a strange taste.
Even after amassing an encyclopedic knowledge of local water issues, Miller sometimes finds it hard to distinguish between a justifiable concern and a manifestation of her fears.
“The people at the water treatment plant are always ready to tell you that they are ready with an arsenal of chemicals, that we’re prepared for another 2014. But I’m like, is this just as bad as ingesting toxins? Is it worse? I don’t know. It does make you nervous,” Miller said. “I’ve done dishes to the point where my hands turn red, and I stop and think, “Is this all in my head? Am I freaking myself out because I know too much about this?” After a while, it gets to you.”
But this mindset is ingrained in local culture. At the height of summer, when most coastal communities flock to the beach, the beaches in western Lake Erie are deserted.
Many coastal areas are marked by signs with ominous advice: “Avoid swallowing lake water.” In some instances, the state Department of Health ordered people not to even touch the water, given certain levels of toxins can cause rashes and burns.
“I know growing up here in this area every year, we would go up north to enjoy the beach in Lake Huron. It wasn’t until I reached adulthood that I realized how close we lived to Lake Erie or that it was our source of drinking water,” Miller said.
“When people say they’re going to the beach, your first response is “Well, where are you going?””
The algae blooms have even become popularized in a green beer, “Alegae Bloom,” served in a can with comic book-like art depicting a green swamp creature emerging from the water.
This year, on the fifth anniversary of the water crisis, Miller and other activists went to Maumee Bay State Park. The weather was beautiful. It was sunny and bright. But the water was a radiant green, and there was nobody at the beach.
Other communities should take heed of what is occurring in Lake Erie, environmentalists say. These same cyanobacteria capable of creating toxins are found in ponds, rivers, lakes and oceans across the world—and with climate change, conditions are more conducive to their growth.
“In general, many of us have the view that these organisms can be world travelers,” said Greg Dick, a researcher at the University of Michigan who studies cyanobacteria. “They can travel across continents. There is some evidence they can be aerosolized in little droplets and clouds. They can get up in the jet stream.
“We have this saying when it comes to microbes: Everything is everywhere, and then the environment selects.”
The southern end of Lake Michigan is an unlikely home for sizable blooms, due in part to the reversing of the Chicago River, a historic feat that sends much of Chicago’s waste into the Mississippi River basin, contributing to the bloom in the Gulf of Mexico instead of Lake Michigan.
Treating for toxins is a palliative approach, according to environmental advocates.
The broader issue with algae and bacteria blooms traces to phosphorus pollution. Since 2011, former Gov. Kasich spent more than $3 billion on Erie’s algae blooms, most of which went toward curbing sewage overflows from wastewater treatment plants and upgrading drinking water facilities.
However, in any given year, urban and suburban wastewater only contributes about 9% of the phosphorus flowing into western Lake Erie, at most. These wastewater treatment plants are regulated by the Clean Water Act, and Detroit’s—the watershed’s largest—has curtailed its phosphorus pollution by more than 51% since 2008.
Agricultural runoff, on the other hand, is responsible for as much as 89% and is not regulated under the Clean Water Act. In 2015, the Great Lakes Water Quality Agreement, a binational pact between the U.S. and Canada, established a goal of slashing phosphorus pollution into western Erie by 20% by 2020, a mark that experts say will surely be missed.
Ohio’s Republican-controlled state legislature has prohibited farmers from spreading manure under certain conditions, such as ahead of a rain forecast or when soil is too saturated. Farmers who want to fertilize more than 50 acres are also required to be certified on best practices. But the majority of legislative and executive proposals have been voluntary.
Higgins, the farm bureau spokesman, said it would be rash to implement stricter regulations for farmers.
“Every farmer is different,” he said. “Whether it’s their soil type, their topography, their equipment—it’s not a one-size-fits-all solution. That would be easy if we just said, “Every farmer do this.” There’s 50 different ways to skin this problem.”
Last year, most farmers didn’t fertilize, because of the rainy weather. But this spring’s phosphorus pollution was the second highest since a team of government and university researchers began forecasting the bloom in 2002. Farmers say this absolves them and illustrates there are other sources that need to be investigated.
However, scientists who study the blooms say this is only confirmation that farm fields have been so overfertilized that residual fertilizer from previous years is continuing to contribute to the problem.
Considering the amount of phosphorus entering Lake Erie has held steady, Kapszukiewicz says, state efforts simply haven’t been enough. And those most affected by the fallout continue to be frustrated because the issue is out of their control.
“The state of Ohio has been pretty good at providing carrots,” Kapszukiewicz said. “It has been horrible at offering sticks. Carrots are good. Kasich spent $3 billion worth of carrots. The legislature gave us another $172 million worth of carrots this year. But all the carrots in the world aren’t going to fix this problem without a stick.”
A band of Toledoans petitioned to put a referendum on the February ballot that would create a Lake Erie Bill of Rights, a designation to grant the lake the same rights as a person. It would also allow environmentalists to sue on behalf of the lake.
It passed with 61% of voter support. Then, just as quickly as it was adopted, it was nixed by the legislature, which prohibited legal actions on “behalf of nature or an ecosystem.”
In a flurry of recent litigation in federal court, local communities and environmental groups are seeking a cap on the daily amount of nutrient pollution that can enter western Lake Erie. Under the Clean Water Act, any body of water deemed impaired needs to have a federally enforceable plan to remedy its degraded status.
The Ohio EPA had already deemed western Lake Erie impaired but designated it a low priority, which brought on another lawsuit calling for the federal government to force the state to take action.
But locals like Markie Miller already knew that Lake Erie is impaired. For them, the designation was simply semantics; they want progress.
“It’s like, if this has been a problem for so long, why haven’t we taken action before?” Miller said. “Why wasn’t it until it hit our kitchen sinks that we started going, ‘Maybe we need to solve this problem?'”
Explore further
Expect another huge blob of algae on Lake Erie this summer
©2019 Chicago Tribune
Distributed by Tribune Content Agency, LLC.
Citation:
Lake Erie provides drinking water for more people than any other, but algae blooms are making it toxic (2019, November 20)
retrieved 20 November 2019
from https://phys.org/news/2019-11-lake-erie-people-algae-blooms.html
This document is subject to copyright. Apart from any fair dealing for the purpose of private study or research, no
part may be reproduced without the written permission. The content is provided for information purposes only.
#Environment
0 notes
Text
How we chose America’s Top States for Business in 2021
New Post has been published on https://tattlepress.com/business/how-we-chose-americas-top-states-for-business-in-2021/
How we chose America’s Top States for Business in 2021

How intense is the battle between the states for business and jobs?
Even a global pandemic, a wrenching economic downturn, and a year of social upheaval could not slow it down. If anything, the competition has grown. And it has taken on multiple new dimensions, from the rise of remote work to a new corporate consciousness.
As the recovery gains steam, America’s Top States for Business is back to determine which states are best positioned to prevail.
Our formula for rating the states, which we have used since 2007, is designed to adapt to changing realities — even the seismic changes of the past year.
We start with 10 broad categories of competitiveness. States can earn a maximum of 2,500 points across our 10 categories. The states with the most points are America’s Top States for Business.
We assign a weight to each category based on how hard the states are pushing it in their economic development marketing. We determine that by analyzing every state’s economic development web site. If, for example, more states are pitching their low business costs, Cost of Doing Business carries more possible points.
With the global economy still shaky, Cost of Doing Business is this year’s heaviest weighted category. That follows several years in which Workforce was king. Economic uncertainty may also have helped raise the profile of Access to Capital as companies clamored for the resources to stay afloat. And it is hard to recall a time when infrastructure has been so central to competitiveness, not to mention the national debate. So, the Infrastructure category carries more weight in this year’s study than ever before.
But even our flexible formula has its limits, which 2021 put to the test.
This year, to ensure that we are measuring the states accurately, we put them through more paces than ever before, including an unprecedented 85 metrics across our 10 categories. But adapting Top States to the new realities involves more than just numbers.
The pandemic has changed the way we view health care. And the new, national focus on racial and social justice has led to unprecedented demands from corporations for inclusiveness in the locations where they choose to do business. To capture these new realities, we decided to reimagine the category we formerly called Quality of Life.
The new category, Life, Health and Inclusion, still looks at traditional quality of life measures like crime rates, health care and environmental quality. Now, we also look more closely at health-care resources and the states’ progress in ending the pandemic. In addition to the state economic development websites we review annually to weight the categories, this year we reviewed special Covid-19 resource pages that many states established. We also pay greater attention than ever to equity and inclusion — not only in this category, but throughout the study.
CNBC’s Top States for Business is not an opinion survey. We gather empirical data on the states’ performance in each metric, using the most recent figures available. Data specifically related to the coronavirus covers the period through May 2021.
In addition to their point totals, states receive a letter grade in each category to measure their performance relative to the competition. Grading is scaled, with the high score equal to 100% and the low score equal to 50%. However, each state’s overall ranking, as well as its ranking within each category, is based solely on the number of points scored.
Here are this year’s categories and weightings, and an explanation of each:
Cost of Doing Business (400 points – 16%)
At a time of unprecedented economic uncertainty, cost has returned to the forefront of competitiveness. We measure the strength of each state’s business tax climate, as well as tax burdens for various types of businesses and facilities. We also measure wage and utility costs, as well as the cost of office and industrial space. And we consider incentives and tax breaks that states offer to reduce business costs, with special emphasis on incentives targeted toward development in disadvantaged communities.
Infrastructure (375 points – 15%)
The pandemic has sparked a worldwide reevaluation of supply chains, as well as where and how we work and travel. We measure the vitality of each state’s transportation system by the value and volume of goods shipped by air, waterways, roads and rail. We look at the condition of highways and bridges, and the availability of air travel. We consider access to markets by measuring the population within 500 miles of each state. With the rise of remote work, we consider the quality, availability, and price of broadband service in each state. We rate each state’s utility infrastructure, including the condition of drinking water and wastewater systems, and the reliability of the electrical grid. We measure each state’s sustainability in the face of climate change. And we consider the availability of sites for expansion and development.
Life, Health and Inclusion (375 points – 15%)
Combine an era of enhanced social consciousness with a growing worker shortage, and it explains why, now more than ever, companies are demanding that states offer a welcoming and inclusive environment for employees. At the same time, the pandemic has put a new spotlight on health and health-care resources. These new dimensions of quality of life led us to reimagine and rename this important category for 2021. We continue to rate the states on livability factors like per capita crime rates, health care and environmental quality. Because of the new focus from businesses, we have expanded our measures of inclusiveness, looking more deeply at protections against discrimination, as well as at voting rights and current efforts to expand or restrict access to the polls, based on legislation enacted as of June 1, 2021. As the nation seeks to move past the pandemic, we look at Covid-19 vaccination rates, and we consider public health and hospital resources to deal with the lingering effects of the pandemic as well as potential future crises.
Workforce (325 points – 13%)
Even as millions of Americans remain out of work due to the pandemic, companies report they are having difficulty finding qualified workers. So, states are aggressively touting the quality of their workforces. We measure the educational attainment of each state’s working-age population, as well as which states are attracting college-educated workers and which states are losing them. With skilled workers in particular demand, we consider each state’s concentration of science, technology, engineering and math (STEM) workers. We measure worker productivity based on economic output per job. We look at union membership and right to work laws. And we measure the availability of workers, as well as the diversity of each state’s workforce.
Economy (250 points – 10%)
Particularly in uncertain times, companies are seeking states with stable finances and solid economies. We examine the strength of each state’s recovery by looking at economic growth and job growth over the past year. We measure each state’s fiscal condition by looking at its credit ratings and outlook, its overall budget picture including spending, revenue and reserves, as well as pension obligations. We rate the health of the residential real estate market. Because a diverse economy is important in any environment, we consider the number of major corporations headquartered in each state.
Business Friendliness (200 points – 8%)
As companies seek to emerge from the crisis, they are following the path of least resistance. That includes a legal and regulatory framework that does not overburden business. We measure each state’s lawsuit and liability climates, regulatory regimes covering areas such as trade and labor, as well as overall bureaucracy.
Access to Capital (175 points – 7%)
The abrupt shutdown of much of the economy left businesses of all sizes scrambling for capital, and states doing what they could to help. As a result, access to capital, which in prior years was mentioned by only a handful of capital-rich states, is now a feature of almost every state’s marketing and thus is a bigger factor in our rankings than in the past. We measure the maximum amount of state-funded Covid-related grants, loans, and loan guarantees. We also consider federal aid through the U.S. Small Business Administration Paycheck Protection Program (PPP) and Economic Injury Disaster Loans (EIDL) by state. Beyond Covid-19, we consider overall venture capital investments, as well as traditional bank lending by state with an emphasis on loans to small businesses.
Technology & Innovation (175 points – 7%)
Truly competitive states prize innovation, nurture new ideas, and have the resources to support them. We measure the states based on results, including the number of patents issued per capita, as well as health, science and agriculture research grants. We measure the vitality of each state’s technology ecosystem based on people, companies, and investment.
Education (150 points – 6%)
Not only do companies want to draw from an educated pool of workers, but they also want to offer their employees a great place to raise a family. Higher education institutions offer companies a source to recruit new talent, as well as a partner in research and development. We consider the number of higher education institutions in each state as well as long-term trends in state support for higher education. We also consider historically Black colleges and universities (HBCUs), which companies are increasingly seeking to partner with. We look at multiple measures of K-12 education including test scores, class size and spending. We also look at life-long learning opportunities in each state.
Cost of Living (75 points – 3%)
With increasing concerns about potential inflation, companies and workers are seeking states where prices are stable and daily living is affordable. The cost of living helps drive the cost of doing business. From housing to food and energy, wages go further when the cost of living is low. We measure the states based on an index of costs for basic items.
Our Sources
Our rankings are based primarily on publicly available data. Most of the information comes from federal government databases. In the cases where government statistics are not available, we seek neutral and/or ideologically diverse data sources. In addition to the sources listed below, we use data from every state’s primary economic development arm, state statutes, and the most recent Comprehensive Annual Financial Report (CAFR) issued by each state.
• ACT, Inc.
• American Lung Association
• Association of American Railroads
• ATTOM Data Solutions
• Brennan Center for Justice
• BroadbandNow Research
• U.S. Bureau of Economic Analysis
• U.S. Bureau of Labor Statistics
• CNBC Quantitative and Data Services
• U.S. Census Bureau
• Center for Election Innovation and Research
• U.S. Centers for Disease Control and Prevention
• Center for Regional Economic Competitiveness
• U.S. Chamber Institute for Legal Reform
• Climate Central
• The College Board
• CoStar Group
• Council for Community and Economic Research (C2ER)
• U.S. Department of Agriculture
• U.S. Department of Commerce
• U.S. Department of Education
• U.S. Department of Energy
• U.S. Department of Housing and Urban Development
• U.S. Department of Justice
• Education Week Research Center
• Election Law Journal: Rules, Politics, and Policy
• U.S. Environmental Protection Agency
• Federal Aviation Administration
• Federal Highway Administration
• Federal Housing Finance Agency
• Fraser Institute
• Freedom for All Americans
• U.S. Geological Survey
• George Mason University
• Institute for Health Metrics Evaluation
• Milken Institute
• Moody’s Investors Service
• National Conference of State Legislatures
• National Education Association
• National Institutes of Health
• National Right to Work Legal Defense Foundation
• National Science Foundation
• National Venture Capital Association
• The Pew Charitable Trusts
• S&P Dow Jones Indices
• State Higher Education Executive Officers
• Tax Foundation
• U.S. Patent and Trademark Office
• U.S. Small Business Administration
• U.S. Surface Transportation Board
• United Health Foundation
• Verisk Analytics
Source link
0 notes
Link
EPA Sued for Mercury Policy Dr. Mercola By Dr. Mercola Many people are not aware that, in the U.S., dental offices are the single largest source of mercury at sewage treatment plants.1 When dentists discharge mercury from amalgam fillings (also known, misleadingly, as “silver” fillings) down the drains in their offices, it accumulates in the environment, including in seafood intended for human consumption. As a neurotoxin, mercury in the environment is dangerous for everyone, but poses a particularly grave risk for pregnant women, babies and children, in whom it can seriously disrupt brain function and harm the nervous system. There was a ray of hope, however, when, in December, 2016, the U.S. Environmental Protection Agency (EPA) finalized a rule that would restrict dentists' mercury discharges. After more than a decade of debating the issue and an additional five years of delays, the EPA finally finalized requirements for dentists placing or removing amalgam to install amalgam separators to reduce their mercury discharge. Now, with the changes in administration, that rule has been rolled back, and the EPA is facing a lawsuit because of it. According to the Natural Resources Defense Council (NRDC), which filed the suit, this can’t legally be done without public notice or a comment period. NRDC’s litigation director, Aaron Colangelo, said in a statement:2 “The Trump White House ordered the EPA and other agencies to violate the law … That puts Americans at greater risk of exposure to this dangerous neurotoxin, which can do harm even in tiny amounts. … EPA’s withdrawal of the mercury rule is not just illegal, but senseless. The rule imposes minimal burden, drew widespread praise from dental providers and benefits public health and the environment.” Rule Would Reduce Mercury Discharges by 5.1 Tons a Year There are 130,000 dental offices in the U.S., about 103,000 of which still use or remove amalgam fillings.3 Together, these dentists discharge about 5.1 tons of mercury each year to publically owned water treatment plants and, according to the EPA, “most of this mercury is subsequently released to the environment.” They explained:4 “Mercury-containing amalgam wastes may find their way into the environment when new fillings are placed or old mercury-containing fillings are drilled out and waste amalgam materials that are flushed into chair-side drains enter the wastewater stream. Mercury entering POTWs [publically owned treatment works] frequently partitions into the sludge, the solid material that remains after wastewater is treated. Mercury from waste amalgam therefore can make its way into the environment from the POTW through the incineration, landfilling or land application of sludge or through surface water discharge.” While most dental offices use at least a basic filtration system to help cut down on mercury waste entering the sewer system, the rule, known as the Mercury Effluent Rule, would require dental offices to install amalgam separators that capture the mercury (and other metals) before they’re discharged into the sewer. The mercury can then be recycled. Under the rule, existing dental offices would have to install amalgam separators within three years, which was expected to reduce mercury discharge by 5.1 tons and discharge of other metals found in waste dental amalgams by 5.3 tons, annually.5 Installing the equipment was estimated to cost only about $800 per office.6 In a rare show of agreement, all stakeholders were in favor of the rule, even the American Dental Association.7 NRDC States the EPA Illegally Rescinded the Rule The EPA’s mercury rule was part of a number of public health and environmental protection rules that the White House ordered to be withdrawn early this year. The NRDC’s lawsuit against the EPA states that the agency acted illegally by withdrawing the rule without public notice or a public comment period. According to NRDC, “EPA cannot withdraw the mercury protection rule based on the Trump administration’s fiat because the rule is final.”8 The best solution would be to eliminate mercury from dentistry altogether, but until this happens, separators would at least lessen the environmental burden. About 40 percent of U.S. dental offices have already installed the devices, because 12 states have mandatory rules in place to stop mercury from being discharged into wastewater treatment plants.9 The current nominee to head the EPA, Scott Pruitt, may not help matters, however, considering he’s sued the agency in the past to block a rule to limit how much mercury could be emitted into the air by coal plants.10 It Will Take More Than Amalgam Separators to Stop Mercury Pollution The installation of amalgam separators at every dental office using amalgam should be a given, but even that will not go far enough to stop the environmental destruction that results from the continued use of this toxic metal in dentistry. Dental mercury pollution enters the water via human waste disposal and dental clinic releases. It enters the land via landfills, human burials and fertilizer. And it enters the air from dental clinic emissions and waste incineration. Seven to 9 metric tons of mercury per year escape into the atmosphere during cremations alone, and it is estimated that, left unchecked, crematoria will be the largest single cause of mercury pollution by 2020. European Union Bans Amalgam Fillings for Children and Pregnant or Nursing Women While the U.S. EPA has halted even a minimal step to curb mercury pollution from amalgam fillings, the European Union has declared that, starting July 1, 2018, amalgam use will be banned for children under 15 and pregnant or nursing women. "The next generation of Europe's children are safe from toxic dental mercury," Charlie Brown, president of Consumers for Dental Choice and the umbrella World Alliance for Mercury-Free Dentistry, said. He continued: "This landmark achievement still has to be officially ratified, but all three European Union institutions, the [European] commission, the Council [of the European Union] and the European Parliament have reached consensus. The ban on amalgam for children in Europe, we promise you, will reverberate in favor of the children across the world — in America North and South, in Africa and in Asia and the Pacific. The game changer that will do in amalgam is the Minamata Convention on Mercury, which requires every participating nation to act to reduce amalgam use. The Convention is expected to become legally binding in the middle of 2017." Seeing the EU decision as a springboard, Consumers for Dental Choice and the World Alliance for Mercury-Free Dentistry have launched a campaign to ban mercury amalgam for every child everywhere. "We target 2020 as victory year for the world's children," said Brown. "This victory for Europe's children will lead us to for the children of Asia, Africa and America North and South. Amalgam belongs only in museums that feature failed medical strategies." Amalgam Is Inferior to Today’s Modern Filling Alternatives In a press release, British dentist Graeme Munro-Hall, chair of the Transition and Training task force for the World Alliance for Mercury-Free Dentistry, described amalgam as “a primitive polluting device” that’s “technically inferior to today’s modern alternatives.”11 One of the most popular alternatives to amalgam is resin composite, which is made of a type of plastic reinforced with powdered glass. It is already common throughout the United States and the rest of the developed world, offering notable improvements over amalgam as it, according to Consumers for Dental Choice:12 • Is environmentally safe: Composite, which contains no mercury, does not pollute the environment. This saves taxpayers from paying the costs of cleaning up dental mercury pollution in our water, air and land — and the costs of health problems associated with mercury pollution. • Preserves healthy tooth structure because, unlike amalgam, it does not require the removal of significant amounts of healthy tooth matter. Over the long term, composite preserves healthy tooth structure and actually strengthens teeth, leading to better oral health and less extensive dental work over the long-term. • Is long-lasting: While some claim that amalgam fillings last longer than composite fillings, the science reveals this claim to be baseless. The latest studies show that composite not only lasts as long as amalgam, but actually has a higher overall survival rate. A lesser-known alternative is increasingly making mercury-free dentistry possible even in the rural areas of developing countries. Atraumatic restorative treatment (also called alternative restorative treatment or ART) is a mercury-free restorative technique that has been demonstrated a success in a diverse array of countries around the world, including Tanzania, India, Brazil, Zimbabwe, Turkey, Peru and more. ART relies on adhesive materials for the filling (instead of mercury) and uses only hand instruments to place the filling, making it particularly well-suited for rural areas of developing countries. Important Information About Amalgam Removal For those of you who have mercury fillings, I recommend having them very carefully removed by a competent biological dentist who follows professional protocols for amalgam removal. It's very important to have it done correctly. When amalgams are removed, a large amount of mercury is released, and if the proper precautions aren't taken, your body can absorb a massive dose of mercury that can lead to acute kidney problems. I experienced this myself more than 20 years ago when I had my amalgams removed by a non-biological dentist. Biological dentists, on the other hand, are well aware of these dangers. Some of the steps that need to be taken to keep you and your dentist safe during amalgam removal include: ✓ Providing you with an alternative air source and instructing you not to breathe through your mouth ✓ Putting a rubber dam in your mouth so you don't swallow or inhale any toxins, and using a high-volume evacuator near the tooth at all times to evacuate the mercury vapor ✓ Using a cold-water spray to minimize mercury vapors ✓ Washing your mouth out immediately after the fillings have been removed (the dentist should also change gloves after the removal) ✓ Immediately cleaning your protective wear and face once the fillings are removed ✓ Using room air purifiers If your dentist claims you need to get a new filling, talk to him about the available alternatives to amalgam, and be aware that many dental insurance companies still refuse to completely pay for composite fillings. Some, for instance, will only cover composite fillings on your front teeth while others refuse to pay at all. As a result, people who have dental insurance are actually more likely to get amalgam than those paying out-of-pocket.13 Demand Your Choice Today, about 50 percent of American dentists offer mercury-free dentistry, up from 3 percent 20 years ago. To accelerate change in the U.S., Consumers for Dental Choice is urging all American consumers to demand mercury-free dentistry — both from your dentist and from your insurance company. If they refuse, switch dentists; switch insurance. At present, many insurance companies, including Delta Dental, Aetna, Equitable and Humana typically will pay only for amalgam in your molars, even though composite, not amalgam, has become the standard and mainstream filling material in North America. And, since mercury-free dentists — again, about half of all dentists in the U.S. — will not give you an amalgam filling anywhere in your mouth, the insurance company profits handsomely since you then have to pay the bill out-of-pocket even though you're insured. As previously noted by Brown: "They sell an artificially low-price policy to get you in. That's a bait-and-switch. It's time to hold all of them accountable … Challenge your insurance company; demand your claim be paid, and work with your mercury-free dentist to do that. We have the paperwork if you push the 'Demand Your Choice' button … We can change this from the grassroots up. We're not going to wait on the FDA … We're going to simply change the market." >>>>> Click Here
0 notes
Last Seen Blogs

koichi-nomura
The Wanderer

katfreaks-hidyhole
Katfreak's Hidy-Hole

sapphic-with-issues
🏳️🌈

saturn-stripes
Saturn Stripes

placeathotel
Місце у готелі