#Liquid Aliens
Text
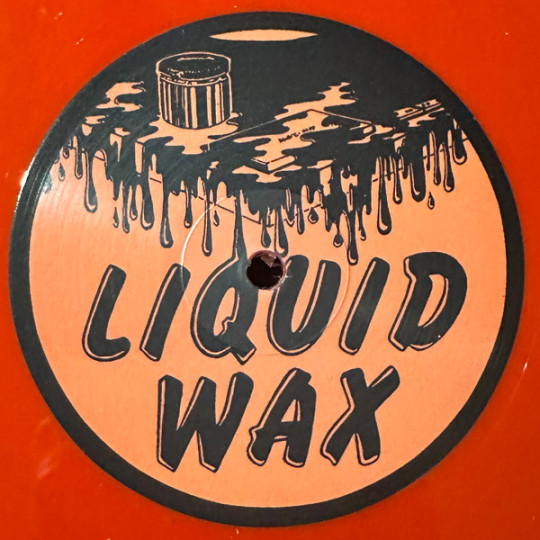


THE -> Discogs


#OMETEOR マテオ#Liquid Aliens#Are You Sure I'll Be Ok#JungleMusic#DnB (Drum and Bass)#Rave#Breakbeat#BassMusic#JungleVibes#ElectronicMusic#DnBFamily#RhythmJungle#BassCulture#JungleBeats#DrumAndBassCulture#DnBCommunity#JungleRiddims#Dubwise#BasslineJungle#JungleMassive#RumbleInTheJungle#JungleWarrior#JungleFever#BasslineGrooves#JungleDubs#BreakbeatMasters#BassDrop#JungleJams#DnBHead#JungleExploration
2 notes
·
View notes
Text

Sunrise on the Moon
By Daniel Kordan
#landscape#upload#places#crater lake#crater#Daniel Kordan#alien landscapes#photography#blue#purple#travel#nature#aesthetic#trees#moon#sunrise#water#liquid#earth art#earth#landscape photography
55 notes
·
View notes
Text

yeah i made him a fish lookin thang whatcha gonna do about it
#mother series#giegue#earthbound beginnings#yeah im proud of this so im putting it on tumblr too. hiii mother times server how yall doing#ignore that he doesnt have a back leg i tried but it looked kinda weird and cramped#anyways i gave giegue gill things and a more fish-esque appearance because i hc his species is aquatic#like they come from an oceanic? aquatic? unsure. well its a planet that is almost entirely water im talkin subnautica levels of sea#that's why he had that capsule orb thing in mother 1. he needs it to live and the weird engine-esque things at his side are like purifiers#making sure the liquid is suitable. not too focused on much else (why bother when you're a super powerful psychic) but isn't exactly fragil#like the material is flexible and rubbery even. you hit it and it bounces back a good amount#we don't really get an explanation for why earth itself was chosen to get invaded. at least i don't remember if there was one sorry 😭 BUT#i hc also that the reason giegue's species decided to invade here specifically was because of territory. i mean we've got a lot of water#maybe they took george and maria to test humanity in a sense. if they reacted positively to an alien child mayybe they wouldnt have needed#to straight up eradicate humanity maybe this time we wont need to fight too much. would be inconvenient to waste firepower on these#simple creatures. they're not even that smart. can't even use our epic brain powers lol (aged real well)#once again they aint found him yet but when they do they gon be surprised#anyways its like 4 in the morning i cant keep doing this. thanks for reading my brainworms over a game ive never played 🤙
7 notes
·
View notes
Note
Hhhhhhh Ross from the palm pals line pleaaaaase?


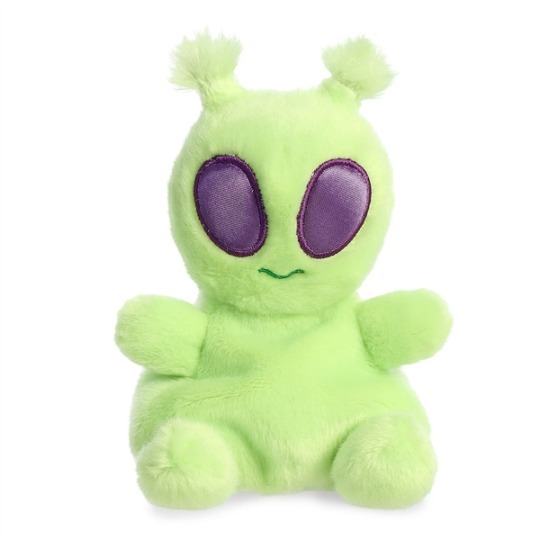
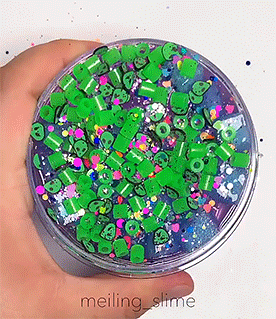
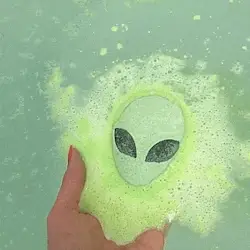

He's so gnarp gnap I love him
👽-🛸-👽
🛸- x -🛸
👽-🛸-👽
#stimboard#palm pals#palm pals ross#plush#plushie#stuffed animal#moodboard#stim#alien#earrings#hands#bath bomb#knife#slime#liquid#green#purple#holographic#foil#shiny#water
16 notes
·
View notes
Text
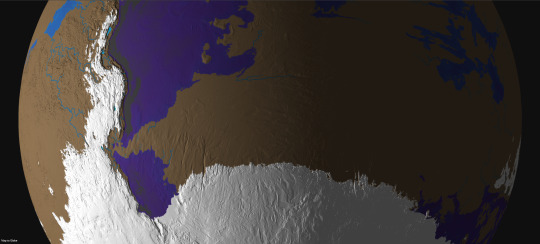
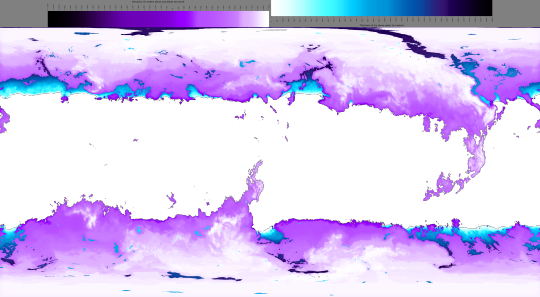
This third series of maps for @jayrockin‘s “Runaway to the Stars” project represent the planet their Bugferret alien species calls home, a cold, seasonless world with much of its water held up in immense ice sheets and extensive cave systems. As such, a great deal of this world’s oceanic crust is exposed to the air, concentrating what little seawater remains at the subduction trenches and other extremely old, low-lying portions of crust.
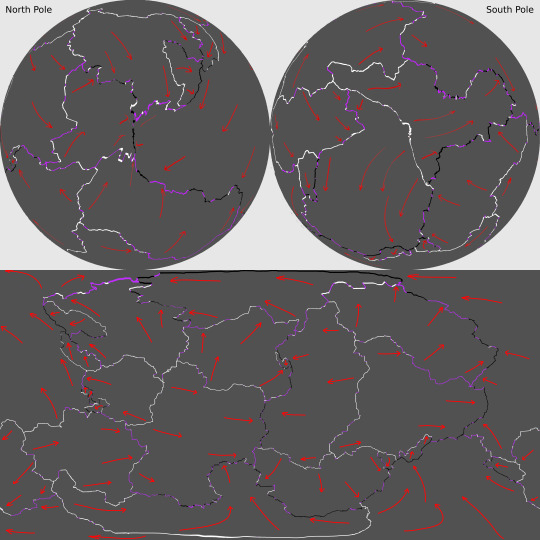
First, the planet’s plate tectonics, with the plate boundaries defined in white (for divergent boundaries), black (for convergent boundaries), and purple (for transform boundaries) and the directions of drift marked by red arrows, in Equirectangular Projection and Poles-Centered perspective.
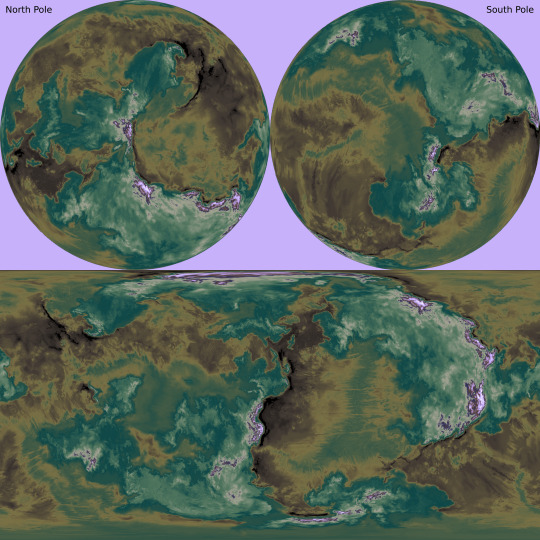
The maps below show the planet’s elevation data, first in grayscale with no color gradient applied, in Equirectangular Projection and Poles-Centered perspective;

then with the color gradient applied, also in Equirectangular Projection and Poles-Centered perspective;
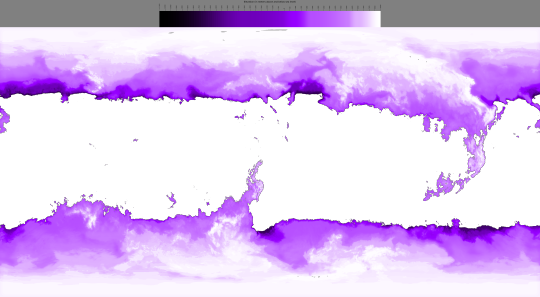
and then with the color gradient once again removed but now showing the planet’s liquid water, in Equirectangular Projection only.

The second phase of this commission focused on the planet’s ice sheets and the liquid water hidden beneath it them.
First, there’s the raw elevation data for the ice in relation to “sea level” -with no contiguous ocean to define this, it is instead defined as 200 meters above the average continental shelf’s edges, correlating to Earth’s own sea level-, along with a key, in Equirectangular Projection;

then, the same data with a color gradient applied;
and again, this time also showing how many meters of ice sit atop the subglacial bodies of water;
and lastly, the thickness of the ice over land as well as water, first in grayscale;

and then with a color gradient applied.

The thickest point in Earth’s own ice sheets is 4,776 meters deep, just a fraction of the Bugferret planet’s maximum of 18,000 meters between the top of the ice sheet and the trench-sea hidden beneath it.
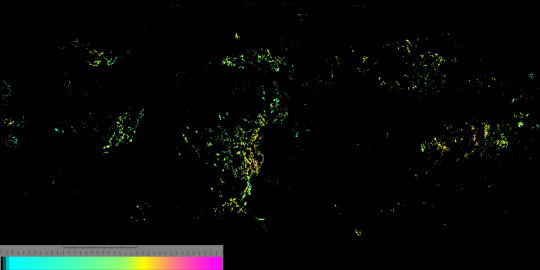
The map below shows the volcanic activity on this planet. Volcanoes marked in pink have erupted in the past millennium, and those marked in white have erupted in the past 300 years Looking back to the ice-cover map that also shows the subglacial water, you can see how some of those lakes are caused by recent eruptions, as are the few ice-free mountain peaks in the higher latitudes.

Lastly, the third phase of this project mapped out the cave systems, expanded tremendously both by modern Bugferret activity and previous eons of dissolution and upheaval by organisms more comparable to fungi, plants, and burrowing detritivores.
The first map below shows all of the major caverns combined into one layer, color-coded by vertical position in relation to the so-called sea level, instead of depth beneath the local surface.
I mapped out these caves in four overlapping layers, here color-coded to represent the tallness of a given chamber. The first of these layers contains those caves closest to the surface;

a bit further beneath the surface;

further down still;

and the lowest layer of all, with its shallowest caves sitting no less than 8,500 meters beneath their local surface.

All the caves shown here can be accessed from the surface, either directly or in connection to other caves, even if the connecting passages are too narrow to be visible at this resolution. Some of these connections can be fully seen or at least suggested in the cross section below, showing the vertical positions of the caverns beneath a mountain range, or a small slice thereof.

This cross section is shown again with a map that marks its location, and that also includes the ice sheets, subglacial and exposed liquid water, and combined caves.

These maps were all created in Photopea. My reddit post dedicated to this project, wherein you can see the highest resolution versions of these images, is linked here.
2022
#runaway to the stars#mapmaking#imaginary maps#worldbuilding#commission#digital painting#photopea#Bugferrets#fictional planets#elevation map#color gradients#ice maps#liquid water map#cave systems#major project#alien planet#Christopher Maida Artwork
60 notes
·
View notes
Note
The fun part is I got randomly assigned the human race among all the cosmic nations....... Low-key lame game wise but. Humans are so weak and fragile 🥺🥺🥺🥺
So weak and fragile no matter what you, it must really suit you 🥺
#alien captors wondering why these colorful spots keep appearing if they're too rough with you#and they like it very much#so cute with your eyes leaking liquid they're obsessed#💌🐺🪳 menace
18 notes
·
View notes
Text
Well I’m a blog about Tea so…Thanks Ryan.
#Tea#Ryan Kelly#Cult#tea cult#blue people#celestial#alien#eugenics#conspiracy theories#conspiracies#comedy#tea blends#sleepy tea#tiktok#youth pastor Ryan#drinks#elixir#should i be concerned#drink me#liquid
5 notes
·
View notes
Text
I watched Knock At The Cabin and I'm not sure how I feel about it but it was better than I expected. I mean, at this point with M Night Shyamalan I just go in prepared for deep disappointment, and I didn't get that!
#knock at the cabin#m night shyamalan#or according to my dictation app#I'm not sure I'm all in#which isn't that far off really#I mean it's exactly how I feel about his movies#after the shitty ending to unbreakable#I mean otherwise unbreakable was a great movie#I truly enjoyed signs but I know a lot of people didn't either because the religious stuff was too much or because why the hell#would aliens who can't come into contact with liquid water without severe injury#come to this planet of all places#but hey maybe it's only fresh liquid water!#maybe saltwater/ocean water are just fine!#and they thought liquid fresh water is only a tiny fraction of what exists on our planet compared to saline#they can totally avoid it!#I didn't hate the village I appreciated what it was trying to do but still it was a little clunky#somehow I totally missed the one with Mark Wahlberg and the killer trees#definitely did not see his Airbender one#did see the girl in the water and again that was okay but also meh#I can't go into all the reasons why because I don't remember#except that again he does tend to be a wee bit heavy handed with the spiritual themes#which I guess happened again here in knock at the cabin#but Jonathan groff did his groffing and that redeemed a lot if it#jonathan groff#!!!!#and I do always love the Philadelphia and neighboring counties references#looks like peacock also has the sixth sense so he thinks I'm going to rewatch that one#poor M Night Shyamalan his first movie is still his best#it's not even a contest
12 notes
·
View notes
Text


👾-🐈⬛-👾-🐈⬛-👾-🐈⬛-👾-🐈⬛-👾
Milo/Mylo/Myles Morales

🕷️꒱ Anyone not on our dni can reblog
🕷️꒱ DNI if you’re a pedophile/variants, proshippers, lgbt+phobe, n*zi, trump supporter, ableist, racist, people who ship incest or pedophilic ships, people who still support dream, or others in our dni
#across the spiderverse fictive#miles morales fictive#skull#flashing#tw skull#tw flashing#skull tw#flashing tw#glow#mask#cyberpunk#computer fans#wax melt#science stims#liquid#resin#alien#glitter#white#black#purple#rainbow
4 notes
·
View notes
Text

Pascal Boegli
#danakil depression#dallol ethiopia#dallol#ethiopia#Africa#landscape#alien landscape#liquid#earth#water#green#orange#geology#upload#nature#places#Pascal Boegli#photography#nature photography#aesthetic
124 notes
·
View notes
Text
tbh my own headcanon re: hair is that it only grows when clark bothers to eat regularly. while he photovoltaics up his metabolic energy, the raw building blocks still have to come from somewhere. if he gets hurt, he probably still needs to eat some form of carbon, etc.
god knows what kind of stomach acid that man has though considering the nonsense he’s eaten
#also his hair grows fuckoff slowly cause it's so dense#also like. he eats fairly regularly unless he's megastressed so this doesn't come up much#same with thirst.#he only needs to drink if he's losing. liquids.#of assorted kinds.#this ties into my silly little kryptonian mythology in that rao gave humanoid kryptonians the ability to metabolize sunlight bc#krypton was a ludicrously hostile planet to live on and calories were REALLY hard to come by#rao just forgot to put a stack overflow limit on it cos rao's light wasn't very strong#or that's the mythology anyway#kryptonians are aliens
33 notes
·
View notes
Text
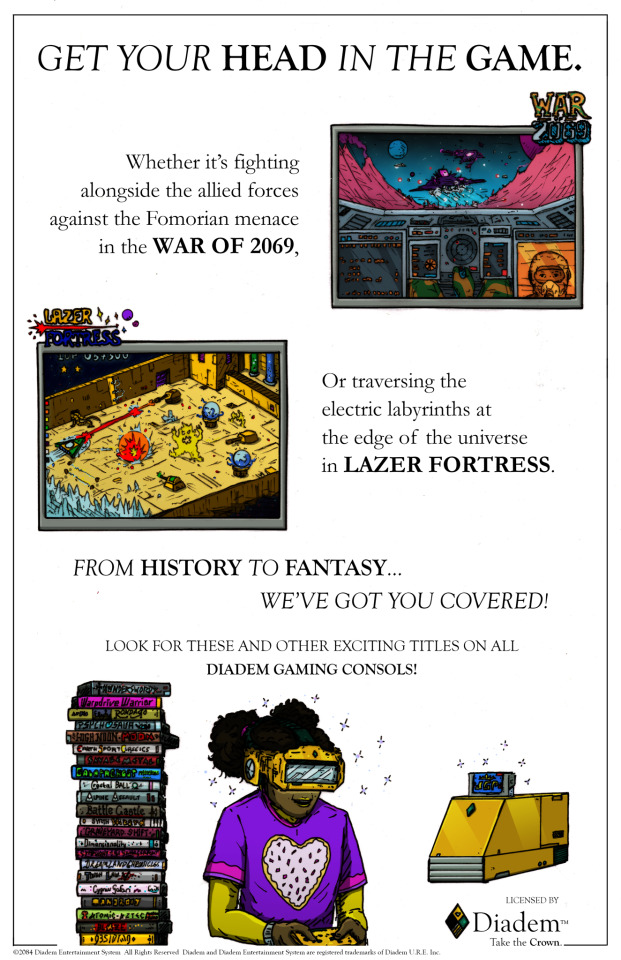
Part 2 of the first chapter of my comic Obsidian with fake ads. Enjoy!
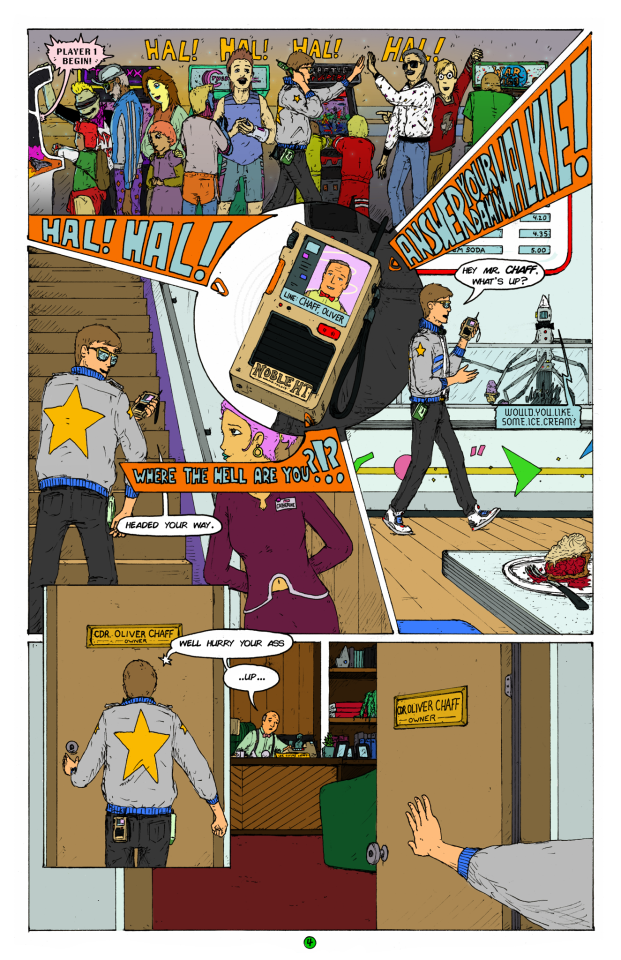
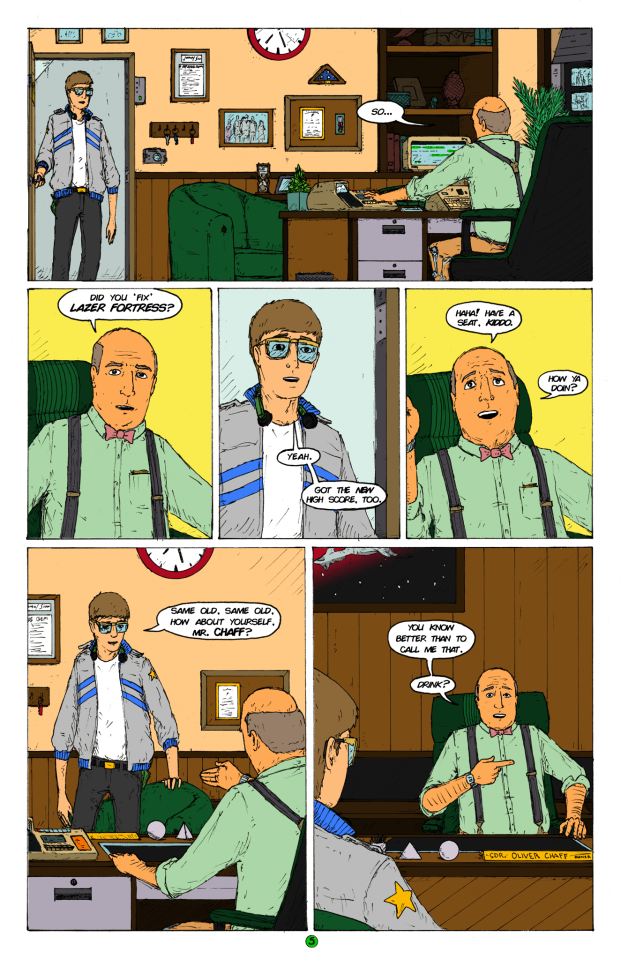
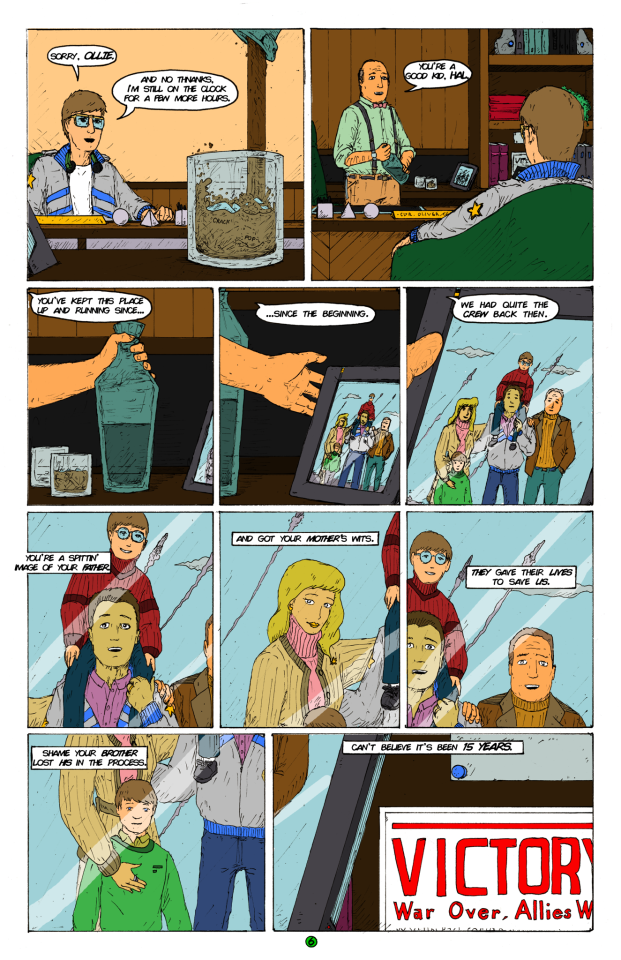


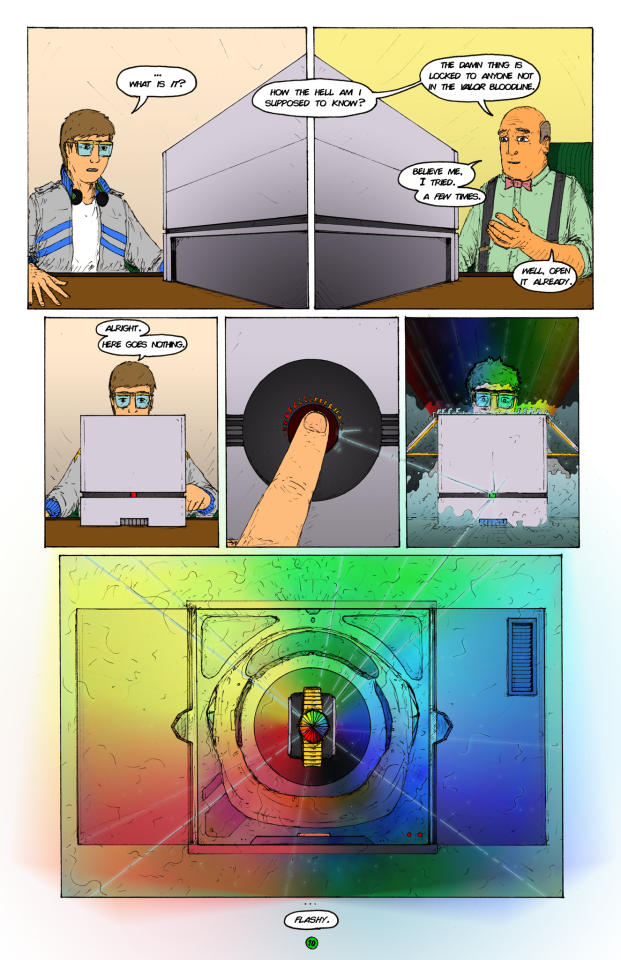

Link to part 3: https://www.tumblr.com/seanslvn/712424488555413504/sean-patrick-sullivan
Link to Part 1: https://www.tumblr.com/seanslvn/712424101064622080/part-1-of-the-first-chapter-of-my-comic-obsidian
#art#sci fi#comics#fantasy#aliens#ink#graphic novel#retro aesthetic#80s#obsidian#chapter 1#arcade#fake ads#video games#2084#diadem#life jacket#apparel#watches#liquid shadow
4 notes
·
View notes
Text

Ultimate Liquid Auriel(Slugterra OC)
Y aquí tenemos la versión suprema de Liquid Auriel. Si quieren una descripción más detallada les dejo el siguiente enlace: https://www.deviantart.com/dominic1276/art/Ultimate-Liquid-Auriel-SlugterraxBen10-936512360
#slugterra#bajoterra#chaos#water monster#fanart#oc#Liquid Auriel#ultimate#ultimate alien#this is not an omnitrix#this is an usermatrix#Long Life Slugterra
8 notes
·
View notes
Text


Alien X (Ben 10) with black and void-themed stims!
🖤|👾|🖤
👾|🖤|👾
🖤|👾|🖤
#hrrrrng Gender#weheartstims#stimboard#alien x#ben 10#black#painting#paint#paintbrush#cats#liquid#slime#hands
18 notes
·
View notes
Last Seen Blogs

condnsdmlk-vids
condnsdmlk vids
yejjis
𝙉𝙊𝘽𝙊𝘿𝙔 𝙇𝙄𝙆𝙀 𝙔𝙊𝙐
ilovemitskiiii
Kore

tads-rad
TAD BURGESS

livingblurr
Nighttide