#chartanalysis
Text
Astro story time!!

Send your story!
"My ex can't stop thinking about me and is madly in love, but we broke up one year ago."
We started our relationship online, and we instantly get well and fell in love. We assume the relationship a couple of months later and we didn't met in person. So he came to where i live and stayed a week. A month later i went to his home and stayed a month. We had this type of thing going on for some months and then we decided to live together, since he would come to my city. The last visit before he move in, he started to dictate how things would be with us living together. I didn't like It at all, told him that, he Said he would change. He didn't. Só i broke up with him one year ago and he still try to contact me saying he is madly in love with me and i am ALL he thinks about. I was pretty clear i do not want this relationship anymore, since everything he did i can't erase, and the spark is gone. He is so spoiled and mamas boy. He wanted me to mother him sometimes. i think he says he is Sorry about things i told him because he knows i think its wrong. Not because he sees that. Why is he so obsessed over us?
Analysis: "a neptune illusion"

Well, you two have the same ASC so It can explain why you two get well so fast. His lillith is in your stellium. She makes tight contacts with your moon and venus. You are the embodiment of his lillith. Plus, his Juno ia opposing your stellium, touching It either. He feels Juno within you, even If you know at heart you are not. His pluto opposite your mars+Mercury indicating that his obsession with you talks about your witty, intelligence, knowledge. And your rawr nature. You are probably the best sex of his life. His Mars tho, do not touch your chart the way It supposed to be to do that. Since the two Mars are Air Mars, you do have similar tastes but something is missing for you. I can say, putting the house your Mars is in (4th) on the equation, that you miss making love. He likes rawr sex. BDSM vibes and lillith in Gemini is so role playing! You hook this one for good. His Sun and venus are in your 7th, you thought It could work. But his neptune is in your 12th, and your neptune in his!!! So lots of projections. When he showed what he was really about your 12th came clear as water (because your neptune is naturally there you are use to the energy to the point It can shift and shine back thru your higher (12th) understanding (conjunct Uranus). But he, on the other half, are in neptunes illusions. He still see you as this whole thing, but he can't see thru himself and make the actions that are needed to really be a different person at things he have to grow. He want you back. He says he is going to change. But he doesnt know where he is doing wrong because is something he have to understand, not thru what you say, but thru himself.
An important point here is that his neptune touches every corner of his chart.
His pisces Saturn opposing his virgo Mercury shows that he is naturally inclined to have these conscious oppeness later in life. (Saturn opp Mercury touches uranus). And since his jupiter is in 10th sagittarius he will probably get his Focus on "growing up" by taking responsabilities thru his career.
Well, i Hope i could help you understand a little more about this.
Send your astro story and let's see thru the lens of the stars!!
#astro observations#astro notes#composite chart#astrology#synastry#birth chart#story#astrostory#deepvelvet#chartanalysis
59 notes
·
View notes
Text
Decoding Crypto Charts: Your Economic Weather Forecast for Smart Trading! 📈🌐
Just like checking the weather before a journey, understanding crypto charts empowers traders to navigate the financial climate wisely🚀💡
0 notes
Text
"Take Control of Your Trading Journey with ChartBuddy: Unlocking Reliable Buy/Sell Signals and Advanced Chart Analysis."
.
.
.
Follow + Like + Share + Comment
Follow us for daily tips and setups
Turn on post notifications
Follow for more update @chartbuddyofficial
#forex#stockmarket#nifty#bitcoins#crypto#technicalanalysis#tradingcards#tradingtips#tradingmemes#forextrading#success#business#bullishtrend#chartanalysis#stoploss#traders#trademarketing#sharemarket#riskmanagement#riskanalysis#financialgrowth#startupindia#sensex#explorepage#chartbuddyofficial#investing#trader#forextrader#money#stocks
0 notes
Text
How to Read and Interpret Candlestick Charts in Trading

Mastering the Art of Analyzing Candlestick Charts for Effective Trading
By Amir Shayan
Candlestick charts are one of the most popular and widely used tools in technical analysis. They provide valuable insights into price action, market sentiment, and potential trading opportunities. If you're new to trading or want to enhance your chart analysis skills, learning how to read and interpret candlestick charts is essential. In this article, we will guide you through the process of understanding candlestick charts and using them effectively in your trading strategy.
What are Candlestick Charts?
Candlestick charts originated in Japan in the 18th century and have become a staple in technical analysis. They visually represent price movements over a specific time period, displaying the opening, closing, and high, and low prices of an asset. Each candlestick consists of a rectangular body and two wicks, also known as shadows or tails.
The body of the candlestick represents the price range between the opening and closing prices. If the closing price exceeds the opening price, the body is typically filled or colored green, indicating a bullish or positive candle. Conversely, if the closing price is lower than the opening price, the body is typically hollow or colored red, indicating a bearish or negative candle.
The wicks represent the price extremes reached during the time period. The upper wick extends from the top of the body and represents the highest price reached, while the lower wick extends from the bottom of the body and represents the lowest price reached.
Reading Candlestick Patterns
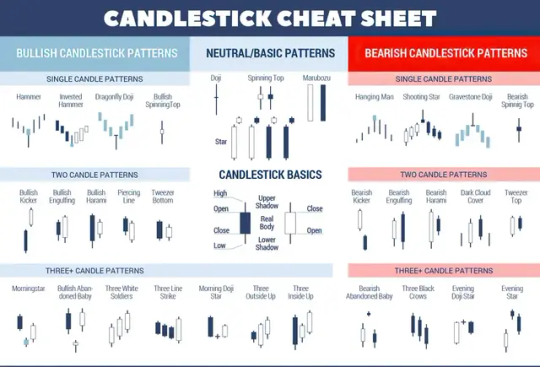
Candlestick patterns consist of one or more candlesticks arranged in specific formations. These patterns provide traders with valuable information about market sentiment and potential trend reversals. Here are some common candlestick patterns and their interpretations:
- Bullish Engulfing Pattern: This pattern occurs when a small bearish candle is followed by a larger bullish candle that completely engulfs the previous candle. It indicates a potential reversal from a bearish to a bullish trend.
- Bearish Engulfing Pattern: The opposite of the bullish engulfing pattern occurs when a small bullish candle is followed by a larger bearish candle that engulfs the previous candle. It suggests a potential reversal from a bullish to a bearish trend.
- Hammer: A hammer candlestick has a small body and a long lower wick, resembling a hammer. It indicates a potential reversal from a downtrend to an uptrend and is considered a bullish signal.
- Shooting Star: The shooting star candlestick has a small body and a long upper wick, resembling a shooting star. It suggests a potential reversal from an uptrend to a downtrend and is considered a bearish signal.
- Doji: A doji candlestick has a small body and occurs when the opening and closing prices are virtually the same. It indicates indecision in the market and suggests a potential trend reversal.
Interpreting Candlestick Chart Patterns
While individual candlestick patterns can provide valuable insights, it is important to consider them within the context of the overall chart and other technical indicators. Here are some tips for interpreting candlestick chart patterns:
- Trend Confirmation: Candlestick patterns can help confirm the continuation or reversal of an existing trend. For example, a series of bullish candlestick patterns in an uptrend may indicate the continuation of the upward movement.
- Support and Resistance Levels: Candlestick patterns can provide clues about support and resistance levels. For instance, a bullish reversal pattern forming near a strong support level may suggest a potential bounce in prices.
- Volume Analysis: Combining candlestick patterns with volume analysis can provide additional confirmation. Higher volume during a bullish pattern or lower volume during a bearish pattern can strengthen the validity of the signal.
- Timeframe Consideration: Different candlestick patterns may have varying degrees of significance depending on the timeframe you're analyzing. A pattern that is significant on a daily chart may have less relevance on a shorter intraday chart.
Candlestick patterns are best used in conjunction with other technical analysis tools and indicators to form a comprehensive trading strategy. Here are some additional factors to consider when interpreting candlestick charts:
- Chart Patterns: Look for the formation of chart patterns alongside candlestick patterns. For example, a bullish candlestick pattern occurring within a bullish continuation pattern, such as a flag or a triangle, can strengthen the bullish bias.
- Confluence of Signals: Seek confluence between candlestick patterns, support/resistance levels, trendlines, and other technical indicators. When multiple signals align, it increases the probability of a successful trade.
- Market Conditions: Consider the broader market conditions and fundamental factors that may influence price movements. Candlestick patterns are more reliable when they align with the overall market trend and relevant news events.
- Risk Management: Always implement proper risk management techniques, such as setting stop-loss orders and calculating risk-reward ratios. Candlestick patterns provide insights into potential market reversals, but risk management is crucial to protect your capital.
- Practice and Observation: As with any trading skill, practice is essential. Familiarize yourself with different candlestick patterns and observe how they perform in real-market scenarios. Keep a trading journal to track the effectiveness of different patterns and refine your trading strategy over time.
Conclusion
Mastering the art of reading and interpreting candlestick charts can significantly enhance your trading decisions. Candlestick patterns offer valuable insights into market sentiment, trend reversals, and potential trading opportunities. However, it is important to remember that candlestick analysis should not be used in isolation but as part of a comprehensive trading strategy that incorporates other technical analysis tools and fundamental analysis. By combining candlestick patterns with other indicators and considering the broader market context, you can improve your trading accuracy and make informed decisions in the dynamic world of trading.
Remember to practice and gain experience in applying candlestick patterns to different market scenarios. With time, patience, and diligent analysis, you can harness the power of candlestick charts to become a more proficient and successful trader.
Read the full article
#bearishpatterns#bullishpatterns#candlestickcharts#chartanalysis#marketsentiment#priceaction#Technicalanalysis#tradingstrategy#Tradingtools#trendreversal
0 notes
Video
youtube
DIAMOND PATTERN IN BANKNIFTY | BANKNIFTY ANALYSIS | DIAMOND PATTERN | 29...
#youtube#diamond pattern#DIAMONDCHART#charts#chartanalysis#banknifty#bankniftyanalysis#market analysis#rare#rare chart
0 notes
Text
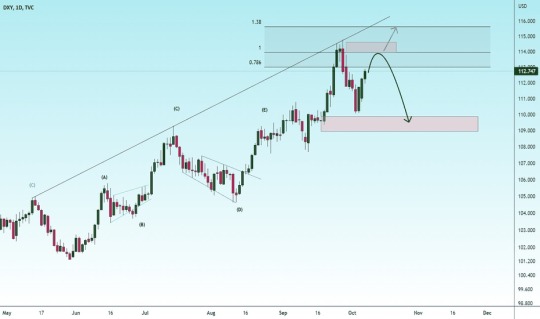
Probability of an uptrend DXY
A corrective wave is expected to occur in the chart after some fluctuation in the previous ceiling range After crossing the previous...DM
Join us now
#dxy#chartanalysis#technicalchart#technical analysis#forextrader#forextrading#forexmarket#education#fxsignals#recession#food#follow if you like#fxmarket#finance#business#earn money fast#forexstrategy#share market news#tradingforex#live trading
0 notes
Text
https://saptarishisshop.com/karma-rebirth-and-jyotish-by-o-d-mande/
Karma Rebirth and Jyotish by O D Mande
In this article, O D Mande describe the concept of Karma and Reincarnation with example charts of Jawahar Lal Nehru, Indira Gandhi, Amitabh Bachchan, & Lahiri Mahasaya. The writer feels understanding one’s karma ought to be the primary purpose of Jyotish, the timing of materialistic events like marriage, childbirth, professional gains, etc being secondary.
#vedicastrology#karma#rebirth#jyotish#astrology#JawaharLalNehru#IndiraGandhi#AmitabhBachchan#LahiriMahasaya#chartanalysis#saptarishisastrology
0 notes
Text
How to Read and Interpret Candlestick Charts in Trading
Mastering the Art of Analyzing Candlestick Charts for Effective Trading
By Amir Shayan
Candlestick charts are one of the most popular and widely used tools in technical analysis. They provide valuable insights into price action, market sentiment, and potential trading opportunities. If you're new to trading or want to enhance your chart analysis skills, learning how to read and interpret candlestick charts is essential. In this article, we will guide you through the process of understanding candlestick charts and using them effectively in your trading strategy.
What are Candlestick Charts?
Candlestick charts originated in Japan in the 18th century and have become a staple in technical analysis. They visually represent price movements over a specific time period, displaying the opening, closing, and high, and low prices of an asset. Each candlestick consists of a rectangular body and two wicks, also known as shadows or tails.
The body of the candlestick represents the price range between the opening and closing prices. If the closing price exceeds the opening price, the body is typically filled or colored green, indicating a bullish or positive candle. Conversely, if the closing price is lower than the opening price, the body is typically hollow or colored red, indicating a bearish or negative candle.
The wicks represent the price extremes reached during the time period. The upper wick extends from the top of the body and represents the highest price reached, while the lower wick extends from the bottom of the body and represents the lowest price reached.
Reading Candlestick Patterns
Candlestick patterns consist of one or more candlesticks arranged in specific formations. These patterns provide traders with valuable information about market sentiment and potential trend reversals. Here are some common candlestick patterns and their interpretations:
- Bullish Engulfing Pattern: This pattern occurs when a small bearish candle is followed by a larger bullish candle that completely engulfs the previous candle. It indicates a potential reversal from a bearish to a bullish trend.
- Bearish Engulfing Pattern: The opposite of the bullish engulfing pattern occurs when a small bullish candle is followed by a larger bearish candle that engulfs the previous candle. It suggests a potential reversal from a bullish to a bearish trend.
- Hammer: A hammer candlestick has a small body and a long lower wick, resembling a hammer. It indicates a potential reversal from a downtrend to an uptrend and is considered a bullish signal.
- Shooting Star: The shooting star candlestick has a small body and a long upper wick, resembling a shooting star. It suggests a potential reversal from an uptrend to a downtrend and is considered a bearish signal.
- Doji: A doji candlestick has a small body and occurs when the opening and closing prices are virtually the same. It indicates indecision in the market and suggests a potential trend reversal.
Interpreting Candlestick Chart Patterns
While individual candlestick patterns can provide valuable insights, it is important to consider them within the context of the overall chart and other technical indicators. Here are some tips for interpreting candlestick chart patterns:
- Trend Confirmation: Candlestick patterns can help confirm the continuation or reversal of an existing trend. For example, a series of bullish candlestick patterns in an uptrend may indicate the continuation of the upward movement.
- Support and Resistance Levels: Candlestick patterns can provide clues about support and resistance levels. For instance, a bullish reversal pattern forming near a strong support level may suggest a potential bounce in prices.
- Volume Analysis: Combining candlestick patterns with volume analysis can provide additional confirmation. Higher volume during a bullish pattern or lower volume during a bearish pattern can strengthen the validity of the signal.
- Timeframe Consideration: Different candlestick patterns may have varying degrees of significance depending on the timeframe you're analyzing. A pattern that is significant on a daily chart may have less relevance on a shorter intraday chart.
Candlestick patterns are best used in conjunction with other technical analysis tools and indicators to form a comprehensive trading strategy. Here are some additional factors to consider when interpreting candlestick charts:
- Chart Patterns: Look for the formation of chart patterns alongside candlestick patterns. For example, a bullish candlestick pattern occurring within a bullish continuation pattern, such as a flag or a triangle, can strengthen the bullish bias.
- Confluence of Signals: Seek confluence between candlestick patterns, support/resistance levels, trendlines, and other technical indicators. When multiple signals align, it increases the probability of a successful trade.
- Market Conditions: Consider the broader market conditions and fundamental factors that may influence price movements. Candlestick patterns are more reliable when they align with the overall market trend and relevant news events.
- Risk Management: Always implement proper risk management techniques, such as setting stop-loss orders and calculating risk-reward ratios. Candlestick patterns provide insights into potential market reversals, but risk management is crucial to protect your capital.
- Practice and Observation: As with any trading skill, practice is essential. Familiarize yourself with different candlestick patterns and observe how they perform in real-market scenarios. Keep a trading journal to track the effectiveness of different patterns and refine your trading strategy over time.
Conclusion
Mastering the art of reading and interpreting candlestick charts can significantly enhance your trading decisions. Candlestick patterns offer valuable insights into market sentiment, trend reversals, and potential trading opportunities. However, it is important to remember that candlestick analysis should not be used in isolation but as part of a comprehensive trading strategy that incorporates other technical analysis tools and fundamental analysis. By combining candlestick patterns with other indicators and considering the broader market context, you can improve your trading accuracy and make informed decisions in the dynamic world of trading.
Remember to practice and gain experience in applying candlestick patterns to different market scenarios. With time, patience, and diligent analysis, you can harness the power of candlestick charts to become a more proficient and successful trader.
Read the full article
#bearishpatterns#bullishpatterns#candlestickcharts#chartanalysis#marketsentiment#priceaction#Technicalanalysis#tradingstrategy#Tradingtools#trendreversal
0 notes
Photo
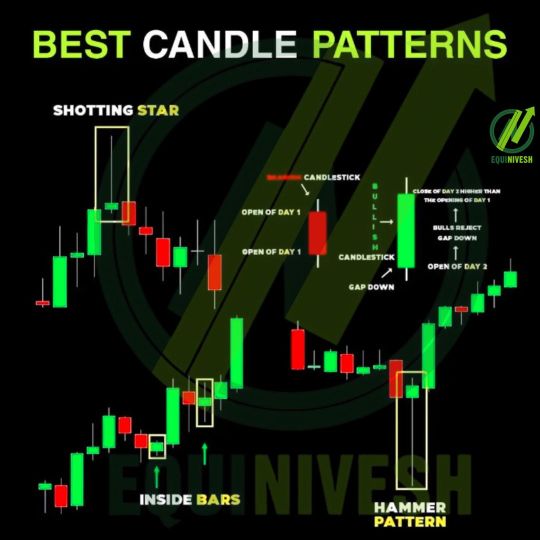
BEST CANADAL PATTERN 🔥
If you want to learn technical analysis then you can Join our Telegram Channel Link in bio📈📈📈📈📈📈📈📈📈📈📈📈
🏅Option trading strategis📊📊
🎖️And Siganl provide (Educational Purposes)
🎁🎁🎁🎁🎖️🏅🏅🏅
📊📊📊📊📊📊📊📊📊📊📊
🎇Make Passive income
,💢 Click the bio link
💥 @Equinivesh official
💢 Teligram garup link in bio
{हमसे जुड़ने के लिए इस लिंक से फ़ॉलो करे}🎎
[FOLLOW]
👇👇👇👇👇👇👇👇👇
❤️ @Equinivesh official
❤️ @Equinivesh official
❤️ @Equinivesh official
❤️ @Equinivesh official
❤️ @Equinivesh official
⭐⚡⚡⚡⭐⭐⚡⚡⚡⭐⭐⚡⚡⭐⭐
#equinivesh#financialfreedom
#trader
#stock #nse
#daytrader #wealth #bse #forextrader
#stockmarketnews #daytrading
#stockmarketindia
#priceactiontrading #priceactionstrategy
#priceactiontrader
#priceactionpattern #stockmarketindia
#stockmarketeducation #sharemarketindia
#chartpatterns #chartanalysis #technicalanalysis
2 notes
·
View notes
Last Seen Blogs

wake2bake
I'm Not High, But I'm Your Highness

stevehs
make him pay

kcattawodahs
i could destroy anyone who crosses my path :)

alison068
Untitled

flancortes
Alan Cortes