#Atlantic Ocean Waters | El Niño
Text
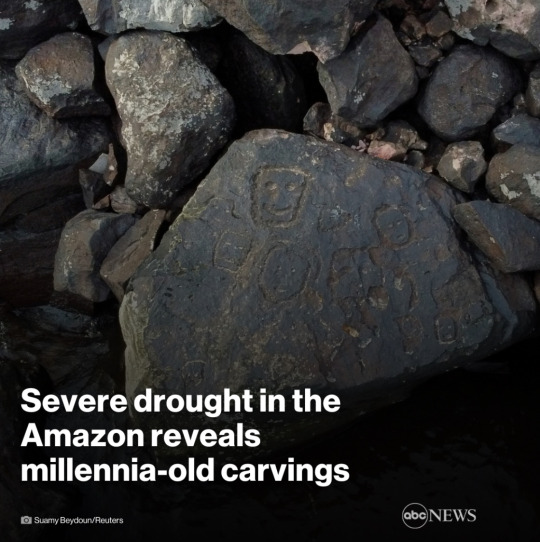
Severe Drought in the Amazon Reveals Millennia-Old Carvings
— The Millennia-Old Carvings Were Peviously Hidden Under Water.
— By Fernando Crispim and Edmar Barros | Associated Press | October 28, 2023

An archaeologist measures rock paintings at the Ponta das Lajes archaeological site, in the rural area of Manaus, Brazil, Saturday, Oct. 28, 2023. The archaeological site was exposed following a drought in the Negro River, unveiling rock paintings that, according to archaeologists, date back between 1,000 and 2,000 years. (AP Photo/Edmar Barros) The Associated Press
MANAUS — The Negro River, the major tributary that runs through the Brazilian Amazon, has reached historic lows, revealing millennia-old carvings previously hidden under water.
The engravings deeply etched into the black rock along the riverbanks represent human faces, animals and other figures, and are thought to be 1,000 to 2,000 years old, archaeologists said.
“They allow us to understand the way of life of prehistoric populations,” Jaime de Santana Oliveira, an archaeologist with Brazil’s National Historic and Artistic Heritage Institute, said.
The scientists think other rocks at the site were used to sharpen arrows and stone tools.

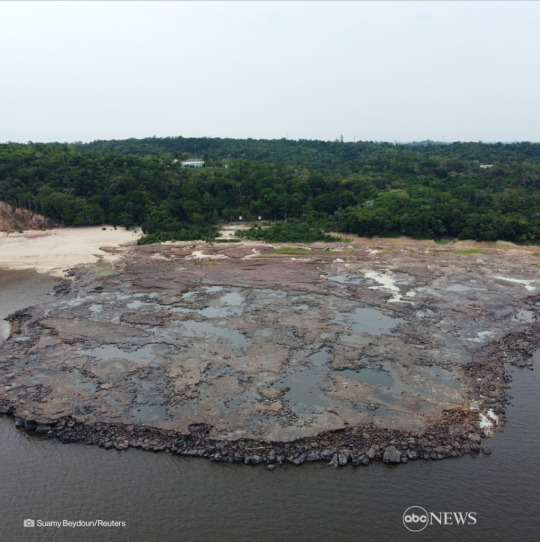

The Ponto das Lajes archaeological site is located in the rural area of Manaus, the largest city and capital of Amazonas state. From there, locals and tourists can observe the “Meeting of Waters,” which occurs when the dark, Coca-Cola-colored Negro River and the pale, clay-colored Solimoes River converge without merging and run parallel to each other over several miles.
The petroglyphs first were spotted in 2010, when another bad drought struck the region, but had not been observable since then before the current drought.
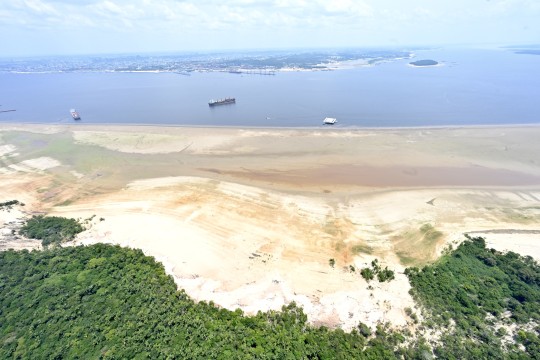
Low river levels in Amazonas have turned once navigable rivers into endless sand banks and mud, leaving hundreds of communities isolated. Public authorities have scrambled to get food and water to those communities in recent weeks.
Earlier this week, The Associated Press observed the delivery of basic goods. Boats had to dock miles away, forcing residents, most of them small farmers and fishermen, to walk long distances.
Manaus and other nearby cities are experiencing high temperatures and heavy smoke from fires set for deforestation and pasture clearance. The drought is also the likely cause of dozens of river dolphin deaths in Tefe Lake, near the Amazon River.
Dry spells are part of the Amazon’s cyclical weather pattern, usually from May to October. This season’s drought has been fiercer than usual due to two climate phenomena: the warming of northern tropical Atlantic Ocean waters and El Niño — the warming of surface waters in the Equatorial Pacific region.
#Severe | Drought#Amazon | Brazil 🇧🇷#Negro River | Carvings#Archaeologist | Jaime de Santana Oliveira#Brazil’s National Historic and Artistic Heritage Institute#Scientists#Dark Coca-Cola-Colored Negro River#The Pale Clay-Colored Solimoes River#The Associated Press#Atlantic Ocean Waters | El Niño
3 notes
·
View notes
Text
Ocean Currents
Ocean currents play a crucial role in shaping Earth’s climate, redistributing heat, nutrients, and marine life across the globe. In this extensive discussion, we will delve into the fascinating world of ocean currents, exploring their types, causes, effects, and significance in our planet’s ecosystem. From the powerful global-scale currents to the intricate regional and local flows, we will…

View On WordPress
#Antarctic Bottom Water#Antarctic Circumpolar Current#Atlantic Meridional#Benjamin Franklin#Climate Regulation#El Niño#Indian Ocean#La Niña#Matthew Maury#North Atlantic Gyre#phytoplankton#Sea ICe#Surface currents#The Coriolis effect#the North Pacific Gyre#the South Atlantic Gyre#the South Pacific Gyre#Thermohaline circulation#Tides
0 notes
Text
Some alarming climate news as of June 2023
Antarctica, which is in the dead of winter, has unexpectedly failed to reform its winter sea ice. This is an exceptional deviation from the norm that has left scientists dumbfounded.
The entire NE Atlantic Ocean is experiencing its most significant marine heatwave ever…by far. That area had never been a full 1°C above the 1951-1980 average. It has suddenly jumped to 1.7°C above that average.
A powerful heatwave has overtaken southern North America for weeks on end, with places like Texas and northern Mexico breaking daily record high temperatures.
In the Caribbean Sea and Gulf of Mexico, sea surface temperatures are extremely high. Water temperatures are in the *90s* by the Florida coast, Miami keeps breaking daily record heat index values, and a major coral bleaching event will soon be underway.
The Canadian 2023 Wildfire Season will not let up, with nearly all annual records falling before we even reach the midpoint of the season. No Canadian wildfire season had ever produced 12 terawatts (TW) of fire radiative power. 2023 has produced 18TW.
Dramatic flood events have begun striking various countries around the world simultaneously this week.
El Niño has rapidly developed in recent months as sea surface temperatures across the equatorial east Pacific skyrocket. As of yet, El Niño has not impacted global weather conditions. That will change in a few months.
All of these events have culminated in June 2023, easily being the hottest June in Earth’s recorded history. Likely the hottest June in 115k-120k years when Earth was last this hot.
#important#current events#news#environment#climate#climate change#climate justice#environmentalism#environmental justice#global warming#activism#climate crisis#climate news
4K notes
·
View notes
Text
The Amazon, home to more than 10% of the world’s known biodiversity, has not been spared. The return of El Niño, a band of warm water in the equatorial Pacific Ocean, and record-breaking North Atlantic Ocean temperatures have contributed to one of the most severe droughts recorded in the region’s history, affecting at least 600,000 people and countless plants and animals.
74 notes
·
View notes
Text
‘Extremely worrying’: Drought in Brazil’s Amazon impacting economy and wildlife
This week, Manaus, the largest city in Brazil’s Amazon region, reached a scorching 39.2°C (102.56°F), its hottest day recorded in 30 years. Across northern Brazil, a heat wave and prolonged drought is impacting the local economy, people and wildlife.
In September, the local government in Amazonas declared a state of emergency as wildfires burned across the state. In all, 6,991 blazes were detected last month, the worst month on record for wildfires in the region this year, and the second worst since Brazil started keeping track in 1998. (Only last year was worse, with 8,659 recorded fires in September).
Experts contacted by Brazil Reports attribute the escalating heat and dry conditions to two main factors: A strong El Niño phenomenon and warming waters in the northern tropical portion of the Atlantic Ocean.
“We already had an idea that it was going to get very hot because of these factors. What we didn’t know was that it was going to be an extreme drought,” researcher Ayan Fleischmann told Brazil Reports.
Continue reading.
#brazil#politics#brazilian politics#environmentalism#environmental justice#mod nise da silveira#image description in alt#amazon rainforest
71 notes
·
View notes
Text
For over a year, global ocean temperatures have been consistently shattering records, shocking scientists. Now hurricane watchers are getting even more worried, given that ocean heat is what fuels the biggest, most destructive cyclones. Researchers at the University of Arizona just predicted an extremely active North Atlantic season—which runs from June 1 to the end of November—with an estimated 11 hurricanes, five of them being major (meaning Category 3 or higher, with sustained wind speeds of at least 111 miles per hour). That would dwarf the 2023 season—itself the fourth-most-active season on record—which saw seven hurricanes, three of which intensified into major ones.
“Part of the reason is very warm ocean surface temperatures in the tropical Atlantic Ocean,” says Xubin Zeng, director of the Climate Dynamics and Hydrometeorology Center at the University of Arizona. The other reason is that the Pacific Ocean is transitioning from a warm El Niño, which discourages the formation of Atlantic hurricanes, into cold La Niña, which encourages them. “So those two factors together give us a very active hurricane season prediction for this year.”
As a tropical cyclone grows, scientists measure sustained wind speeds to get an idea of how it’s intensifying. (“Tropical cyclone” is the general term for these storms. The ones that hit the coasts of the US are known as hurricanes.) When the speeds increase by 30 knots (35 miles per hour) or more in 24 hours, that’s considered “rapid intensification.” Last year’s Hurricane Lee, for instance, grew from 70 knots to 116 knots over just 12 hours. Previous research has found a huge increase in this sort of rapid intensification near coastlines since 1980.
And it’ll only get worse from here. A study from another group of scientists, published today in Earth’s Future, finds that across the planet, hurricanes have been intensifying faster and faster. It looked at hurricane behavior near coasts, as opposed to when they’re traveling across the open ocean, and measured intensification generally instead of rapid intensification specifically.
The study found that globally in the last four decades, the tropical cyclone intensification rate has grown by 3 knots per 24 hours. Put another way: We can expect a hurricane today to intensify by 3 extra knots over the course of a day, on average. Between 1979 and 2000, the average rate of intensification increased by 0.37 knots every six hours of a hurricane’s lifespan, rising to 1.15 knots every six hours in the period between 2000 and 2020.
The authors warn that climate change is creating the conditions for plenty more coastal intensification going forward. That, in turn, is making hurricanes more dangerous than ever, as the storm can suddenly intensify close to shore into something fiercer than what emergency agencies were preparing for. “This increase in intensification near the coast is supported by changes in the environment,” says Pacific Northwest National Laboratory climate scientist Karthik Balaguru, lead author of the paper in the journal Earth’s Future. “The projected changes also show increasing intensification of tropical cyclones in a future climate.”
Three main factors converge to intensify hurricanes. The first is that as the world in general warms, so too do the oceans. Water evaporating off the surface rises, releasing heat that fuels the developing hurricane. The warmer a patch of ocean water is, the more energy a cyclone has to exploit. If a hurricane like Lee forms off the coast of Africa, it’s got a lot of Atlantic ocean to feed on as it moves toward the East Coast of the United States. As we approach this year’s hurricane season, tropical Atlantic temperatures remain very high.
The second factor is humidity. As the atmosphere warms, it can hold more water vapor, so some parts of the world are getting more humid. Hurricanes love that, as drier air can lead to cooling and downdrafts that counteract the updrafts that drive the storm. “So long as it remains moist, the storm can strengthen, or maintain its intensity,” says Balaguru. “However, once the core enters into a dry environment or becomes less moist, then the storm will start weakening.”
And lastly, hurricanes hate wind shear, or winds of different speeds and directions at different altitudes. (Think of it like layers of a cake, only made of air.) Instead, cyclones like a stable atmosphere, which allows their winds to get swirling and intensifying. Wind shear can also inject drier air from outside the storm into the core of the hurricane, further weakening it. As the world warms, wind shear is decreasing along the US East Coast and East and South Asia, providing the ideal atmospheric conditions for cyclones to form and intensify. “Under climate change, the upper troposphere is expected to warm up at a higher pace than the surface,” says Balaguru. “This can enhance the stability of the atmosphere and also weaken the circulation in the tropics.”
Nearer term, La Niña conditions in the Pacific could help form and intensify hurricanes this summer. Even though La Niña’s in a different ocean, it tends to suppress winds over the Atlantic, meaning there’s less of the wind shear that hurricanes hate. Hence the University of Arizona’s prediction for an extremely active hurricane season, combined with very high sea surface temperatures in the Atlantic to fuel the storms. By contrast, last year’s El Niño created wind conditions in the Atlantic that discouraged the formation of cyclones.
Even then, Hurricane Lee developed into a monster storm last September. A week before that, Hurricane Idalia rapidly intensified just before slamming into Florida. That sort of intensification close to shore is extraordinarily dangerous. “When the storm is very close to the coast—let's say it's a day or two out—if it then suddenly intensifies rapidly, then it can throw you off guard in terms of preparations,” says Balaguru. A town may have planned its evacuations expecting winds of 100 mph, and suddenly it’s more like 130 mph.
Unfortunately, Balaguru’s new study finds that climatic conditions, particularly near the coast, are becoming more conducive for storm intensification. It’s up to teams like Zeng’s at the University of Arizona to further hone their forecasts to manage that growing risk to coastal populations. “For scientists, seasonal forecasting is a reality check of our understanding,” says Zeng. “We have done pretty well over the past few years, and it's going to give us more confidence.”
3 notes
·
View notes
Text
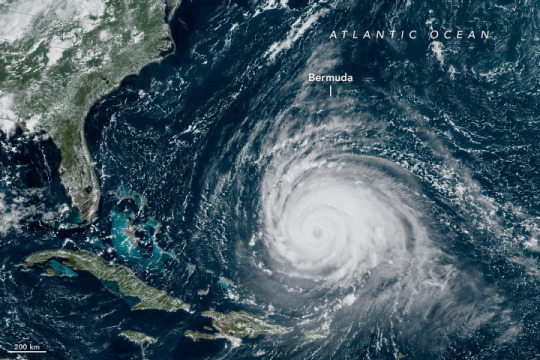
Hurricane Lee Traverses the Warm Atlantic
On September 12, 2023, Hurricane Lee continued its slow west-northwest trajectory across the Atlantic Ocean. The Geostationary Operational Environmental Satellite 16 (GOES-16) acquired this image of the major storm at approximately 1 p.m. Eastern Time (17:00 UTC) as it advanced toward the southeastern United States. The satellite is operated by the National Oceanic and Atmospheric Administration (NOAA); NASA helps develop and launch the GOES series of satellites.
Around this time, the center of the hurricane was located about 500 miles (800 kilometers) south of Bermuda and moving at 6 miles (9 kilometers) per hour. Sustained winds were measured at 115 miles (185 kilometers) per hour, making it a category 3 storm on the Saffir-Simpson hurricane wind scale.
On its path across the ocean to this point, the hurricane fluctuated dramatically in strength, as it underwent one of the most extreme periods of rapid intensification for a North Atlantic storm in the past 40 years. In the 24 hours ending at 2 a.m. Eastern Time (06:00 UTC) on September 8, Lee’s winds increased from 80 to 165 miles per hour (130 to 265 kilometers per hour), escalating it to category 5 status. Only Hurricane Felix in 2007 and Hurricane Wilma in 2005 intensified more over a 24-hour period. Following this ramp-up, moderate to strong wind shear disrupted the storm’s circulation and weakened it to a category 2.
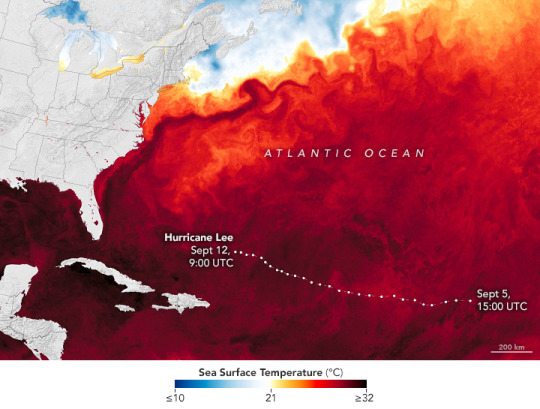
That would not be the last momentum swing, however. On September 10, Hurricane Lee began to regain strength as wind shear abated and it passed over very warm waters. The map above shows sea surface temperatures on from that day based on data from the Multiscale Ultrahigh Resolution Sea Surface Temperature (MUR SST) project, a NASA Jet Propulsion Laboratory effort that blends measurements of sea surface temperatures from multiple NASA, NOAA, and international satellites, as well as ship and buoy observations.
High sea surface temperatures are among the conditions favorable to hurricane intensification. And 2023 has been a banner year for warm oceans. Decades of gradual warming due to climate change, along with El Niño conditions in the Pacific Ocean, helped drive global sea surface temperatures into record territory for several months in the summer.
Meteorologists generally agree that sea surface temperatures above 27.8 degrees Celsius (82 degrees Fahrenheit) will sustain and intensify hurricanes, cyclones, and typhoons. Surface waters above that threshold are shown in red to black on the map.
Forecast models indicate that a weather pattern over the eastern U.S. will redirect Lee to the north. The storm is expected to expand in size and weaken as it moves over cooler waters recently churned up by hurricanes Franklin and Idalia. The storm will likely pass west of Bermuda, which is under a tropical storm watch, and potentially make landfall over the northeastern U.S. or Nova Scotia as a much weaker storm.
NASA Earth Observatory images by Lauren Dauphin, using GOES 16 imagery courtesy of NOAA and the National Environmental Satellite, Data, and Information Service (NESDIS) and data from the Multiscale Ultrahigh Resolution (MUR) project. Story by Lindsey Doermann.
3 notes
·
View notes
Text
Friday, August 25, 2023
Heat records are being smashed in multiple parts of the globe
(Washington Post) As the relentless central U.S. heat wave peaks, intense heat waves are also blasting other regions that have faced unusually hot weather off and on much of the year, particularly in Europe and Asia. Monthly and all-time records are regularly falling in both hemispheres. Southern Europe, focused from Portugal to Italy, is again broiling. France just notched its hottest day on record this late in the year. Numerous other locations saw records for the month of August and all time. It’s supposed to be winter in the Southern Hemisphere, yet in many places in South America and southern Africa it’s feeling like anything but. South America logged its hottest winter temperature on the books Wednesday. East Asia also continues to swelter under unceasing conditions defined by high heat, humidity and stifling nights. Japan in particular has faced unending records lately. More of the same in the United States. The most expansive heat dome of summer is still near its peak over the country’s center, although it should wane this weekend into next week.
Retail theft
(CNN) Retailers across the country have lamented an uptick in theft, and it’s starting to hit their profits harder than usual. On Tuesday, Dick’s Sporting Goods reported a 23% drop in profit, despite sales that rose 3.6% in the period. The company is not the first to report poor earnings this year, but it is one of the first to point the finger primarily at theft. Target said earlier this year that it anticipated a loss of half a billion dollars due to theft, and just last week, about 50 people swarmed a Nordstrom in L.A. and stole about $300K worth of merchandise. Experts say ongoing inflation coupled with job losses are likely contributing to the increase in theft.
At Least 4 Killed, Including Gunman, in Biker Bar Shooting in Southern California
(NYT) At least four people were dead, including a gunman, and six others were injured after a man believed to have been a retired law enforcement officer opened fire at a popular biker bar in Southern California on Wednesday evening as a crowd gathered for a rock music show and spaghetti night, the authorities said. The shooting occurred at about 7 p.m. at Cook’s Corner, a bar in Trabuco Canyon, a rural community in eastern Orange County. A law enforcement official said the suspected gunman, who had retired several years ago from an agency elsewhere in Southern California, had been targeting his estranged wife, who was among the dead. Including this incident, there have been an estimated 457 mass shootings in the U.S. in 2023 so far.
Nicaraguan government bans Jesuit order and says all its property will be confiscated
(AP) Nicaragua’s government on Wednesday declared the Jesuit religious order illegal and ordered the confiscation of all its property. The move comes one week after the government of President Daniel Ortega confiscated the Jesuit-run University of Central America in Nicaragua, arguing it was a “center of terrorism.” It was the latest in a series of increasingly authoritarian actions by the Nicaraguan government against the Catholic Church and opposition figures. The Jesuit order, known as the Society of Jesus, has condemned the measures.
Traffic jam at Panama Canal as water level plummets
(Washington Post) Scores of ships are backing up at the Panama Canal, where low water levels linked to El Niño and climate change have led authorities to restrict travel through one of the world’s most important trade arteries. The traffic jam is a grim sign for a global economy that has been whipsawed by supply-chain challenges—and for American businesses in particular. Around 40 percent of U.S. container traffic moves through the canal that connects the Atlantic and Pacific oceans. The congestion is driving up shipping prices and causing delays in transporting merchandise just as importers are starting to gear up for the Christmas season. To conserve water, canal authorities are limiting the number of ships allowed to make the crossing to 32 per day, down from an average of 36 in normal times. They’ve also imposed weight restrictions on the vessels. Around 50 million gallons of water is required to move each ship through the locks. Only some of it is recycled. Normally, there are up to 90 ships waiting to enter the canal; this week, there were more than 120. Earlier this month, as many as 160 ships sat idling.
At least 1 person is dead and 2 are missing as Tropical Storm Franklin batters Dominican Republic
(AP) Tropical Storm Franklin unleashed heavy floods and landslides in the Dominican Republic on Wednesday after making landfall in the country’s southern region, killing at least one person and leaving two others missing. The storm began to slowly spin away late Wednesday afternoon from the island of Hispaniola that the Dominican Republic shares with Haiti after dumping heavy rain for several hours. Forecasters warned the storm could drop up to 12 inches (30 centimeters) of rain in the Dominican Republic, with a maximum of 16 inches (41 centimeters) for the country’s western and central regions. Meanwhile, up to 4 inches (10 centimeters) of rain are forecast for Haiti, with nearly 8 inches (20 centimeters) for the country’s eastern regions.
Argentina arrests dozens in looting attempts amid fear of growing violence ahead of October election
(AP) Argentine authorities have reported a large number of arrests for lootings and attempted lootings in recent days, raising concerns about violence ahead of October presidential elections and prompting the president to appeal for calm. The arrests have prompted some business owners to prepare for the possibility that their stores could get ransacked. Buenos Aires provincial authorities said Wednesday that 94 people had been detained in what were more than 150 looting attempts since Monday following days of isolated incidents of looting in the central Córdoba, western Mendoza and southern Neuquén provinces over the weekend. Looting holds a special significance in Argentina because it was widespread in 2001, when the country suffered a spectacular economic collapse.
Greece Battles Its Most Widespread Wildfires on Record
(NYT) Wildfires ravaged northern Greece for a fifth consecutive day on Wednesday and forced the evacuation of settlements on the outskirts of the capital, Athens. The authorities said they were battling scores of blazes around the country after weeks of searing heat turned many areas into tinderboxes. “It is the worst summer for fires since records began,” said Vassilis Kikilias, the civil protection minister. In villages in the northeastern Evros region, desperate residents on foot or riding scooters rushed to beat back fires only to watch bigger ones rise up around them. Exhausted firefighters used trucks and water-scooping helicopters to tackle the rapid advance of a blaze in one spot while flames grew out of control in another. By Wednesday evening, it was clear that on both major fronts for the wildfires, in the north and near Athens, they remained largely uncontrolled.
Ukraine Just Blew Up Russia’s Main Missile Base In Occupied Crimea
(Forbes) After capturing Ukraine’s Crimean Peninsula in February 2014, the Russian armed forces established a major missile base on Cape Tarkhankut in western Crimea. There, the Russians deployed an S-400 surface-to-air missile battery, a battery armed with Bastion anti-ship cruise missiles and a suite of radars. Assisted by the radar, the S-400 battery could threaten aerial targets as far away as 250 miles—covering the entire western Black Sea—while the Bastion could hit ships at a distance of 190 miles or so. It’s not unfair to call the Cape Tarkhankut site the linchpin of Russian air and naval defenses across the Black Sea and Crimea. Which is why, on Wednesday, the Ukrainian armed forces blew it up. We don’t know exactly what happened, but we do know this: around 10:00 A.M. on Wednesday, local time, a series of explosions rocked the cape. The Bastion battery was hit, the S-400 battery and its crew was wiped out, and it’s hard to imagine the radars escaped attention too.
Their Seoul Just Wasn’t In The Drills
(Reuters) On Wednesday, South Korea held its first nationwide air raid drills in six years. While the country’s air raid sirens worked perfectly, it appears that the people they were designed to protect didn’t care. At 2 p.m. local time, citizens across South Korea were ordered to stop what they were doing and seek shelter at nearby air raid shelters. According to multiple sources on the ground (and in underground shelters), most people simply continued about their days, refusing to take the time to follow orders. The drills are an extension of civil defense exercises launched in 1969. South Korea is home to over 17,000 “shelters” nationwide, most of which are just apartment basements or subway stations that might provide citizens a bit of shelter against a theoretical air attack.
China bans seafood from Japan after the Fukushima nuclear plant begins its wastewater release
(AP) The tsunami-wrecked Fukushima Daiichi nuclear power plant ‘s operator says it began releasing its first batch of treated radioactive water into the Pacific Ocean on Thursday—a controversial step that prompted China to ban seafood from Japan. In response to the release, Chinese customs authorities banned seafood from Japan, customs authorities announced Thursday. The ban started immediately and will affect all imports of “aquatic products” including seafood, according to the notice.
China’s property crisis leaves Country Garden with unpaid workers, silent sites
(Reuters) At an unfinished Country Garden residential complex on the outskirts of the northern Chinese metropolis of Tianjin, construction has slowed to a dull whirr and a few idle workers roam a near-empty site. “They haven’t paid us since Chinese New Year (in January). We are all worried,” said a laborer surnamed Wang, 50, who said he had stopped work at the Yunhe Shangyuan site last week. The sprawling complex is one of two projects Reuters visited last week in Tianjin, a port city of 14 million people about 135 km (84 miles) southeast of Beijing. Both sites are run by Country Garden, China’s largest developer by sales volume before this year, now mired in a debt crisis threatening to spill over to the wider economy. Construction had partially or fully stopped at both sites—the larger one with a few rows of unfinished five-storey apartment blocks and the other with lifeless cranes and thick green scaffolding hanging over skeletal high-rises. Workers at dorms on the sites complained of months without pay.
Myopia
(Wired) In 2010, Taiwan launched a strategy called Tian-Tian 120 to address rising rates of myopia among youth, pushing kids to spend 120 minutes outside, given that spending time outdoors is pretty much the only thing linked to reducing rising rates of nearsightedness. It’s worked: Nearsightedness peaked in 2011 at 50 percent among Taiwanese primary school children, and has declined to 46.1 percent. That could be a framework for the rest of the world; in 2012, 96.5 percent of 19-year-old men in Seoul were nearsighted, in the U.S. and Europe myopia rates have risen sharply, and by 2050 half the world is expected to need glasses.
Many Americans report interacting with dead relatives in dreams or other ways
(Pew Research Center) Many Americans report that their relationships with loved ones continue past death in some way, according to a recent Pew Research Center survey. Around half of U.S. adults (53%) say they’ve ever been visited by a dead family member in a dream or some other form. And substantial shares say they’ve had interactions with dead relatives in the past 12 months: 34% have “felt the presence” of a dead relative. 28% have told a dead relative about their life. 15% have had a dead family member communicate with them. In total, 44% of Americans report having at least one of these three experiences in the past year.
2 notes
·
View notes
Text
Hotter sea surface temperatures can lead to more evaporation and thus more rainfall. It can change wind patterns, so some places can get wetter while others get drier. Meanwhile, more heat causes the ocean itself to expand, which already accounts for one-third to one-half of global sea level rise.
Water temperature has huge effects on life in the ocean, too. As water heats up, it holds onto less oxygen and can suffocate fish. Hot water was a factor in thousands of dead Menhaden fish washing up on a beach in Texas earlier this month.
Warm water at the surface also slows upwelling, a critical mechanism that brings nutrients from deep in the ocean to the surface, nourishing life. Half of the world’s fish are caught in upwelling regions, so higher sea surface temperatures could lower the output of fisheries.
Another consequence of higher temperatures is that it makes water more acidic, accelerating ongoing ocean acidification that’s occurring as the seas absorb more carbon dioxide. And along with fertilizer runoff, hotter temperatures in the Atlantic, specifically, are contributing to record blooms of sargassum, a smelly, toxic seaweed that’s now fouling beaches in Florida and in the Caribbean.
This is happening on top of all the other ways humans are stressing the ocean: overfishing, pollution, and habitat destruction.
2 notes
·
View notes
Text
2024 Texas Hurricane Season Predictions
2024 Texas Hurricane Season Predictions
Predictions Show a Very Active Hurricane Season
Texans well know about the damaging high winds and flash flooding from tropical storms. This year's TX hurricane predictions show a very active season. Learn why this season could be one of the toughest.
Apart from hot summers, one thing Texans know all too well about is hurricane season. Flooded streets, damaged roofs, and your Texas electricity is out. Towns hit hard in the past like Rockport, Port Arthur, Houston and others shudder when skies darken over the Gulf of Mexico. This season's hurricane predictions look like it could be another tough one.
Officially, the Atlantic hurricane season begins on June 1 and runs through the end of November. But due to the potential for global economic disruptions from these powerful storm systems, everyone wants to know how to prepare well in advance.
AccuWeather's March 27 forecast warns of an "explosive season" where forecasters may even run out of names.
Tropical Storm Risk (TSR), which makes forecasts in December, released their updated prediction on April 8.
Colorado State University researchers released their annual hurricane forecast on April 8, also.
NOAA's Climate Prediction Center (CPC) usually releases forecasts in late May.
Given this past year's record warm temperatures and a La Niña expected to emerge in the Pacific Ocean, these weather services now expect "a very active" hurricane season ahead.
Are Hurricane Predictions Accurate?
Bear in mind that storm predictions are based on the probability for the environment to spin up tropical storms. So, predicted storm numbers are not iron-clad. But while some year's predict too many; in the past 30 years, we're seeing predictions fall short. For example, the 2023 hurricane season forecast only 13 tropical storms. But due exceptional warm sea surface temperatures, there were 20 and it became the fourth most active season on record. Dire-sounding, true but of the 20 tropical storms that formed, only three made landfall in North America. Several stayed at sea and disipated as they wandered north.
However, there have been more extremely active hurricane seasons since 1995 than there has been since 1900. And two of the most active seasons occurred in 2005 with 28 storms and 2020 with 30 -- eleven of which made landfall in the US causing $37 billion in damage.
With all that in mind, the 23 tropical storms predicted this year is twice as many tropical storms that occur during a statistically "normal" season. And this makes the consensus for the potential number of storms compelling. As we'll see, conditions going into the 2024 season have more in common with 2020 than last year.
Why So Many Storms?
Tropical storm systems need three things to spin up:
LOTS of calm, warm water. Sea surface temperatures (SSTs) at least 80°F (26.5°C) to a depth of about 150 feet.
Dry, thirsty air. When a firm, dry trade wind blows across warm sea water (at about 11 mph), it has an easy time evaporating that water and taking on its heat. As this warm, humid air begins to move upwards and organize, it can quickly develop into a moist and unstable atmosphere that supports sustained shower and thunderstorm activity.
A nice, calm upper atmosphere. Tropical storms like winds that move horizontally and spiral up in nice, stacked layers (stack of pancakes). Vertical winds that cut or shear across that horizontal structure can tear it apart. Wind shearing happens everywhere but as long as it's about 23 mph from the ocean surface all the way up to around 60,000 feet, the tropical storm will be fine.
The ENSO (El Niño/Southern Oscillation) also plays a role. To be clear, El Niño, ENSO Neutral, and La Niña don’t prevent or cause hurricanes. Rather, it is an ocean-atmosphere system at the equator in the Pacific Ocean that can shift atmosphere's circulation (called the "Walker Circulation"). El Niños usually produce wind shears in the Atlantic that blow apart tropical storms or shift them to the middle of Atlantic (as we saw in 2023). ENSO Neutral and La Niñas, however, shift those wind-shear patterns far to the east, leaving a nice, calm upper atmosphere over the Atlantic where tropical storms develop.
Current Conditions
This past February saw record global temperatures, especially in the Atlantic Ocean. Currently, sea surface temperatures remain warm. In fact, there's a band of 80°F (26.5°C) water stretching all way from west Africa to the west coast of Cuba. All three hurricane predictions cite warmer than normal SSTs as a reason for more storms. And given NOAA's temperature predictions for the summer, it looks like much of the US Atlantic coast will stay like bathwater. That may sound like good news for beach goers (and sharks) but it's also perfect for building tropical storms.
There is a lot of dry air coming off the African west coast. Actually, too much right now. The Saharan Air Layer (SAL) lies about 5,000 and 20,000 feet up in the sky that transports plumes of dry, dust-laden air from west Africa to as far west as Texas. It usually forms in the late spring/early summer when hot dry winds blow across the Sahara desert and move over the Atlantic Ocean. As result the SAL can impede tropical storm formation:
Big dust plumes can warm the atmosphere but block sunlight from warming the ocean surface below. That reduces evaporation.
The dry air can create down drafts or sinking air. These can interfere with moist air rising and organizing into low pressure systems.
SAL winds are strong enough to carry dust. So, their winds can also produce vertical wind shears that blow out storm formation.
Although the SAL begins in the spring it don't blow all summer long. All the same, in both 2022 and 2023, the SAL helped keep a lid on storm formation for about 2 months. The pattern peaks in June and fades in early August. Each plume usually last 3 to 5 days. But once the SAL pattern ends, a warm ocean can spin up a storm in only a few days, if not hours.
All three hurricane predictions also cite the weakening El Niño. This shows that sea surface temperatures in the middle of the Pacific Ocean at the equator are getting cooler. NOAA predicts that they expect ENSO Neutral conditions between April and June. Already, cooler water temperatures as deep as 200 feet are being detected in the eastern Pacific. So change is coming.
While ENSO Neutral means there's no giant mass of warm or cold water in the Pacific affecting the atmosphere, it allows other atmospheric conditions to exert a bigger influence on hurricane seasons. From 2016 through 2020, summer time ENSO Neutral conditions produced some of the most active hurricane seasons on record. In fact, some of the biggest and deadliest storms to hit the US occurred during ENSO Neutral conditions: Hurricane Harvey (2017), Hurricanes Katrina and Rita (2005), and Tropical Storm Alison (2001).
NOAA predicts 70% to 80% chance for La Niña will emerge in August. Again, all three hurricane predictions suggest a La Niña can produce conditions that spawn the most tropical storms will most likely align. And in many ways, this suggests similarities to the 2020 season.
Hurricane season 2020 also began with above average sea surface temperatures in the Atlantic. Trade winds were weak across most of the Atlantic. ENSO Neutral was firmly in place and would slowly turn into La Niña by autumn; so there was little wind shear. Some tropical storms first formed at a liesurely pace from mid-May to June. But in mid-July, storm systems began forming in bursts. The most occured in September. At one point there were five named storms spinning in the Atlantic. All told, 2020 saw 30 tropical storms. Eleven struck the US; six of them were hurricanes.
So August and September could be dangerously busy.

Learn what's driving hurricane predictions this summer and what you need to know to stay safe.
Predictions for a Hurricane Hitting the US in 2024
Because hurricanes are creatures of heat, water, and wind they are reliably unpredictable. Once they spin up we can only guess where they probably will go. After all, these storm systems form in an area that stretches from the west coast of Africa all the way to the western shore of the Gulf of Mexico. That said, given the number and potential strength of the storms forecast and the things that sustain their formation, it's logical to anticipate a few coming ashore. But, predicting just how many with any accuracy is a dicey gamble.
While weather services do their best to tease details out of the hundred or so years of record keeping, most won't forecast the number and locations of landfalls.
NOAA predictions usually don't predict landfalls.
CSU also does not predict the number of landfalls but estimates probability. For example, this year, they estimate a 62% chance for a storm making landfall somewhere along the the entire (Atlantic) US coastline.
Accuweather forecast that the US will see 4-6 direct impacts.
TSR says 4.6 tropical storms or hurricanes will come ashore.
One other important thing to remember here is that electricity prices in Texas could surge if tropical storms shut down off-shore natural gas production in the Gulf of Mexico. Some natural gas platforms are located more than 100 miles from shore.
Tropical Storms - What Are the Biggest Dangers?
Tropical storms and hurricanes can unlease three dangerous events: storm surges, high winds, and flooding.
Coastal residents face the greatest danger from storm surges. Because of increasingly higher tides, storm surges are now more likely to cause flooding in any coastal city, including those in major bays and estuaries. Texas and other Gulf coast states have seen past storm surges as high a 10 to 24 feet deep that move inland for miles. So residents living on the coast will face a good chance of needing to evacuate at some point this summer.
Because water and heat fuel these storms, they lose power once they move inland. That doesn't mean they're any less dangerous. For those who live further inland, high winds, tornados, and flooding are all potential dangers. Weakened cyclones can turn into slow moving storm systems that dump enormous amounts of rain as they go. This makes flash flooding more likely and extremely dangerous in areas like central and west Texas.
How You Can Prepare for the 2024 Texas Hurricane Season
Texas Electricity Ratings is a Houston company. We've all been through the high winds, rain, and electricity outages from some very tough hurricanes. These powerful storms can affect any part of Texas so we want everyone to stay safe. Find out now what you can do to keep your family safe when the power goes out well before the first big storm comes.
Make a plan so your family knows for what to do when a dangerous storm comes your way.
Make a Hurricane Emergency Checklist to help you keep track of how to prepare and what supplies you'll need if you choose to shelter in place.
Build your hurricane disaster kit. Make sure every person and pet in your home has everything they need to get through a disaster.
Gather essential stuff for your Grab-N-Go bag. Each person (and pet) should have their own in case you need to leave your home and evacuate to stay safe.
Review and understand Texas evacuation routes ahead of time. Make arrangements well ahead of time where you’ll go to in the event of an evacuation order.
0 notes
Text
Just to Know!
The Amazon Rainforest, often referred to as the " “lungs of the earth," is currently facing an unprecedented and severe drought.
This environmental crisis is causing significant disruptions to the lives of Indigenous people, impacting the entire ecosystem.
The El Niño phenomenon is identified as one of the key drivers of drought in the Amazon.It results in abnormal warming of the surface waters of the Pacific Ocean, which subsequently affects rainfall patterns.
In the Amazon region, El Niño leads to decreased humidity and reduced rainfall, exacerbating drought conditions.
Another weather phenomenon is the unusually high water temperatures in the northern tropical Atlantic Ocean.
Due to warmer ocean waters, heated air rises into the atmosphere, which then reaches the Amazon rainforest. The warm air inhibits the formation of clouds, causing rainfall to drop sharply.
Human-induced climate change is making the situation worse.
Deforestation, primarily caused by activities like agriculture and logging, hampers the Amazon's ability to regulate climate and retain moisture.
#general knowledge#affairsmastery#generalknowledge#current news#environmental issues#environment#climate change#ecology#environmentalism#climate crisis#current events#world news#global warming#deforestation
0 notes
Text
Hurricane season to test Miami's battle against urban flooding - AccuWeather.com
As another Atlantic hurricane season is underway, some Miami residents are raising concerns about the urban flooding that could come with it. The climate phenomenon El Niño, which occurs when water temperatures are above the historical average across central and eastern parts of the Pacific Ocean...
0 notes
Text
Climate change is a complex issue that is influenced by many factors, both natural and human-caused. Here are 20 major causes of climate change, along with their estimated percentage contribution to overall global warming:
1. Carbon dioxide (CO2) emissions from burning fossil fuels (coal, oil, and gas) for energy and transportation - responsible for approximately 65% of global warming.
2. Deforestation and land use changes, particularly in tropical regions where forests are being cleared for agriculture, mining, and other purposes - responsible for approximately 10% of global warming.
3. Methane (CH4) emissions from livestock production, agricultural practices such as rice cultivation, and natural gas production and distribution - responsible for approximately 16% of global warming.
4. Nitrous oxide (N2O) emissions from fertilizer use in agriculture, industrial processes, and other sources - responsible for approximately 6% of global warming.
5. Fluorinated gases (e.g. hydrofluorocarbons, perfluorocarbons, and sulfur hexafluoride) used in refrigeration, air conditioning, and other industrial processes - responsible for approximately 3% of global warming.
6. Black carbon (or soot) from the incomplete combustion of fossil fuels and biomass - responsible for approximately 1% of global warming.
7. Changes in land use and land cover, such as urbanization and desertification - responsible for approximately 1% of global warming.
8. Aerosols, including soot, dust, and other particles emitted by human activities and natural sources - responsible for approximately -0.5% of global warming (they have a cooling effect).
9. Solar radiation, including changes in the sun's intensity and output - responsible for approximately 0.1% of global warming.
10. Volcanic eruptions, which release greenhouse gases and aerosols that can have both warming and cooling effects depending on the type and amount of gas and particles emitted - responsible for approximately 0.1% of global warming.
11. Changes in ocean currents and circulation, which can affect the distribution of heat and carbon within the ocean and the atmosphere - estimated contribution to global warming is uncertain.
12. Changes in atmospheric circulation patterns, such as the El Niño Southern Oscillation (ENSO) and the North Atlantic Oscillation (NAO) - estimated contribution to global warming is uncertain.
13. Changes in permafrost and other frozen soils, which can release methane and carbon dioxide as they thaw - estimated contribution to global warming is uncertain.
14. Changes in the albedo (reflectivity) of the Earth's surface, particularly in polar regions where melting ice and snow can expose darker surfaces that absorb more solar radiation - estimated contribution to global warming is uncertain.
15. Changes in the amount and timing of precipitation, which can affect the distribution of water resources and the productivity of ecosystems - estimated contribution to global warming is uncertain.
16. Changes in the carbon cycle, including the uptake and release of carbon by the ocean, terrestrial vegetation, and soil - estimated contribution to global warming is uncertain.
17. Changes in the intensity and frequency of natural disasters, such as hurricanes, floods, and wildfires, which can impact ecosystems, infrastructure, and human well-being - estimated contribution to global warming is uncertain.
18. Changes in land use and land cover, such as urbanization and agricultural expansion, which can alter the Earth's surface energy balance and carbon cycle - estimated contribution to global warming is uncertain.
19. Changes in the composition and behavior of atmospheric aerosols, including their interaction with clouds and radiation - estimated contribution to global warming is uncertain.
20. Changes in population dynamics and human behavior, including consumption patterns, technological innovation, and policy decisions - estimated contribution to global warming is uncertain and highly dependent on future developments.
It's important to note that these estimates are based on current scientific understanding, and that the relative contributions of these factors may vary depending on the specific region and timeframe being considered. Additionally, some of these factors may have indirect effects on global warming through their influence on other factors, such as changes in precipitation patterns or the melt rate of glaciers and ice caps.

0 notes
Text
By Georgina Rannard, Erwan Rivault, Jana Tauschinski
BBC climate reporter & data team
BBC
July 22, 2023
A series of climate records on temperature, ocean heat, and Antarctic sea ice have alarmed some scientists who say their speed and timing is unprecedented.
Dangerous heatwaves in Europe could break further records, the UN says.
It is hard to immediately link these events to climate change because weather - and oceans - are so complex.
Studies are under way, but scientists already fear some worst-case scenarios are unfolding.
"I'm not aware of a similar period when all parts of the climate system were in record-breaking or abnormal territory," Thomas Smith, an environmental geographer at London School of Economics, says.
"The Earth is in uncharted territory" now due to global warming from burning fossil fuels, as well as heat from the first El Niño - a warming natural weather system - since 2018, says Imperial College London climate science lecturer Dr Paulo Ceppi.
Here are four climate records broken so far this summer - the hottest day on record, the hottest June on record globally, extreme marine heatwaves, record-low Antarctic sea-ice - and what they tell us.

The world experienced its hottest day ever recorded in July, breaking the global average temperature record set in 2016.
Average global temperature topped 17C for the first time, reaching 17.08C on 6 July, according to EU climate monitoring service Copernicus.
Ongoing emissions from burning fossil fuels like oil, coal, and gas are behind the planet's warming trend.
This is exactly what was forecast to happen in a world warmed by more greenhouse gases, says climate scientist Dr Friederike Otto, from Imperial College London.
"Humans are 100% behind the upward trend," she says.
"If I'm surprised by anything, it's that we're seeing the records broken in June, so earlier in the year. El Niño normally doesn't really have a global impact until five or six months into the phase," Dr Smith says.
El Niño is the world's most powerful naturally occurring climate fluctuation. It brings warmer water to the surface in the tropical Pacific, pushing warmer air into the atmosphere. It normally increases global air temperatures.
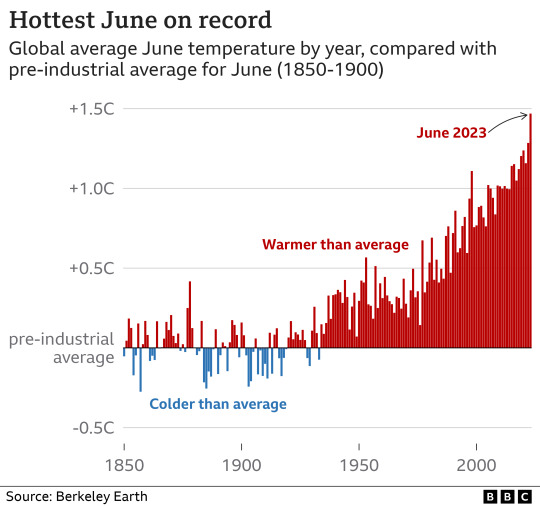
The average global temperature in June this year was 1.47C above the typical June in the pre-industrial period. Humans started pumping greenhouse gases into the atmosphere when the Industrial Revolution started around 1800.
Asked if summer 2023 is what he would have forecasted a decade ago, Dr Smith says that climate models are good at predicting long-term trends but less good at forecasting the next 10 years.
Four ways climate change is affecting the weather
"Models from the 1990s pretty much put us where we are today. But to have an idea about what the next 10 years would look like exactly would be very difficult," he says.
"Things aren't going to cool down," he adds.
Extreme marine heatwaves
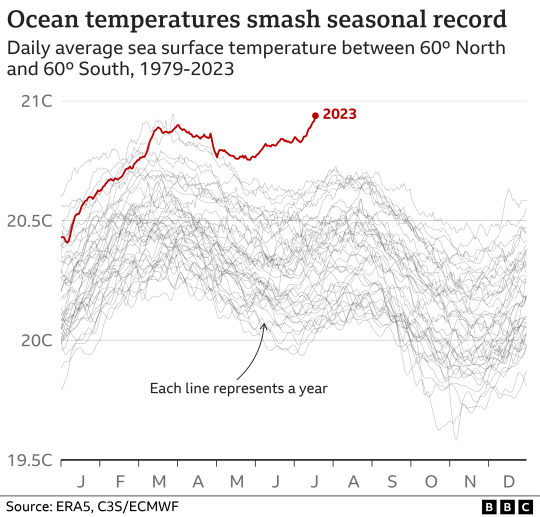
The average global ocean temperature has smashed records for May, June and July. It is approaching the highest sea surface temperature ever recorded, which was in 2016.
But it is extreme heat in the North Atlantic ocean that is particularly alarming scientists.
"We've never ever had a marine heatwave in this part of Atlantic. I had not expected this," says Daniela Schmidt, Prof of Earth Sciences at the University of Bristol.
Marine heatwave in the North Atlantic
Daily sea surface temperature April - July 2023, compared with 1985-1993 average
Press play to see the map animated. (Go to original article)
In June temperatures off the west coast of Ireland were between 4C and 5C above average, which the National Oceanic and Atmospheric Administration classified as a category 5 heatwave, or "beyond extreme".
Sudden heat increase in seas around UK and Ireland
Directly attributing this heatwave to climate change is complex, but that work is ongoing, Prof Schmidt says.
What is clear is that the world has warmed and the oceans have absorbed most of that heat from the atmosphere, she explains.
"Our models have natural variability in them, and there are still things appearing that we had not envisaged, or at least not yet," she adds.
She emphasises the impact of this heat on marine ecosystems, which produce 50% of the world's oxygen.
"People tend to think about trees and grasses dying when we talk about heatwaves. The Atlantic is 5C warmer than it should be - that means organisms need 50% more food just to function as normal," she says.
Record low Antarctic sea-ice
The area covered by sea-ice in the Antarctic is at record lows for July. There is an area around 10 times the size of the UK missing, compared with the 1981-2010 average.
Alarm bells are ringing for scientists as they try to unpick the exact link to climate change.
A warming world could reduce levels of Antarctic sea-ice, but the current dramatic reduction could also be due to local weather conditions or ocean currents, explains Dr Caroline Holmes at the British Antarctic Survey.
She emphasises it is not just a record being broken - it is being smashed by a long way.
"This is nothing like anything we've seen before in July. It's 10% lower than the previous low, which is huge."
She calls it "another sign that we don't really understand the pace of change".
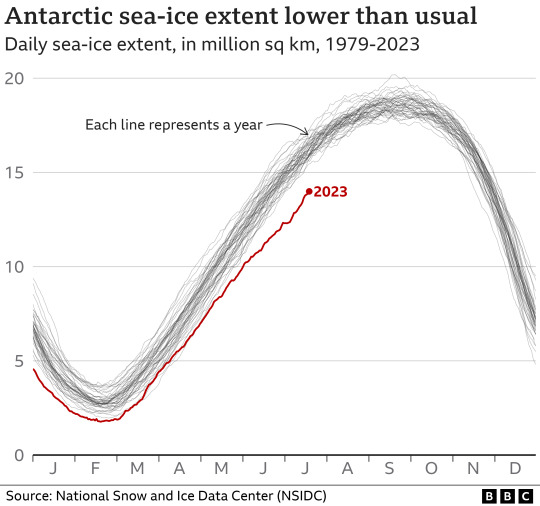
Scientists believed that global warming would affect Antarctic sea-ice at some point, but until 2015 it bucked the global trend for other oceans, Dr Holmes says.
"You can say that we've fallen off a cliff, but we don't know what's at the bottom of the cliff here," she says.
"I think this has taken us by surprise in terms of the speed of which has happened. It's definitely not the best case scenario that we were looking at - it's closer to the worst case," she says.
We can certainly expect more and more of these records to break as the year goes on and we enter 2024, scientists say.
But it would be wrong to call what is happening a "climate collapse" or "runaway warming", cautions Dr Otto.
We are in a new era, but "we still have time to secure a liveable future for many", she explains.
21 notes
·
View notes
Text
Climate ‘Teleconnections’ May Link Droughts and Fires Across Continents
New research could help countries forecast and collaborate to deal with dry spells and fires
— By Nikk Ogasa | February 13, 2023 | Science News
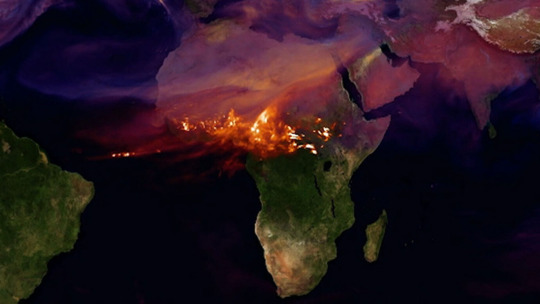
The El Niño climate pattern across the equatorial Pacific Ocean typically causes rainfall to decrease and wildfires to become more frequent in tropical Africa (shown). NASA's Goddard Space Flight Center
Large-scale climate patterns that can impact weather across thousands of kilometers may have a hand in synchronizing multicontinental droughts and stoking wildfires around the world, two new studies find.
These profound patterns, known as climate teleconnections, typically occur as recurring phases that can last from weeks to years. “They are a kind of complex butterfly effect, in that things that are occurring in one place have many derivatives very far away,” says Sergio de Miguel, an ecosystem scientist at Spain’s University of Lleida and the Joint Research Unit CTFC-Agrotecnio in Solsona, Spain.
Major droughts arise around the same time at drought hot spots around the world, and the world’s major climate teleconnections may be behind the synchronization, researchers report in one study. What’s more, these profound patterns may also regulate the scorching of more than half of the area burned on Earth each year, de Miguel and colleagues report in the other study.
The research could help countries around the world forecast and collaborate to deal with widespread drought and fires, researchers say.
The El Niño-Southern Oscillation, or ENSO, is perhaps the most well-known climate teleconnection (SN: 8/21/19). ENSO entails phases during which weakened trade winds cause warm surface waters to amass in the eastern tropical Pacific Ocean, known as El Niño, and opposite phases of cooler tropical waters called La Niña.
These phases influence wind, temperature and precipitation patterns around the world, says climate scientist Samantha Stevenson of the University of California, Santa Barbara, who was not involved in either study. “If you change the temperature of the ocean in the tropical Pacific or the Atlantic … that energy has to go someplace,” she explains. For instance, a 1982 El Niño caused severe droughts in Indonesia and Australia and deluges and floods in parts of the United States.
Past research has predicted that human-caused climate change will provoke more intense droughts and worsen wildfire seasons in many regions (SN: 3/4/20). But few studies have investigated how shorter-lived climate variations — teleconnections — influence these events on a global scale. Such work could help countries improve forecasting efforts and share resources, says climate scientist Ashok Mishra of Clemson University in South Carolina.
In one of the new studies, Mishra and his colleagues tapped data on drought conditions from 1901 to 2018. They used a computer to simulate the world’s drought history as a network of drought events, drawing connections between events that occurred within three months of each other.
The researchers identified major drought hot spots across the globe — places in which droughts tended to appear simultaneously or within just a few months. These hot spots included the western and midwestern United States, the Amazon, the eastern slope of the Andes, South Africa, the Arabian deserts, southern Europe and Scandinavia.
“When you get a drought in one, you get a drought in others,” says climate scientist Ben Kravitz of Indiana University Bloomington, who was not involved in the study. “If that’s happening all at once, it can affect things like global trade, [distribution of humanitarian] aid, pollution and numerous other factors.”
A subsequent analysis of sea surface temperatures and precipitation patterns suggested that major climate teleconnections were behind the synchronization of droughts on separate continents, the researchers report January 10 in Nature Communications. El Niño appeared to be the main driver of simultaneous droughts spanning parts of South America, Africa and Australia. ENSO is known to exert a widespread influence on precipitation patterns (SN: 4/16/20). So that finding is “a good validation of the method,” Kravitz says. “We would expect that to appear.”
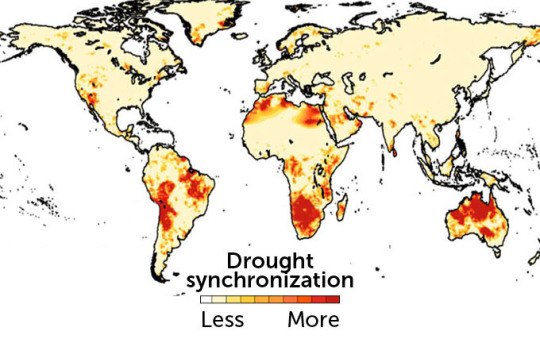
Where Drought Hot Spots are Found. In Sync! Climate teleconnections like the El Niño-Southern Oscillation may influence the onset of droughts at about the same time at hot spots around the world. These hot spots are shown on this map in red, with darker shades indicating areas that are more prone to drought synchronization.
In the second study, published January 27 in Nature Communications, de Miguel and his colleagues investigated how climate teleconnections influence the amount of land burned around the world. Researchers knew that the climate patterns can influence the frequency and intensity of wildfires. In the new study, the researchers compared satellite data on global burned area from 1982 to 2018 with data on the strength and phase of the globe’s major climate teleconnections.
Variations in the yearly pattern of burned area strongly aligned with the phases and range of climate teleconnections. In all, these climate patterns regulate about 53 percent of the land burned worldwide each year, the team found. According to de Miguel, teleconnections directly influence the growth of vegetation and other conditions such as aridity, soil moisture and temperature that prime landscapes for fires.
The Tropical North Atlantic teleconnection, a pattern of shifting sea surface temperatures just north of the equator in the Atlantic Ocean, was associated with about one-quarter of the global burned area — making it the most powerful driver of global burning, especially in the Northern Hemisphere.
These researchers are showing that wildfire scars around the world are connected to these climate teleconnections, and that’s very useful, Stevenson says. “Studies like this can help us prepare how we might go about constructing larger scale international plans to deal with events that affect multiple places at once.”
— Nikk Ogasa is a staff writer who focuses on the physical sciences for Science News. He has a master's degree in geology from McGill University, and a master's degree in science communication from the University of California, Santa Cruz.
0 notes
Text
As global temperatures rapidly climb, humanity is seeing more and more of the disastrous effects scientists warned us about: fiercer heat waves, more intense wildfires, and heavier rain. The extremes of the past few months are but a preview of the ever-worsening pain we’ll endure if we don’t dramatically reduce carbon emissions.
“We have certainly had unusually large extremes in a number of parts of the world,” says climate scientist Zeke Hausfather of the research group Berkeley Earth. “Global temperatures, sea surface temperatures—particularly the North Atlantic region—was sort of off the charts. Antarctic sea ice has been exceptionally low. If you had asked me what I expected to see this summer, it would not have been quite this coincidence of extremes.”
What’s made this summer so bad? For one thing, the base layer of global warming makes extreme summer heat both more common and more severe than it normally would be. Plus, this summer the Pacific Ocean transitioned from the cooler waters of La Niña into the warmer waters of El Niño, which goes on to influence Earth’s climate globally.
Scientists are also investigating how Saharan dust has played a role: Normally, it blows over the Atlantic Ocean during the summer. But there’s been less of it in 2023, allowing more of the sun’s energy to heat the water. New shipping regulations have also cut down on sulfur emissions, and that may have similarly cleared the air. “Disentangling all the specific drivers of the extremes we are seeing this summer is going to take researchers some time,” says Hausfather.
But the 10 maps and graphs below vividly illustrate the global climatic chaos that’s unfolding now.
1. Record Temperatures Around the World
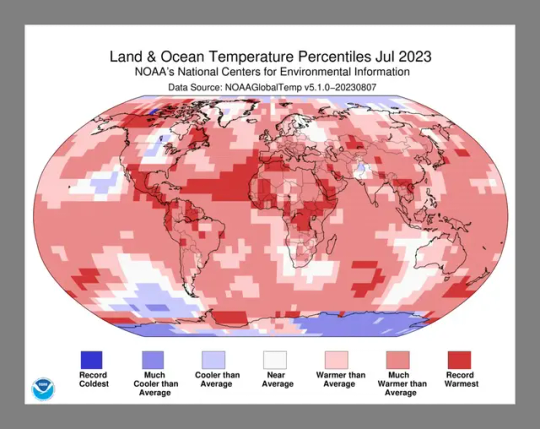
This June was the hottest on record, according to NASA. Then July came around, clocking in as not only the hottest July, but the hottest month period since recordkeeping began in 1880. “What we're seeing is not just this year that records are being broken, but we're seeing these record-breaking events occur more frequently, which is what research has shown we should expect to happen in response to anthropogenic climate change in certain regions,” says University of Chicago climate scientist Tiffany Shaw.
In the map above, the National Oceanic and Atmospheric Administration shows July’s unrelenting worldwide heat. The darkest red—around Mexico and Central America, northern Canada and Alaska, and equatorial Africa—shows areas that logged record-high July temperatures. Lighter red indicates an area was much warmer than average, while the faint red indicates it was simply warmer than average. Less than 1 percent of the world’s surface had a record-cold July, according to NOAA.
2. Global July Temperatures Plotted Through 2023
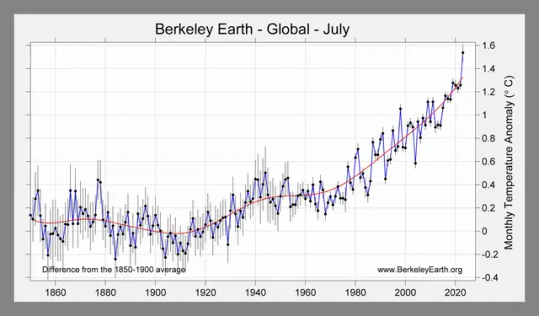
Here’s another way of looking at July temperature anomalies, in this chart from Berkeley Earth. The global mean temperature in July was 1.54 degrees Celsius above the average between the years 1850 and 1900. (That time period is used as a benchmark for the preindustrial period.)
When the Paris Climate Agreement talks set a goal that humanity would try to hold temperatures to 1.5 degrees C above preindustrial levels, that meant sustained temperatures. That is, this July may have hit 1.54 above preindustrial temperatures, but overall the world has warmed 1.1 degrees C above them.
But as you can see in the Berkeley Earth graph, the July 2023 temperature (farthest right) leapt far above previous years. It beat the previous record, from July 2019, by 0.26 degrees C. So while the Paris Agreement target hasn’t been exceeded yet in terms of averages over many years, the Berkeley Earth report concludes, “isolated anomalies above 1.5 °C are a sign that the Earth is getting close to that limit.”
3. Heat Domes Over the US
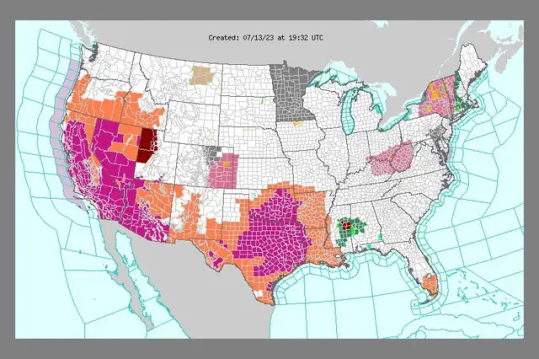
In July, a “heat dome” settled over the southern and western bits of the US. It’s a good example of how extreme heat can spike. In this map from the National Weather Service on July 13, we see areas with excessive heat warnings in purple, while orange signifies heat advisories.
A month later, another heat dome hit the central US, with Lawrence, Kansas, clocking a heat index—which considers both temperature and humidity—of 134 degrees F.
Heat domes are self-perpetuating monsters, thanks to their tendency to fuel themselves. A heat dome begins when air sinks from high altitudes, heating up significantly before it hits the ground. As the days go on, moisture evaporates from the landscape, raising temperatures still further. A heat dome also prevents clouds from forming, so the sun’s energy keeps hitting the ground full-force.
4. Absurd Land Surface Temps in Phoenix
Throughout July, relentless heat baked Phoenix, with 31 days straight of temperatures exceeding 110 degrees. It smashed the previous record of 18 days. In the NASA animation above, the deep red indicates land surface temperatures up to 102 degrees. Notice how between July 2 and 19, Phoenix gets progressively hotter.
But if highs exceeded 110 degrees, why are these surface temperatures below that? Because these readings were taken between 2 and 3 in the morning. It’s a striking illustration of the urban heat island effect: Roads and buildings absorb heat during the day, and slowly release it at night. This sustained heat takes a huge toll on the human body whenever people can’t get the respite of cooling off at night.
5. Wildfire Devastates the Town of Lahaina, Maui
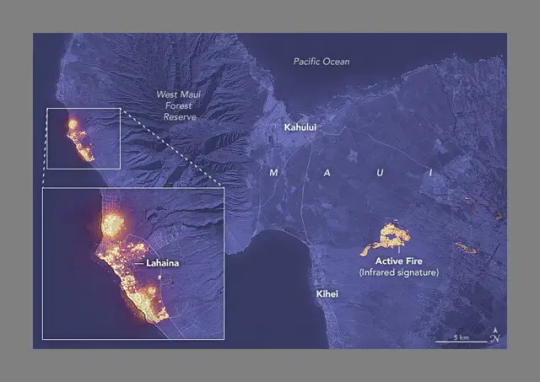
On August 8, the deadliest wildfire in modern US history tore through the coastal town of Lahaina, Maui, driven by 60-mile-an-hour winds pouring down a mountainside like an avalanche. The death toll has risen to 115, and crews are still searching the ashes. The map shows the yellow infrared signatures of active fires on August 8.
Climate change is making wildfires worse year by year, as higher atmospheric temperatures suck moisture out of the landscape, turning dead vegetation into tinder. Maui and the other Hawaiian islands are plagued with invasive grasses that grow rapidly during the rainy season, then dehydrate during the dry season. This accelerant helped doom Lahaina—a town on a tropical island that only rarely saw wildfire before humans arrived.
6. The Eastern US Chokes on Wildfire Smoke
Along with the tropical Hawaiian islands, the East Coast isn’t exactly known for its wildfires. (That’s in stark contrast to the West Coast’s increasingly catastrophic blazes.)
But this year it’s certainly been feeling the side effects of fires, thanks to Canada’s blazes, which caused mass evacuations and are becoming harder than ever to fight. The animated map above is from June 28, modeling how smoke swirled south into Midwestern and Eastern states—even as far south as into Georgia—as hundreds of fires burned in Canada. (Red signifies thicker smoke near the surface.)
At the time, nearly a third of the US population was under air quality alerts: Wildfire smoke is bad for anyone’s lungs, but is especially terrible for folks with respiratory problems like asthma.
7. The Very Odd Loss of Antarctica’s Sea Ice
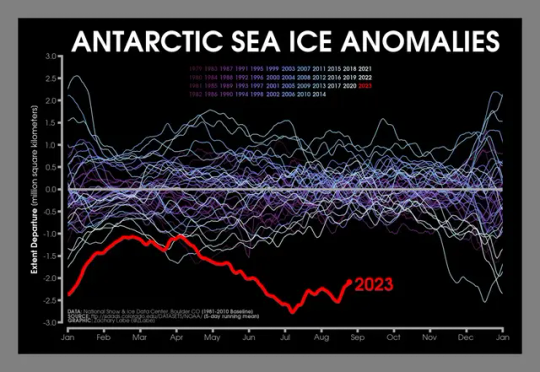
This is not what you want to see in Antarctica. This graph shows the extent of sea ice floating around the southern continent—the line for 2023 is in red, and the other colors of squiggly lines are the years since 1979. (“Extent” means the area of sea ice, which researchers measure in millions of square kilometers.)
Anything above the horizontal gray line is above the average, while anything below it is below the average. And 2023 is way, way below, currently indicating that over 2 million square kilometers of Antarctic sea ice are missing.
Scientists are still trying to figure out whether this is a fleeting event, or whether we’re witnessing a fundamental shift in the way Antarctica’s sea ice works. “I really think it's a combination of atmospheric drivers and ocean drivers that are just tricky to understand, whether it's natural climate variability versus climate change,” says climate scientist Zachary Labe of Princeton University and NOAA, who created the graph. “The anomaly in the extreme event is very striking. It is really weird. But still, a lot of questions remain on the specifics of what is causing that.”
The good news is that because Antarctica’s sea ice is already floating, if it melts it won’t add to sea levels. The bad news is that sea ice helps protect the continent’s massive ice sheets from the wind and waves, keeping them from breaking apart. If Antarctica’s Thwaites Glacier, aka the Doomsday Glacier, fully deteriorated and tugged the ice surrounding it on land into the ocean, that’d add 10 feet to sea levels.
8. Soaring Sea Surface Temperatures
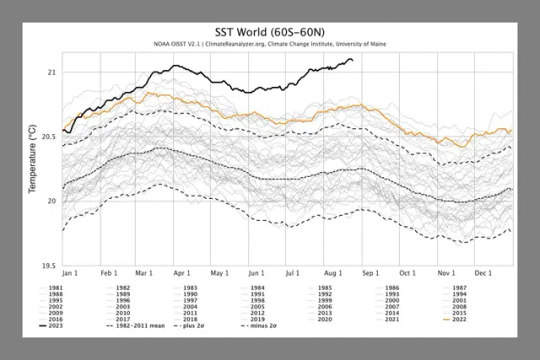
Since March, global sea surface temperatures have been rising as the amount of Antarctic sea ice falls, and are now far above the norm. This graph shows 2023 in the solid black line, and previous years as the other squiggles. The orange line is 2022. (Note that this is an average of the world’s sea surface temperatures. Some areas are even hotter.)
Historically, oceans have absorbed around 90 percent of the excess heat humans have pumped into the atmosphere, and we are seeing the devastating consequences. In July, temperatures off the coast of Florida reached 101 degrees, leading to mass bleaching of corals. Scientists are also worried about how consistently high sea surface temperatures are affecting the plankton that make up the very base of the ocean food web.
Also keep in mind that as the oceans get hotter, that warmer water expands—in fact, around half of sea level rise comes from this “thermal expansion,” and the other half from melting ice.
9. Zooming in on the North Atlantic
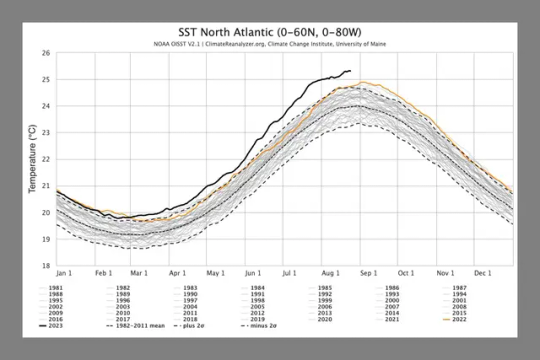
This chart specifically shows sea surface temperatures in the North Atlantic. The extra heat there is especially worrying because warm waters fuel hurricanes. This has set up an interesting battle in the North Atlantic, as we reported in late June: El Niño is strengthening in the Pacific, providing wind shear that could counteract the development of hurricanes. But earlier this month, NOAA provided an update, saying that El Niño’s effects may not show up in the Atlantic in time to tamp down hurricanes. There’s now a 60 percent chance of an above-normal hurricane season.
El Niño’s warm waters may have also helped supercharge Hurricane Hilary, which formed in the eastern Pacific and marched north, making landfall in Mexico and Southern California as a tropical storm last week. That storm dropped an astonishing amount of water, causing severe flooding and debris flows: Mount San Jacinto, near Palm Springs, got nearly a foot of rainfall over two days
10. The El Niño Wild Card
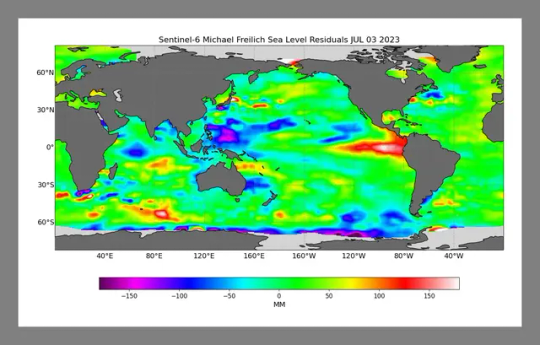
Looking ahead to next year, El Niño (pictured above as the smear of red off the west coast of South America) could drive temperatures still higher, potentially costing the world trillions of dollars. Historically, there’s been a lag of about three months between El Niño peaking and the biggest response in surface temperatures. “We generally expect the bigger effects of the developing El Niño to be felt in 2024 than 2023,” says Hausfather, of Berkeley Earth. “2023, when all things are said and done, is probably going to be the warmest year on record, but not by a huge margin over 2016 and 2020. At least right now, it looks like 2024 is on track to be the real record-shatterer in terms of annual temperatures.”
6 notes
·
View notes
Last Seen Blogs

justmeowzz
my mind.

catflowerqueen
Catflowers Shall Rule the World!

yuuani
ライブミキサー

snorgless
Snorgless' Fat Stories

travellingarsonist
"you say something reasonable only about once a month"