#Energy Transition
Text
"Heat stored underground in caverns can be set aside in Finland’s summer months to be re-used during frigid winters thanks to a state-of-the-art ‘seasonal energy’ storage facility.
Slated for construction this summer near Helsinki, it will be the largest in the world by all standards and contain enough thermal energy to heat a medium-sized city all winter.
Thermal exchange heating systems, like those built underground, or domestic heat pumps, are seen as the most effective way available of reducing the climate-impact of home heating and cooling.
Their function relies on natural forces or energy recycling to cool down or heat up water and then using it to radiate hot or cold energy into a dwelling.
In Vantaa, Finland’s fourth largest city neighboring the capital of Helsinki, the ambitious Varanto seasonal energy storage project plans to store cheap and environmental friendly waste heat from datacenters, cooling processes, and waste-to-energy assets in underground caverns where it can be used to heat buildings via the district heating network whenever it is needed.
In Finland and other Nordic countries, the heat consumption varies significantly between seasons. Heat consumption in the summertime is only about one-tenth of the peak load consumption during the cold winter months.
Varanto will utilize underground caverns equal in space to two Maddison Square Gardens—over a million cubic meters—filled with water heated by this waste heat and pressure that will allow the water to reach temperatures of up to 300 degrees Fahrenheit without the water boiling or evaporating.
youtube
“The world is undergoing a huge energy transition. Wind and solar power have become vital technologies in the transition from fossil fuels to clean energy,” says Vantaa Energy CEO Jukka Toivonen.
“The biggest challenge of the energy transition so far has been the inability to store these intermittent forms of energy for later use. Unfortunately, small-scale storage solutions, such as batteries or accumulators, are not sufficient; large, industrial-scale storage solutions are needed. Varanto is an excellent example of this, and we are happy to set an example for the rest of the world.” ...
“Two 60-MW electric boilers will be built in conjunction with Varanto,” adds Toivonen. “These boilers will be used to produce heat from renewable electricity when electricity is abundant and cheap. Our heat-producing system will work like a hybrid car: alternating between electricity and other forms of production, depending on what is most advantageous and efficient at the time.”
... Construction of the storage facility’s entrance is expected to start in summer 2024, while it could be operational as early as 2028."
-via Good News Network, April 12, 2024. Video via VantaanEnergia, March 10, 2024
#solarpunk#heat pump#renewable energy#heating#finland#energy transition#climate change#climate hope#good news#hope#helsinki#clean energy#Youtube
367 notes
·
View notes
Text
Via Dr. Katherine Hayhoe’s newsletter
39 notes
·
View notes
Text
In today’s episode, Ariel chats with Heather MacKenzie, Executive Director of Solar Alberta, about transitioning to renewable energy deep in the heart of oil and gas country - in a just and sustainable way. Join us to learn about the history of the Solar Alberta organization, from its grassroots beginnings in neighbourhood solar projects, to dealing with (government-funded!) trolls online, all the way up to being the leading non-profit solar organization in Alberta and providing worker upskilling in a unique market.
You can go to https://solaralberta.ca to learn more, or connect with and follow them on Instagram, Facebook, Twitter, and LinkedIn.
Connect with Solarpunk Magazine at solarpunkmagazine.com and on Twitter @solarpunklitmag
Connect with Solarpunk Presents Podcast on Twitter @SolarpunkP, Mastodon @[email protected], or at our blog https://solarpunkpresents.com/
Connect with Ariel at her blog, on Twitter at @arielletje, and on Mastodon @[email protected]
Connect with Christina at her blog, on Twitter @xtinadlr, and on Mastodon @[email protected]
#solarpunk#solarpunk presents#solarpunk futures#podcast#Solar Alberta#Heather MacKenzie#energy transition#renewable energy#just transition#sustainable solutions#sustainability#Ariel#upskilling#YEG#Edmonton#Alberta#grassroots#fossil fuels#Alberta oil and gas#season one episode eight
20 notes
·
View notes
Text
The debates about climate policy since the passage of the IRA have been marked by dynamics that make these occurrences more likely — particularly an effort to once again define the climate crisis as a matter of energy policy, separate from concerns about the environment and unconnected to efforts to build a more just society. In fact, many of the loudest advocates for “cutting red tape,” who are almost exclusively white men, argue that demands for a just transition are incompatible with the demands of decarbonization or simply that they do not understand how to “effectively” address environmental justice concerns.
As a result, policy proposals that aim to balance efforts to decarbonize with the needs of Black communities are increasingly dismissed as ancillary, insufficient, or, worse, “unserious.”
Rhiana Gunn-Wright in Hammer & Hope. OUR GREEN TRANSITION MAY LEAVE BLACK PEOPLE BEHIND
I’m an architect of the Green New Deal, and I’m worried the racism in the biggest climate law endangers our ability to get off fossil fuels.
7 notes
·
View notes
Text
✨🌿 Explore a Transição Energética com os "Diálogos para o Futuro" 🌿✨
Liderado pelo Prof. Dr. Fernando de Lima Caneppele, o projeto "Impulso Energético Sustentável" é uma chamada à ação para todos nós interessados em sustentabilidade e energias limpas. Este projeto multidisciplinar aborda o desafio do ODS7, promovendo um diálogo inclusivo e abrangente sobre como podemos alcançar um futuro energético sustentável.
Não perca a série de seminários "Diálogos para o Futuro", onde discutiremos tudo, desde inovações tecnológicas até políticas de apoio e financiamento da transição. Junte-se a nós nessa jornada!
🔗 Confira: http://www.iea.usp.br/eventos/ciclos/dialogos-para-o-futuro-transicao-energetica-e-ods7
#TransiçãoEnergética #ODS7 #Sustentabilidade #FuturoEnergético
2 notes
·
View notes
Photo

For centuries the human need for energy has left an extensive mark on the surface of the earth: from the early use of firewood over the extensive coal mining as a result of the industrial evolution to the postwar use of nuclear energy humankind has conquered landscapes and fundamentally shaped its appearance. With the gradual disappearance of fossil energy sources from the overall energy mix especially in the Global North and the inevitable increase of the significance of renewables new energy landscapes have emerged and continue to emerge. This circumstance offers the chance to finally combine a new energy landscape and infrastructure with novel design solutions that take into account the closer coexistence of man and technology: where in the past energy generation and the exploitation of resources were banned to the periphery renewables move closer or even directly into urban areas.
This observation together with the notion that landscape also is a highly emotional topic for both inhabitants and visitors was the point of departure for a group of researchers at Academie van Bouwkunst Amsterdam and Wageningen University that resulted in the present book: „Power of Landscape - Novel Narratives to Engage with the Energy Transition“, recently published by NAi010 Publishers: it offers a comprehensive perspective on energy landscapes that takes into account past, present and future and from it elaborates the potential of the ongoing energy transition. By engaging with the past and the present the authors demonstrate not only how much landscapes have changed over time but also how attached people have become to this particular landscape. This of course applies less to surface mining as is still happening in e.g. Germany but to Dutch windmills, dams or remains of coal mining infrastructure. Bearing this in mind the book nonetheless argues for change that takes along the population by means of direct involvement and convincing narratives. Here is where the featured futures come in and offer striking examples of decarbonized energy landscapes.
“Power of Landscape” is a must for anyone interested in engaging with the future of energy landscapes on basis of past and present!
26 notes
·
View notes
Text
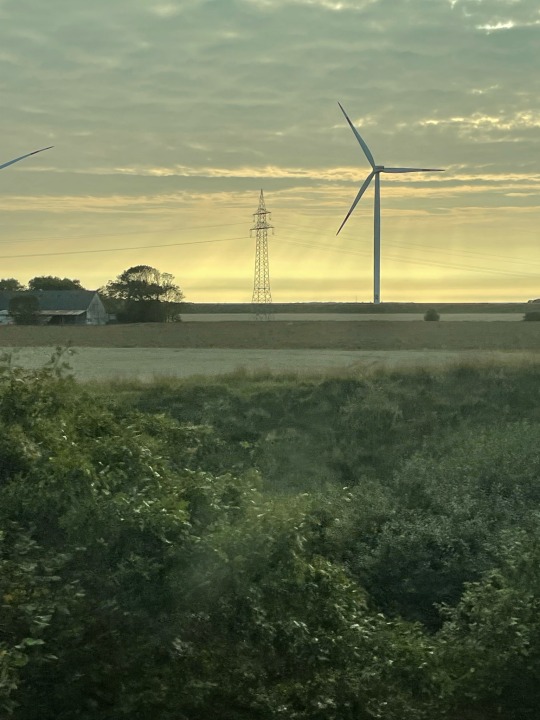
#deutschland#norddeutschland#schleswig holstein#sylt#energiewende#windkraft#stromverbrauch#power grid#energy transition#electricity#electricity infrastructure#energia#wind mill#photographers on tumblr#iphone#iphone 12
23 notes
·
View notes
Text
10 notes
·
View notes
Text
Now an Energy and Sustainability Advisor for the Healthcare Sector
I started last month a new job as Energy Transition and Sustainability Advisor for the Healthcare Sector. Here is some information about what that entails.
And now for a personal note and announcement. My publishing here has been infrequent for the past month and a half as I have moved and started a new job. I was until late March an Energy Manager for a local energy public organization in Nantes, now I am an Energy Transition and Sustanaibility Advisor for the Healthcare Sector in Epinal. After my technical degree and training two years ago, this…
View On WordPress
2 notes
·
View notes
Text
Carbon capture: Nigeria’s climate plans and World Bank’s fake solution, By Jonah Gbemre
Carbon capture: Nigeria’s climate plans and World Bank’s fake solution, By Jonah Gbemre
A future fit World Bank must help reduce carbon emissions by shifting financing from fossil fuels to renewables such as solar and help ensure that new infrastructures are decentralised, while benefitting local communities and preparing workforces to operate a clean economy. The World Bank should stop using public money to bankroll dirty polluters, it should sign the Glasgow Clean Energy statement…

View On WordPress
#Carbon Capture#climate change#energy transition#green energy#Jonah Gbemre#Nigeria&039;s energy transition#world bank
1 note
·
View note
Link
“Finland’s wind power capacity increased by 75 per cent last year, according to the Finnish Wind Energy Association (FWPA).
With almost half of Finland’s wind power domestically owned, the renewable energy source is providing a significant lifeline during the current energy crisis.
“Wind power is now increasing our country’s energy self-sufficiency at a really good pace - just when new and affordable electricity production is most needed,” says Anni Mikkonen, CEO of the FWPA.
Renewable energy investments are surging across Europe
As with other European countries, Finland sped up its renewable energy transition in reaction to fuel shortages after Russia’s invasion of Ukraine.
In December, the International Energy Agency (IEA) predicted that global renewable power capacity growth will double over the next five years...
...The growth in renewables is also helping Finland achieve its ambitious climate goals. The country hopes to be one of the first in Europe to reach net zero, setting a 2035 target - well ahead of the EU’s 2050 goal.
How much did Finland’s wind power capacity increase in 2022?
In 2022, Finland put 427 new wind turbines into operation, adding 2,430 megawatts of capacity. One megawatt could power an estimated 1,000 homes, meaning the new turbines could service over 2.4 million households.
The country now has a total of 1,393 wind turbines producing a combined power of 5,677 MW - potentially enough to power an estimated 5.5 million homes in a country with a population of 5.5 million.
Wind power capacity is expected to increase by around 1,000 MW annually over the next few years. By 2025, wind is expected to cover at least 28 per cent of Finland’s electricity consumption, up from almost 10 per cent in 2021.
How is wind power affecting Finland’s economy?
The wind power Finland added in 2022 brought €2.9 billion in investments to the country.
“No other industry currently brings as many annual investment euros to Finland as wind power,” says Mikkonen. “Wind power also brings vitality to many small municipalities, where investment targets may otherwise be few.”
With the cost of renewables trending downwards, it could also reduce the country’s energy prices in future.
“No other electricity generation can be built in Finland as quickly and as cost-effectively right now,” says Mikkonen.
According to Oxford University researchers, ending fossil fuel use by 2050 will save the world at least $12 trillion (€11.3 trillion).
The production of wind power has increased by 23 percent a year globally. As capacity surges, costs will continue to fall.
Meanwhile the price of fossil fuels - when adjusted for inflation - has not dropped significantly over the past 140 years. Any major changes have been due to geopolitical events like the war in Ukraine.” -via EuroNews, 1/12/23
#finland#wind power#fossil fuels#oil#gas#sustainabiliity#renewable energy#europe#energy independence#energy transition#good news#hope
36 notes
·
View notes
Text
Power generation from renewable energy resources plays an essential role in Europe’s transition to a decarbonized energy system.
The European State of the Climate (ESOTC) report reveals that a record 43% of actual electricity generation in Europe came from renewable sources, up from 36% in 2022. For the second consecutive year, energy generation from renewables overtook the generation from polluting fossil fuels. The largest source is biomass, which is not covered in this report. Until 2018, hydro-power was the second largest renewable energy source, but that position has now been taken by wind power. The total installed capacity of wind and solar power has been steadily increasing over the past two decades.
Renewable energy resources and electricity demand are highly sensitive to climatic conditions, which are subject to long-term trends and fluctuations on timescales ranging from days to decades. With Europe’s increasing move to renewable resources for its electricity supply, monitoring and understanding their temporal and spatial variability, and how they may be changing in a warming climate, is becoming more vital. It is important to assess how these variations affect both the demand for electricity and the potential for renewable energy generation.
This section provides an overview of actual electricity generation in Europe in 2023. It then explores the implications of climate conditions for potential power production for onshore wind power, solar photovoltaic (PV) and run-of-river hydropower, and on electricity demand. Only climate-dependent variations are taken into account; all other factors, such as variations due to improvements in the efficiency of the technology, are taken as constant. Other assumptions, such as the homogenous distribution of production units for wind and solar power across Europe, are also made. Potential power generation is represented as capacity factor (CF) – the ratio between the average power potentially delivered and the theoretical maximum power. CF ranges in value between 0, when no power is delivered, and 1, when the delivered power is equal to the theoretical maximum power of the system.
Measured electricity generation and demand in 2023
Figure 1a. Percentage of the total actual annual electricity generation from 2016 to 2023 for Europe, from solar (yellow), wind (purple) and hydro (blue) power, and other sources, including other renewables and fossil fuels (grey). Total generation in TWh is shown in Figure S1[5]. Data source: ENTSO-E and Elexon.
In 2023, electricity demand across Europe was the lowest in eight years, at around 2.6 PWh. The year saw a record share of electricity generation from renewables, at around 43%, with 17% from hydropower, 18% from wind power and 7% from solar power. Solar and wind energy tend to follow a complementary seasonal cycle: solar power generation is naturally highest during spring and summer, while wind power produces more electricity in autumn and winter.
Climate-driven electricity demand and potential for generation in 2023
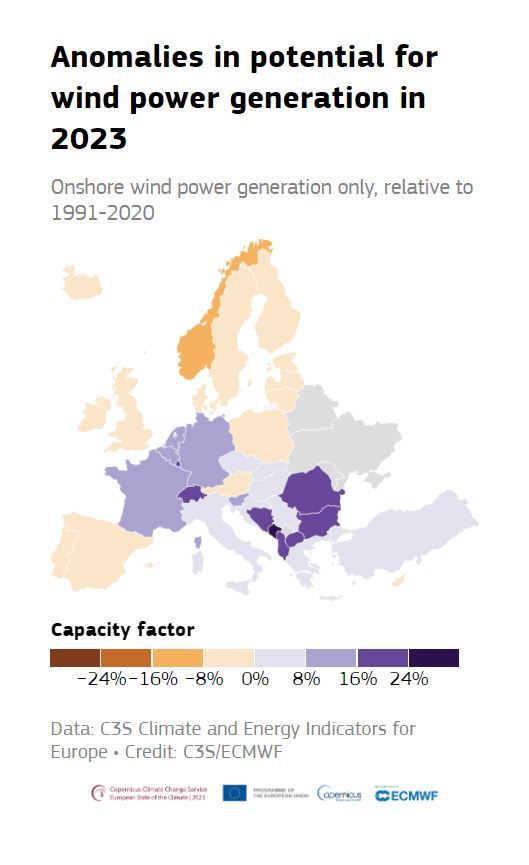
Figure 2. Anomalies (%) in potential electricity generation from three renewable sources in 2023: onshore wind capacity factor (top left), solar photovoltaic capacity factor (top right), run-of-river hydropower capacity factor (bottom left); and in climate-driven electricity demand (bottom right). All anomalies are relative to the average for the 1991–2020 reference period and expressed as a percentage of this average. Countries shaded in grey are those for which no data are available, except for solar PV for which these countries are not shown. Data source: C3S Climate and Energy Indicators for Europe.

The climate-driven electricity demand in countries in central and eastern Europe was close-to or below average for the year as a whole. This is consistent with warmer-than-average temperatures experienced across much of Europe, notably during the winter and autumn, and a corresponding reduced demand for heating. Conversely, climate-driven electricity demand was above average in parts of southern Europe, particularly Spain and Italy, and in Norway and Sweden. In southern Europe, this was largely due to high summer temperatures, leading to increased demand for cooling; in Scandinavia, it was linked to the well-below-average temperatures experienced during several months that increased the demand for heating. More on temperature conditions can be found in the ‘Temperature’ and ‘Contrasting summer’ sections.

Potential electricity generation from wind was above average in central and southeastern parts of Europe, and below average in Spain, the UK, Iceland, Fennoscandia, and parts of northeastern Europe.

Potential electricity generation from solar was below average in northwestern and central parts of Europe, and above average in southwestern and southern Europe, and Fennoscandia. Solar CF is closely related to surface solar radiation, but other technological factors also play a role. For example, while solar radiation was well above average across much of northern Europe in May and June, the potential for solar generation was not as high, as not all solar radiation is converted into power, particularly at high temperatures. Therefore, averaging across the year results in lower potential power generation from solar PV, compared to the anomalies in solar radiation.
For run-of-river hydropower, potential electricity generation was above average across much of Europe, except for Spain, Norway and Romania. This largely reflects regional anomalies in precipitation. Similarly, the month-to-month variability in hydropower CF, discussed below, reflects anomalies in monthly average river flow across the European river network.
Variability throughout the year
Potential power generation from renewable sources and climate-driven electricity demand both change throughout the year, due to variability in weather and climate. Below, June and November are discussed, to demonstrate this variability between warmer and cooler times of year.
Onshore wind power
Figure 3. Average onshore wind power capacity factor anomaly (%) for June 2023 (left) and November 2023 (right), relative to the respective monthly average for the 1991–2020 reference period and expressed as a percentage of this average. Countries shaded in grey are those for which no data are available. Data source: C3S Climate and Energy Indicators for Europe.
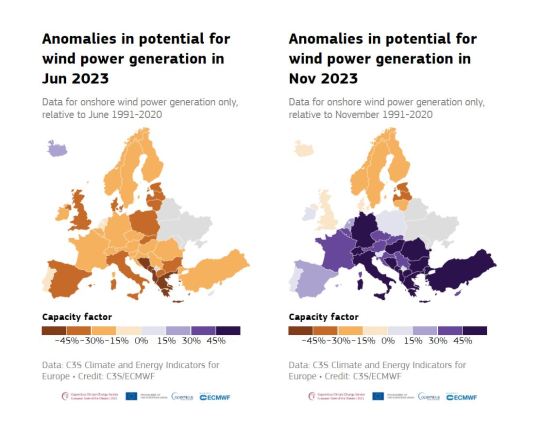
In June, wind power CF was below average across Europe, except for Iceland, with the largest anomalies observed in Serbia, Bosnia and Herzegovina, and Albania, at up to 64% below average. This reflects below-average wind speeds across all but northeastern Europe and Iceland. In contrast, November saw well-above-average wind power CF anomalies across central and southern parts of Europe, and below-average anomalies in Fennoscandia, the United Kingdom and Iceland. This is consistent with above-average wind speeds observed across most of Europe in the last three months of 2023, associated with storm activity.
Solar photovoltaic
Figure 4. Average solar photovoltaic capacity factor anomaly (%) for June 2023 (left) and November 2023 (right), relative to the respective monthly average for the 1991–2020 reference period and expressed as a percentage of this average. Countries with no data available are not shown. Data source: C3S Climate and Energy Indicators for Europe.
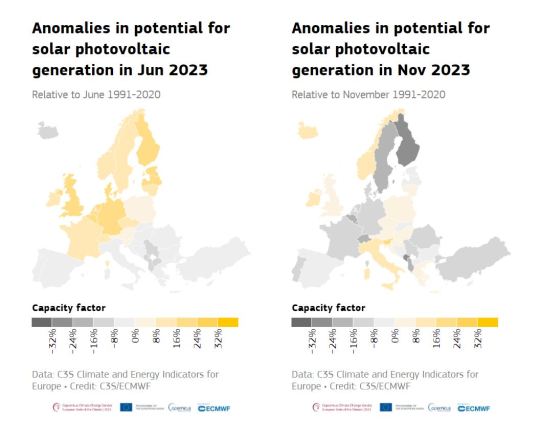
For solar PV power, June saw above-average CF across most of central and northern Europe, and below-average CF across southern Europe and Iceland. This reflects a contrast in surface solar radiation seen across Europe in June. During this month, positive surface solar radiation anomalies, of up to 70 W/m2, were seen in parts of central Europe and Scandinavia, and negative anomalies, as low as -40W/m2, in southern Europe. In November, the solar CF anomalies also corresponded to anomalies in surface solar radiation. Below-average solar radiation and solar PV CF were seen across central Europe, and particularly the Alps, and parts of southeastern Europe and eastern Scandinavia.
Run-of-river hydropower
Figure 5. Average run-of-river hydropower capacity factor anomaly (%) for June 2023 (left) and November 2023 (right), relative to the respective monthly average for the 1991-2020 reference period and expressed as a percentage of this average. Countries shaded in grey are those for which no data are available. Data source: C3S Climate and Energy Indicators for Europe.

In June, below-average run-of-river hydropower CF was seen across much of Europe, while Italy saw well-above-average run-of-river hydropower CF. This reflects positive precipitation anomalies and above-average river flows in Italy in May and June. In November, run-of-river hydropower CF was above average across most of Europe. For most areas, it was 10–20% above average, but it was as much as 57% above average in Portugal and 39% in Switzerland, associated with well-above-average precipitation anomalies and high river flow. The exceptions were Norway and Romania, where slightly-below-average run-of-river hydropower CF was observed, linked to slightly-below-average river flow. More on hydrological conditions in Europe can be found in the ‘Precipitation’ and ‘River flow’ sections.
Climate-driven electricity demand
Figure 6. Average climate-driven electricity demand anomaly (%) for June 2023 (left) and November 2023 (right), relative to the respective monthly average for the 1991–2020 reference period and expressed as a percentage of this average. Countries shaded in grey are those for which no data are available. Data source: C3S Climate and Energy Indicators for Europe.

Climate-driven electricity demand can be linked to factors such as a reduced need for heating when temperatures are warmer than average during winter, and increased need for air conditioning when temperatures are warmer than average during summer.
While the climate-driven electricity demand for the year as a whole was generally below average, it was slightly above average in June across much of western and central part of Europe. These areas correspond to those that saw above-average temperatures during June. However, warmer-than-average temperatures over Scandinavia in the same month corresponded to slightly below-average demand. Later in the year, demand over northern Europe was generally above average. From October to December, temperatures in Scandinavia were much colder than average, reflected in well-above-average demand. In November, however, southern Europe saw below-average demand associated with above-average temperatures for the time of year.
Changes in energy statistics through 2023
While climate conditions can drive demand for additional energy, to some extent they can also compensate through increased potential to generate power. For example, in summer, demand can be higher, but this can be balanced out by additional solar power generation.
Comparison of energy statistics aggregated over a region can highlight links and compensation between climate-driven electricity demand and renewable power resources at a larger geographical scale than that of individual countries[8]. Here, statistics are reported for a region of central Europe, defined here as France, Belgium, Luxembourg, the Netherlands, Germany and Switzerland. These countries are chosen because of their relatively similar climatic conditions in 2023.
Figure 7. Changes in energy statistics for run-of-river hydro-power capacity factor (CF), solar photovoltaic CF, onshore wind CF and anomalies in climate-driven electricity demand for each day in 2023. The daily average CF for the 1991–2020 reference period is indicated by the dashed grey line. Climate-driven electricity demand is expressed as a percentage of the 1991–2020 reference period. Values are averaged across a region of central Europe (here defined as France, Belgium, Luxembourg, the Netherlands, Germany and Switzerland). Data source: C3S Climate and Energy Indicators for Europe.
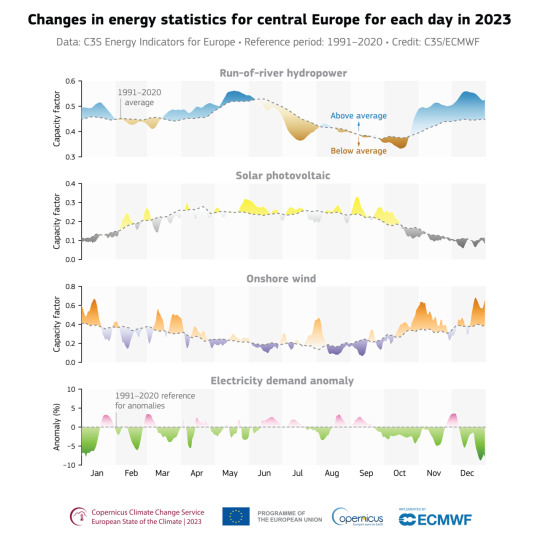
Averaged across six central European countries, the climate-driven electricity demand was below average for most of the year. January, February, October and December saw the largest negative anomalies, with daily values reaching around 7–9% below average in January and December. The lower demand reflected the higher-than-average temperatures during these months and the associated reduced demand for heating. Apart from two weeks in late November and early December, demand was persistently below average from late September until the end of the year.
Climate-driven electricity demand was most above average at the end of January, and in early March, late August, and early December; up to around 3.5% above average during all these periods. The two longest periods of above-average demand were early June to mid-July and mid-August to mid-September. These periods coincided with above-average summer temperatures and the associated demand for air conditioning.
Solar PV CF was above average during several periods in February, May, September and October. September saw the largest positive monthly anomaly, of 18% above average, with daily CF values reaching around 0.3. The increased solar PV CF in September partially compensated for the higher electricity demand.
Onshore wind CF was variable during 2023, but generally above average. There was a long period of above-average CF throughout October and November, which saw daily CF values peaking at around 0.65. November also saw the largest monthly onshore wind CF anomalies, at around 45% above average for the month as a whole. This increase in onshore wind CF was associated with storm activity across much of Europe. February, June and a period from mid-August to the beginning of October saw below-average onshore wind CF, except for a short period of slightly above average anomalies in mid-September. November’s storms continued into December; the associated above-average precipitation and river flow led to above average run-of-river hydropower CF during these two months. At its peak, it reached almost 20% above average, after being close to average for much of the year. July was the only month that saw below-average hydropower CF; as much as 12% below average for the month as a whole.

Monitoring wind, solar , and hydropower is crucial for optimizing the potential for renewable energy generation. Accurate climate monitoring supports strategies to accelerate the transition to sustainable energy sources, fostering both environmental protection and economic growth.
#climate-driven electricity demand#clean energy#capacity factor (CF)#potential power production#onshore wind power#solar photovoltaic (PV)#run-of-river hydropower#and on electricity demand.#energy transition#renewable energy sources#energy sources
0 notes
Text
Pass legislation to significantly expand transmission for clean energy NOW!
AN OPEN LETTER to THE PRESIDENT & U.S. CONGRESS
820 so far! Help us get to 1,000 signers!
Right now, there are at least 2,000 gigawatts of renewable energy waiting for permission to connect to power lines in the U.S., which is more than the total capacity of the country’s existing power plants. Wait times to connect new power plants to the grid can reach five years or more. Without rapidly improving transmission, the United States will not be able to achieve Biden's goal of 100% clean energy by 2035 or provide cheaper, more reliable electricity to American households. If the U.S. can’t build new transmission at a faster pace, roughly 80 percent of the emissions reductions expected from the Inflation Reduction Act–the largest climate legislation in U.S. history–might not happen.
That’s why I’m writing to urge Congress to pass legislation to significantly expand transmission for clean energy.
Multiple efforts are currently in play. Most recently in the House, Representatives Sean Casten and Mike Levin introduced the Clean Energy and Transmission Acceleration Act, (HR 6747) which would encourage the development of new transmission lines to carry renewable power where it’s needed while protecting the rights of communities to provide input on where lines are built and to benefit from their construction. I strongly support this bill.
But any legislation is better than none, and NONE of the bills proposed so far have been passed. This is not good.
Increasing access to clean energy will help tackle the climate crisis by ensuring the reliability of the grid and reducing consumers' bills. Renewable energies like wind and solar are quickly becoming the least expensive source of energy and we need to make sure as many people as possible get access to these clean, abundant energy sources.
Please pass a strong, fair transmission bill—like HR 6747—that prioritizes clean energy, climate change, and environmental justice. This is urgent; all of our children are counting on us to secure their futures. Thanks.
▶ Created on April 23 by Jess Craven · 819 signers in the past 7 days
📱 Text SIGN PMNVSR to 50409
🤯 Liked it? Text FOLLOW JESSCRAVEN101 to 50409
#JESSCRAVEN101#PMNVSR#resistbot#Clean Energy#Renewable Energy#Climate Action#Transmission Expansion#Green Energy#Clean Energy Now#Climate Change#Energy Infrastructure#Renewables#Climate Crisis#Energy Policy#Infrastructure Bill#Green Grid#Renewable Power#Energy Transition#Climate Legislation#Sustainable Energy#Clean Tech#Electric Grid#Energy Security#Energy Equity#Renewable Future#Grid Modernization#Climate Justice#Energy Innovation#Renewable Resources#Energy Efficiency
0 notes
Text
The analysists would like to remind everyone that all the scaremongering about the green transition requiring "oh so much mining of metals, destroying the planet no matter what you do" is horseshit, because mining fossil fuels is also mining, and has to happen in enormously larger quantities of digging than for rare earths, and one of the more obvious qualities of fossil fuels is that they aren't recyclable.
Switching to renewables will REDUCE mining operations required to sustain civilization.
0 notes
Text
7th Meeting, 15th Session of the Expert Group on Resource Management.
The UNECE Resource Management Week 2024, including the 15th session of the Expert Group on Resource Management (EGRM-15), will be held at the Palais des Nations in Geneva, Switzerland, 22-26 April 2024. Leaders, experts, and stakeholders in resource management will gather to discuss sustainable development challenges and opportunities. Our theme, "Assuring sustainability in resource management", will focus on the United Nations Framework Classification for Resources (UNFC) and the United Nations Resource Management System (UNRMS) and their pivotal role in resource management worldwide.
Agenda highlights:
Seminars, Workshops, and Short Courses: Focusing on the UNFC and UNRMS as catalysts for transforming raw materials management.
Minerals for the Energy Transition: Highlighting the work of the UN Working Group on Transforming Extractive Industries for Sustainable Development.
Responsible Resource Management: The development and deployment of UNRMS.
Navigating the Future: Exploring various applications of UNFC.
Building capacity: International Centres of Excellence on Sustainable Resource Management.
Empowering Sustainability: Discussing global initiatives and case studies.
Lunchtime lectures: Professor Peter Hopkinson, Co-Director, Exeter Centre for the Circular Economy, Exeter University, and Professor Markus Zils, Circular Economy and Management Science, University of Exeter Business School, UK, on Circular Data (23 April) and Sarah Gordon, CEO, Satarla on The beauty of interconnected natural resource ecosystems, with a focus on ESG issues (25 April).
Session 3: Responsible resource governance
Chair: Karen Hanghøj
Agenda item 8: Building Capacity: International Centres of Excellence on Sustainable Resource Management
ICE-SRM Russia – Igor Shpurov and Vera Bratkova, Chief Executive Officer
ICE-SRM UK – Nick MacInnes, Circular Economy Lead, Office of the Chief Scientific Adviser, Department for Environment, Food and Rural Affairs (Defra), UK and Lynsay Blake, Head of Science in Resources and Waste, Defra, UK
ICE-SRM Mexico – Ulises Neri, Executive Director & Ministries of Energy and Economy of Subnational Governments of Mexico:
José Ramón Silva - Secretary of Energy Development of the State of Tamaulipas
Carlos Adrian García Basto - Director General of the State Energy Agency of the State of Campeche
Esaú Garza - Secretary of Economy, Science and Technology of the State of Aguascalientes
ICE-SRM Criteria for Recognition and Terms of Reference (ECE/ENERGY/GE.3/2024/4)
ICE-SRM EU – Meta Dobnikar, Head of Mineral Resources and Geochemistry Department, Geological Survey of Slovenia
ICE-SRM Central Asia – Farkhat Abytov, Executive Director
ICE-SRM Africa – Tunde Arisekola, Senior Advisor, Geological and Minerals Information, African Minerals Development Centre
Dario Liguti, Director, UNECE Sustainable Energy Division
Discussion
Agenda item 7.2: Development and deployment of UNFC - Technical Advisory Group Annual Report - Updated Injection Projects Specifications (ECE/ENERGY/GE.3/2024/9)
Aleksandr Shpilman, Co-Chair, Technical Advisory Group
Serge Van Gessel, Chair, Injection Projects Working Group and TNO
Agenda item 7.2: Competency in resource management
Vitor Correia, Chair, Competency Working Group, EGRM
Michael Neumann, Global Geoscience Professionalism Group
Gbenga Olugbenga Okunlola, President, Geological Society of Africa and Member, AMREC Working Group
Craig Waldie, Ontario Securities Commission, Canada - presentation to be delivered by Hendrik Falck, Chair, EGRM Minerals Working Group
Watch the 7th Meeting, 15th Session of the Expert Group on Resource Management

#resource management#plenary sessions#expert group#palais des nations#minerals#mining#mineral resources#geochemistry#mineral development#sustainable energy#sustainability#energy transition
0 notes
Last Seen Blogs

interestingpretzel
Interesting Pretzel

marinemor11
Untitled

afterlifeoftheparty
you must fix your heart

battements-d-elle
Life is Beautiful~La Vie est Belle
