#analytics chart
Text
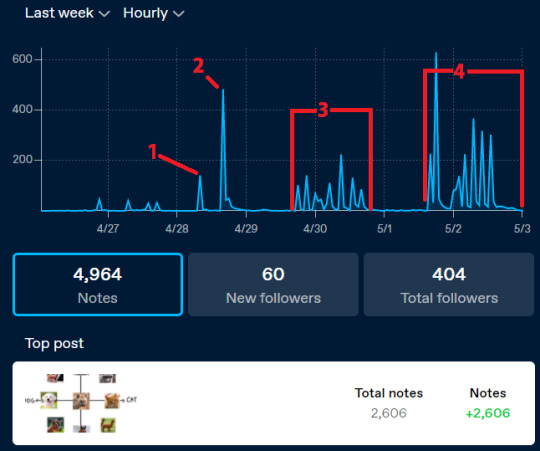
Daily Brief #18
Brief: "Design an analytics chart. Is it to be used for web or app analytics, a health monitor, e-commerce analytics?" courtesy of Daily UI
Time: 1hr 11min
Sketches:

Favorite Part: Making the graphs was pretty fun today. I was hoping for a curved line, but it dawned on me that the lines would be better to show just how sharp a change in app usage there has been over time, especially when doing comparisons
Challenges: Piecing everything together was a bit tricky. I had the concept sketched, but sometimes when you're creating, you realize that some parts ought to be omitted or elaborated. So, for today, realizing that I needed to satisfy not only the time frame comparison interface but also the app selection interface proved to be a tricky thing to bring to fruition. I think it worked well, though - how about you?
See the finished product on IG!
What would you have done differently? Either send me a submission for your take on this brief or comment what element/theme you'd like to see incorporated in my next brief.
1 note
·
View note
Text
I may not be able to read a stock chart but I can read my tumblr analytics like a pro
#studying my tumblr analytics when i should be studying for econ#i hate econ#why is econ a thing#stock charts make me wanna cry#tip I learned is that the best times to post is like 12 3 or 6 pm#smth about lunch hours or getting out of school hours#it works for me at least
7 notes
·
View notes
Text
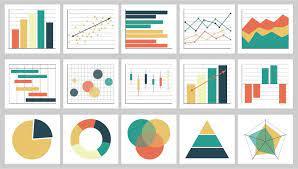
Best Graph Making Tools

Follow @everythingaboutbiotech for informative and useful stuff ✨
#DataViz#DataVisualization#Graphs#Charts#DataGraphs#GraphDesign#Infographics#DataAnalytics#ChartTypes#BarChart#PieChart#LineGraph#GraphSoftware#ExcelCharts#TableauViz#DataStorytelling#FlowChart#OrgChart#Data#Analytics#Numbers#Statistics#DataScience#BigData#Dashboard
6 notes
·
View notes
Text
Lagan Lord in 9th House
In the ninth house, Lagnesh
The ideal position is this one.
It is said that the human body will be covered in universal good fortune.
He will receive all wonderful things from his surroundings.
A person like that will exude "good luck" aura.
The individual will have an extremely pious, spiritual, moral, and religious past life.
He has a strong connection to religion, is engaged in spiritual growth, and most of the time it is religious.
He typically feels a strong bond with both his father and the spiritual leader.
The person will be the Guru's preferred disciple if the lagnesha is exalted in the ninth house.
These individuals make competent priests, educators, and diplomats.
Such a person must have faith in his good fortune.
If we believe in luck, it will come to us; otherwise, there won't be any.
In my experience, they are typically devout, pious individuals.
#astrology#vastu#vedic astrology#vastu shastra expert#astro notes#aries astrology#predictive astrology#astro predictions#predictthefuture#predictive analytics#prediction#astro posts#vedas#vedic astro observations#Vedic Jyotish Online#vedicscience#astrology numerology vedicastrology#hindu vedic#astrology numerology vedicastrology#vedic chart#vedic astro notes#vedic#vedic india
10 notes
·
View notes
Text
the physical PAIN im feeling right now
#'clay...helmet... your name does not belong on this list. but you need to be here if im going to tell my story.#if im going to explain why i did what i did. because you arent every other guy. you're different#youre good. ans kind. and decent. and i didnt deserve to be with someone like you. i never would.#i would have ruined you. it wasnt you' IT WASNT YOU#IT WASNT YOUUUU#LITERALLY BE FUCKING QUIET#IT WASNT YOU#'it was me' SHUT THE FUCK UPPPPP#'and everything that's happened to me. '#my analytical brain with 13 reasons why is off the charts bc theres more than one reason why justin is the way he is#i know it#and i know alex better than anyone in this place and i know why jessica is acting thr way she does . I BE NOTICING THINGS#oh and zach too#fuck marcus n bryce tho and tyler#justin a little bitch but i understand and feel bad for him
5 notes
·
View notes
Text
attention: seeing so many beautiful literati posts, gif sets, fanfic, analysis, etc. results in large serotonin boosts.
news source: me. <3
#you guys are just so <33333#the fanfics the gifs the analysis posts#you guys impress me every day !!#and the analytical skills are off the charts impressive too#just soooo much talent around its amazing 🥹#gilmore girls#literati
22 notes
·
View notes
Text
"Why do you use simply plural" because I like to zoom through a big list of my headmates. The colors on the side go whoosh
#obviously we use it a lot it is a very useful app#like we used to write down who was fronting on a whiteboard in the hallway but now our partner can just fuckin check#also like. analytics. i love analytics let me make a little pi chart i love percentages
7 notes
·
View notes
Text
Market Insight: Interactive Chart Dashboard Design (SaaS)
Choosing the right charts and appropriate color contrast is the most important part of visualizing data. The color black for the background makes others' color pop and comfortable for the eye; we also use purple and teal to make aesthetic visuals.
What do you think about the design? We would love to have your feedback!


Check Out More: https://dribbble.com/shots/19683745-Market-Insight-Interactive-Chart-Dashboard-SaaS
We are top-notch design agency focusing on UI/UX design, web design, branding & marketing ✌️
We’re available for new projects: [email protected]
Visit us: Website | Dribbble | Linkedin | Behance | Twitter | Medium | Instagram
#dashboard#ui design#ux design#designagency#uiux#analytics#chart#saas application#saas business#saas landing page#saas marketing#saas platform#web design services#appdesigner#productdesigner#visual analytics market#musemind
3 notes
·
View notes
Text
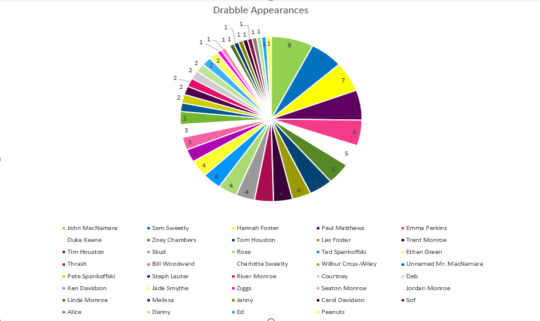
So I am in the process of posting all of the drabbles I have written (both emoji prompts and Spontaneous Saturday) to Ao3. In this process, I realized I have written 60 drabbles!
So, of course, I wanted to know which Character I had written about the most! The chart isn’t the best quality, but I wanted to give a visual lol (also I’m missing people on it, oops)
Out of 60 drabbles, I have written about 42 canon characters and one OC!
1. John MacNamara - 9/60
2. Sam Sweetly - 7/60
2. Hannah Foster 7/60
2. Paul Matthews - 7/60
3. Emma Perkin - 6/60
4. Duke Keane - 5/10
4. Zoey Chambers - 5/10
4. Tom Houston - 5/10
Honorable mentions!
4 appearances: Lex Foster, Trent Monroe, Tim Houston, Skud (Needy Beast), Rose (Needy Beast), Ethan Green, and Ted Spankoffski
3 appearances: Thrash (Needy Beast), Bill Woodward, Charlotte Sweetly, and Wilbur Cross/Wiley
2 appearances: Mr. MacNamara (unnamed), Pete Spankoffski, Steph Lauter, Becky Barnes, Greenpeace Girl, River Monroe, Courtney (Needy Beast), Deb, Ken Davidson, and Jade Smythe (OC)
1 appearance: Frank Pricely, Ziggs, Seaton Monroe, Jordan Monroe, Linda Monroe, Melissa, Jenny, Carol Davidson, Alice Woodward, Sof, Danny, Ed, Peanuts, and Xander
#ash talks#breakdown#emoji prompts#spontaneous saturday#analytics#data#circle chart#pie chart#hatchetfield universe
15 notes
·
View notes
Text
Blaze Train Has Reached The Station
Imma do a big post later but for now...
There’s a lot to unpack...

#blaze Train#it's goin off the rails#feral train alert#call York from Drawtectives#tumblr blaze#blaze analytics#I think I know what I want from the chart#but there are a couple of other options to explore
1 note
·
View note
Text
10 Best AI Tools for Google Sheets (April 2024)
New Post has been published on https://thedigitalinsider.com/10-best-ai-tools-for-google-sheets-april-2024-2/
10 Best AI Tools for Google Sheets (April 2024)
Harnessing the power of artificial intelligence has become essential for optimizing workflows and maximizing productivity. Google Sheets, along with various third-party platforms and tools, has embraced this trend by integrating AI-powered tools that improve data analysis, automation, and decision-making processes.
In this blog post, we’ll explore the top 10 AI tools for Google Sheets that can help you streamline your work, uncover valuable insights, and achieve your goals more efficiently.
Coefficient is a cutting-edge AI-powered data connector that improves the way users interact with Google Sheets and Excel. By bridging the gap between manual data exporting and automated synchronization, Coefficient enables seamless data integration, eliminating the need for time-consuming and error-prone processes. With its intuitive interface and powerful features, users can effortlessly import data into Google Sheets, create dynamic dashboards, and generate AI-driven formulas, SQL queries, charts, pivots, and sheet functions.
One of the standout features of Coefficient is its ability to keep data up-to-date using GPT prompts, ensuring that users always have access to the most current and accurate information. This real-time data refresh capability, combined with the tool’s compatibility with a wide range of platforms and devices, including Stripe, Airtable, Webhooks, ChatGPT, Google Analytics, Looker, Tableau, Zendesk, LinkedIn Pages, Mailchimp, Google Drive, Notion, Slack, Shopify, HubSpot, Outreach, Pipedrive, and Salesforce, makes Coefficient an indispensable tool for data-driven decision-making.
Key Features of Coefficient:
Seamless Data Integration: Effortlessly connect and import data from various sources into Google Sheets and Excel.
AI-Driven Formulas and Queries: Leverage the power of AI to generate complex formulas, SQL queries, and sheet functions.
Dynamic Dashboards: Create visually appealing and informative dashboards with AI-assisted chart building and data visualization tools.
Real-Time Data Refresh: Keep your data up-to-date with GPT prompts, ensuring access to the most current information.
Broad Compatibility: Integrate with a wide range of platforms and devices, including popular business tools and analytics platforms.
SheetMagic is a game-changing AI-powered Google Sheets add-on that takes spreadsheet functionality to new heights. By seamlessly integrating OpenAI directly into Google Sheets, SheetMagic enables users to harness the power of artificial intelligence to generate text, automate complex tasks, and streamline their workflow.
With SheetMagic, users can create AI-generated content in bulk, produce stunning AI images, input URLs to retrieve relevant information, and receive search results without ever leaving their spreadsheet.
One of the key advantages of SheetMagic is its ability to provide a programmatic approach to leveraging AI without requiring any coding skills or developer assistance. This means that users of all skill levels can easily access and utilize the tool’s AI capabilities. To get started, users simply need to install the add-on, create a copy of the SheetMagic Starter Sheet, set up an OpenAI account, generate an API key, and input the key into SheetMagic. From there, they can begin automating tasks, generating text, and processing data with the power of AI.
Key Features of SheetMagic:
Seamless OpenAI Integration: Harness the power of OpenAI directly within Google Sheets for enhanced functionality and automation.
Bulk AI Content Creation: Generate AI-powered text content in bulk, saving time and effort in content production.
AI Image Generation: Create stunning visual content using AI image generation capabilities.
URL Content Retrieval: Input URLs and automatically retrieve relevant content directly into your spreadsheet.
Support for Multiple AI Models: Utilize various AI models, including GPT-3.5 Turbo, GPT-4, GPT-4 Turbo, Dall-E 3, and GPT-Vision.
Ajelix is a powerful suite of AI-driven tools designed to improve the way users interact with Google Sheets, enhancing productivity and streamlining complex tasks. One of its standout features is the Google Sheets AI Formula Explainer, which provides users with detailed descriptions of formulas, making it easier to understand and apply them effectively. By leveraging AI technology, Ajelix simplifies formula analysis, saving users valuable time and effort in deciphering intricate formulas.
In addition to its formula explainer, Ajelix offers a user-friendly customer dashboard that facilitates seamless access to data and enables smooth collaboration among team members. This feature proves particularly useful for users working on Google Sheets and MacBook devices, as it ensures a seamless and efficient workflow.
Moreover, Ajelix’s AI Spreadsheet Assistant takes productivity to the next level by allowing users to generate Excel formulas and Google Apps Scripts effortlessly. By simply describing their requirements in natural language, users can automate tasks, create custom formulas, and enhance their spreadsheet capabilities with AI-generated scripts.
Key Features of Ajelix:
Google Sheets AI Formula Explainer: Provides detailed descriptions of formulas, making them easier to understand and apply.
User-Friendly Customer Dashboard: Facilitates easy access to data and enables smooth collaboration among team members.
AI Spreadsheet Assistant: Generates Excel formulas and Google Apps Scripts based on natural language descriptions.
Google Apps Script Generator: Enables users to write code with the power of OpenAI, automating Google Sheets tasks and boosting productivity.
Wide Range of User Support: Caters to users of all skill levels, from beginners to advanced analytics experts.
PromptLoop is a powerful AI-driven platform that revolutionizes data tasks and boosts productivity in Google Sheets and Excel. With its comprehensive suite of features, including automated data tasks, custom tasks, and real-time data analysis, PromptLoop empowers users to streamline their workflow and extract valuable insights from their data.
One of the standout features of PromptLoop is its Autoloop functionality, which allows users to schedule AI data automations on every row of their dataset. This innovative feature eliminates the need for manual data collection across multiple websites, saving users valuable time and effort. The results of these automations are promptly delivered to the user’s inbox, ensuring quick and easy access to the processed data.
Key Features of PromptLoop:
Automated Data Tasks (Autoloop): Schedule AI data automations on every row of the dataset, with results delivered to the inbox for efficient data collection.
Custom Tasks: Tailor AI models to extract insights, enrich data, and generate customized reports based on unique business requirements.
Real-Time Data Analysis: Apply AI operations directly to data in Google Sheets and Excel, enabling real-time analysis and centralized data accessibility.
Seamless Spreadsheet Integration: Collaborate with teams in real-time using in-built chat and commenting features, enhancing synergy and productivity.
Adaptive AI for Unique Business Needs: Customize AI-driven automation to meet specific data needs, including web scraping, data analysis, and custom dataset creation.
Source: MonkeyLearn
MonkeyLearn is a powerful AI tool designed specifically for Google Sheets, focusing on NLP tasks. With its user-friendly Google Sheets add-on, MonkeyLearn enables users to effortlessly analyze text data, extract valuable insights, perform sentiment analysis, and categorize text data with remarkable efficiency. Whether you’re dealing with customer feedback, social media comments, or survey responses, MonkeyLearn’s AI capabilities streamline the process of analyzing text data, saving you time and effort.
To get started with MonkeyLearn in Google Sheets, users simply need to install the add-on from the Add-On page and grant the necessary permissions for the add-on to run with their Google account. After copying their API Key from their MonkeyLearn account and pasting it into the “Set API Key” field in the MonkeyLearn tab within Google Sheets, users can seamlessly connect their account and begin analyzing their data. By selecting the desired data range and choosing the appropriate model from the dropdown menu, users can harness the power of MonkeyLearn’s AI to gain valuable insights from their text data.
Key Features of MonkeyLearn:
Seamless Google Sheets Integration: Easily install and connect MonkeyLearn to your Google Sheets through the Add-On page.
Text Data Analysis: Efficiently analyze text data, extract insights, perform sentiment analysis, and categorize text data.
Multiple Model Support: Utilize various pre-trained or custom models to analyze text data according to your specific needs.
Advanced Settings: Customize your analysis with options like compacting results, including confidence levels, and outputting results to different rows or cells.
Multi-Model Analysis: Analyze text data using multiple models simultaneously, with each analysis populating a new column for easy comparison.
SheetAI.app is a game-changing AI tool that changes the way users interact with Google Sheets. By seamlessly integrating artificial intelligence directly into the platform, SheetAI.app empowers users to automate complex tasks, generate insightful data analysis, and even create content within their spreadsheets. With its powerful AI functions like SHEETAI_BRAIN, SHEETAI_LIST, and SHEETAI_FILL, SheetAI.app simplifies spreadsheet management and boosts productivity for users across various industries and roles, from freelancers to large enterprises.
One of the key advantages of SheetAI.app is its ability to eliminate the need for additional software by directly integrating AI functionality into Google Sheets. Users can leverage the tool’s custom functions to tap into the powerful capabilities of GPT-3, enabling tasks such as text generation, language translation, summarization, and more. Additionally, SheetAI.app offers a user-friendly Google Sheet formula generator accessible via the Sidebar, allowing users to effortlessly create complex formulas by simply describing the desired action.
Key Features of SheetAI.app:
Seamless AI Integration: Directly integrate AI functionality into Google Sheets, eliminating the need for additional software.
Automated Data Tasks: Automate repetitive and complex tasks such as data cleaning, analysis, and visualization.
Custom Functions: Utilize four custom functions to harness the power of GPT-3 for text generation, language translation, summarization, and more.
Data Analysis and Insights: Generate valuable insights from data faster and more accurately, transforming spreadsheets into smarter workspaces.
AI Formula Generation: Effortlessly create complex formulas using the Google Sheet formula generator accessible via the Sidebar.
Source: FormulasHQ
FormulasHQ is an AI-powered software that enables users to generate Excel Formulas and Google Sheets Formulas. With its advanced features and intuitive interface, FormulasHQ assists users in quickly and accurately creating formulas, functions, and even VBA code. The tool offers a comprehensive suite of capabilities, including Functions, Regex, VBA Code, Notes, and Chat GPT-4 Messaging, empowering developers and Business Analysts to develop efficient coding solutions and extract valuable insights from their data.
By leveraging the power of GPT-4 technology, FormulasHQ streamlines chat messaging and automates the process of creating formulas and functions, ensuring users receive quick and reliable results.
Key Features of FormulasHQ:
AI-Powered Formula Generation: Quickly and accurately generate Excel Formulas and Google Sheets Formulas using AI technology.
Comprehensive Features: Utilize Functions, Regex, VBA Code, Notes, and Chat GPT-4 Messaging to create efficient coding solutions and generate insights from data.
User-Friendly Interface: Designed for users of all skill levels, from small business owners to data analysts, without requiring programming expertise.
Three-Step Process: Add data to a Google spreadsheet, select the task to accomplish, and use the output to automate tasks, enhance decision-making, and improve business outcomes.
Source: Google Workspace Marketplace
XLMiner is a robust AI tool designed specifically for Google Sheets, offering advanced data analysis capabilities that empower users to make data-driven decisions with ease. As a Google Sheets add-on, XLMiner seamlessly integrates with the platform, providing users with a range of powerful features, including regression analysis, clustering, time series forecasting, and more. This comprehensive tool is accessible to users with varying levels of technical expertise, making it an ideal choice for small business owners, data analysts, and everyone in between.
Installing XLMiner in Google Sheets is a straightforward process. Users simply need to open Google Sheets, navigate to the Add-ons menu, click on Get add-ons, and search for XLMiner using the search bar. After selecting the XLMiner Analysis ToolPak by Frontline Systems and clicking Allow, users can access XLMiner’s features by clicking on the Add-ons menu and selecting XLMiner ToolPak.
Key Features of XLMiner:
Advanced Data Analysis: Perform regression analysis, clustering, time series forecasting, and other sophisticated data analysis techniques.
Excel Data Analysis Toolpak Functionality: Access powerful data analysis tools similar to those found in the Excel Data Analysis Toolpak.
Statistical Tests: Conduct a variety of statistical tests, such as T-tests for samples assuming unequal variances, to gain deeper insights from your data.
Time Series Forecasting: Predict future trends and make informed decisions based on historical data patterns.
User-Friendly Interface: Enjoy a seamless experience with XLMiner’s intuitive interface, making it accessible to users with varying levels of technical expertise.
Source: ClickUp
ClickUp is a comprehensive project management platform that leverages AI to optimize and enhance the functionality of Google Sheets. By combining ClickUp’s task management features with Google Sheets’ spreadsheet capabilities, users can create powerful automation workflows that streamline their processes and boost productivity.
One of the key benefits of using ClickUp with Google Sheets is the ability to auto-update spreadsheets with new ClickUp tasks, sync statuses, and push time-tracking data into sheets. This eliminates the need for manual data entry and ensures that your spreadsheets are always up-to-date with the latest information from your ClickUp projects.
Key Features of ClickUp for Google Sheets:
ClickUp Brain: Generate templates, complete specific spreadsheet formulas, and summarize spreadsheet data in a structured format for easier trend analysis and decision-making.
Process Simplification: Streamline complex processes and eliminate manual tasks, allowing you to focus on high-level strategic initiatives.
In-Platform Solution: Utilize ClickUp’s Table View to manage databases, inventories, and various information sets without leaving the platform.
Seamless Google Sheets Integration: Combine ClickUp’s task management features with Google Sheets’ spreadsheet capabilities for enhanced automation and productivity.
Collaborative Environment: Foster collaboration among team members by leveraging ClickUp’s project management features alongside Google Sheets.
Source: Formula Bot
Excel Formula Bot is an innovative AI tool designed to help users interact with Google Sheets and Excel. This powerful AI chatbot serves as a GPT copilot tab, making complex formula creation more accessible by converting plain English instructions into formulas. With its ability to support tasks beyond the usual spreadsheet formulas, such as scripts, basic tasks, regex, spreadsheet making, and SQL, Excel Formula Bot is a game-changer for Google Sheet users.
One of the standout features of Excel Formula Bot is its ability to generate SQL queries from user database tables and text instructions. This functionality enables users to extract valuable insights from their data without the need for extensive SQL knowledge. Additionally, the tool can create VBA and Apps Script codes to automate tasks on Google Sheets, saving users time and effort.
Key Features of Excel Formula Bot:
SQL Query Generation: Generate SQL queries from user database tables and text instructions, enabling users to extract insights from their data with ease.
VBA and Apps Script Code Creation: Automate tasks on Google Sheets by creating VBA and Apps Script codes.
Spreadsheet Creation: Create spreadsheets for various situations, such as time and expense trackers.
AI-Powered Data Analysis: Utilize AI to analyze Google Sheets data, create tables or charts, provide answers to queries, and perform specific actions in spreadsheets.
The Power of AI in Google Sheets
The integration of AI tools in Google Sheets has transformed the way businesses and individuals approach data analysis and management. From automating complex tasks and generating valuable insights to streamlining collaboration and decision-making processes, these top AI tools have proven to be game-changers in the world of spreadsheets.
By leveraging these tools, users can unlock new levels of efficiency and productivity, ultimately driving success in their personal and professional endeavors. As AI continues to evolve and shape the future of work, embracing these innovative tools will be key to staying ahead of the curve and achieving excellence in the digital age.
#2024#Accessibility#add-on#ai#AI Chatbot#AI image#AI integration#ai tools#ai-generated content#AI-powered#airtable#Analysis#Analytics#API#app#approach#apps#artificial#Artificial Intelligence#auto-update#automation#Best Of#Blog#bot#Brain#Building#Business#Cells#chart#charts
0 notes
Text
Data Visualization
Data Visualization present complex data in a way it easy to convey an overall message, highlight key insights,and guiding an audience toward a conclusion. In other words, Data Visualization deals with the presentation of complex information effectively. it represents data and information in a graphical manner that is easy to comprehend. Visualizations include charts, graphs, maps, infographics, and other elements. They can assist in decision making process, allocation of funds to various departments etc.,
Benefits:
Effective in converting complex data that it is easy to comprehend and understand.
Generating insights and trends by analyzing big data.
Developing an effective Business strategy.
Risk Management
Use an appropriate chart that is relavent to your presentation viz line chart to display trends, scatter charts to show corelations etc.,
Check out our master program in Data Science and ASP.NET- Complete Beginner to Advanced course and boost your knowledge.
URL: www.edujournal.com
0 notes
Text
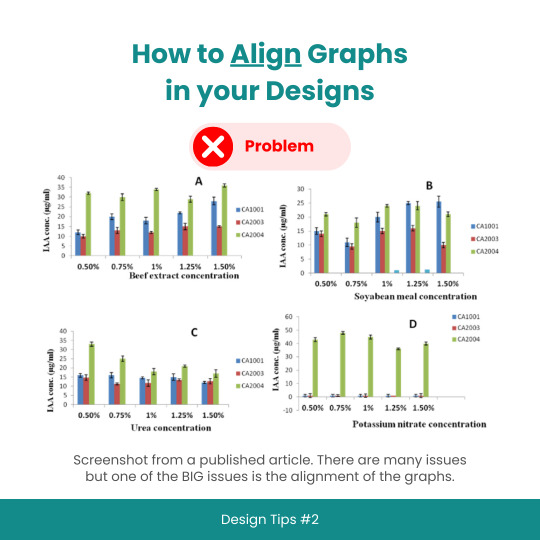
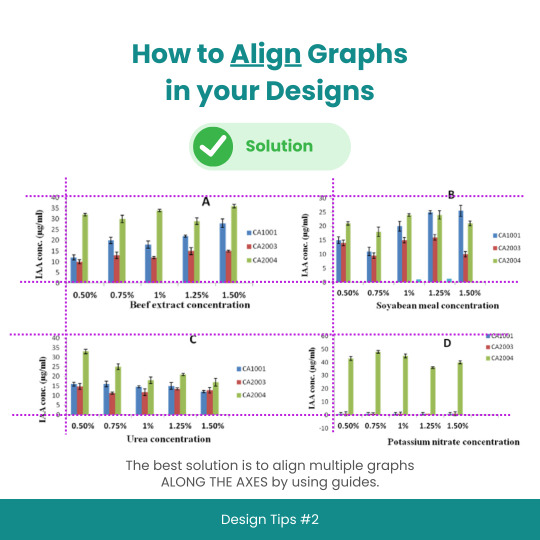
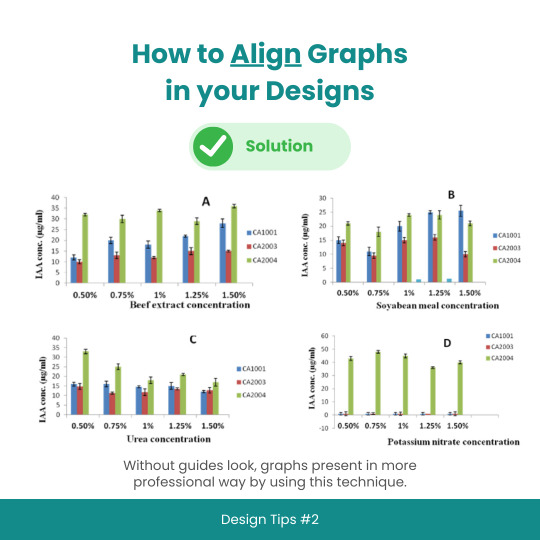
Design Tips #2: How to Align Graphs in your Designs
#designtips#datavisualization#graph#data#statistics#analytics#dataisbeautiful#chart#dashboard#datagram#dataart#infographic#informationisbeautiful#datatellingstories#datadesign#ddj#datasketch#dataviz
3 notes
·
View notes
Text
Tableau: Data visualization with PIE chart
#analyticspro#analytics#dataAnalytics#dataViz#visualization#vizualization#dashboard#bi#businessintelligence#reporting#tableaudashboard#tableau#tableaudeveloper#Tableaudesktop#tableauinterview#tableautips#datavisualization#pie#charts#chart#data#tableautricks#youtube#video#sql
0 notes
Text
youtube
#Stayin Alive in Tech#How to Succeed in Marketing Roles | Melinda Byerley How to Succeed in Marketing Roles with Melinda Byerley
Melinda Byerley is the CEO and#a virtual data-driven consultancy based in San Francisco. A seasoned Silicon Valley veteran#she has led teams at companies like eBay#PayPal#and PlantSense. Melinda is a pioneer in marketing analytics and an influencer in data privacy and ethics.
In 2022#she refocused her career on AI for Marketing Analytics#inspired by her personal triumph over breast cancer. A contributing writer#guest lecturer#and host of the podcast Melinda blends finance acumen with storytelling flair. When not charting the course of marketing's future#she's exploring bridge and snorkeling or engaging with ChatGPT.
marketing AI kajmasterclass#Youtube
0 notes
Text
youtube
With the new Multiple Actions functionality, when creating templates for the HR processes, you can assign action items for filling in forms (lists) with as many records as required. For example, in the HR process for event planning, you can create an action item for filling in the list of participants.
#lanteria#lanteria hr#strategic management#hr analytics#recruitment data#lanteria hr tutorials#multiple actions on hr tutorial#multiple actions#what are hr processes#creating templates for the hr processes#hr chart#recruiting analytics#hr tech factory#applicant tracking system#hr software#hr activities for employees#hr management software#best hr management software#how do you create hr processes#human resources workflow templates 2023#hr templates#Youtube
0 notes
Last Seen Blogs

waterwindow
The Drawings Are Good Sometimes

orotundmutt
Left Alone

scriptxrient
you deserve to be at peace with being alive


welcometocrapvale
Faceless Young Woman