#anova

Text
Just created a bot on character.ai for Anova :3
Character.AI
2 notes
·
View notes
Text
ANOVA Analysis
This is the task of Week 1 of the course Data Analysis Tools at the Coursera Plataform. The challenge is to execute an Analysis of Variance using the ANOVA Statistical Test. This type of analysis assesses whether the means of two or more groups are statistically different from each other. Is used whenever you want to compare the means (quantitative variables) of groups (categorical variables). The null hypothesis is that there is no difference in the mean of the quantitative variable across groups (categorical variable), while the alternative is that there is a difference.
DataSet Used – Gap Minder
Gapminder identifies systematic misconceptions about important global trends and proportions and uses reliable data to develop easy to understand teaching materials to rid people of their misconceptions.
Gapminder is an independent Swedish foundation with no political, religious, or economic affiliations.
should visit it: https://www.gapminder.org/.
The dataset used has 16 variables and 213 rows. I choosed to analyze income per person (incomeperperson) and life expectancy (lifeexpectancy).
And how is the Question?
Is the life expectancy different among four categories of income per person (A,B,C,D,E)?
Since the income per person is a quantitative variable, I transformed it into a categorical variable, using parameters sugested by IBGE to classify the social class of according of income. For the parameters, I analyzed the boxplot posted below.

the data in image is in portuguese, because the IBGE is an Brazilian institute.
The Code
I used the Anaconda to code in Python for this task. The code is posted below.
import numpy
import pandas as pd
import statsmodels.api as sm
import statsmodels.formula.api as smf
import statsmodels.stats.multicomp as multi
import matplotlib.pyplot as plt
import seaborn as sns
import researchpy as rp
import pycountry_convert as pc
df = pd.read_csv('gapminder.csv')
df = df[['lifeexpectancy', 'incomeperperson']]
df['lifeexpectancy'] = df['lifeexpectancy'].apply(pd.to_numeric, errors='coerce')
df['incomeperperson'] = df['incomeperperson'].apply(pd.to_numeric, errors='coerce')
def income_categories(row):
if row["incomeperperson"]>15000:
return "A"
elif row["incomeperperson"]>5000:
return "B"
elif row["incomeperperson"]>3000:
return "C"
elif row["incomeperperson"]>1000:
return "D"
else:
return "E"
df=df[(df['lifeexpectancy']>=1) & (df['lifeexpectancy']<=120) & (df['incomeperperson'] > 0) ]
df["Income_category"]=df.apply(income_categories, axis=1)
df = df[["Income_category","incomeperperson","lifeexpectancy"]].dropna()
df["Income_category"]=df.apply(income_categories, axis=1)
print (rp.summary_cont(df['lifeexpectancy']))
fig1, ax1 = plt.subplots()
df_new = [df[df['Income_category']=='A']['lifeexpectancy'], df[df['Income_category']=='B']['lifeexpectancy'], df[df['Income_category']=='C']['lifeexpectancy'], df[df['Income_category']=='D']['lifeexpectancy'], df[df['Income_category']=='E']['lifeexpectancy']]
ax1.set_title('life expectancy')
ax1.boxplot(df_new)
plt.show()
results = smf.ols('lifeexpectancy ~ C(Income_category)', data=df).fit()
print (results.summary())
print ("Tukey")
mc1 = multi.MultiComparison(df['lifeexpectancy'], df['Income_category'])
print (mc1)
res1 = mc1.tukeyhsd()
print (res1.summary())
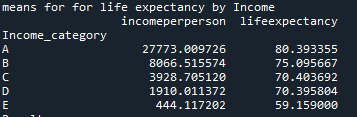
print ('means for for life expectancy by Income')
m1= df.groupby('Income_category').mean()
print (m1)
print ('Results')
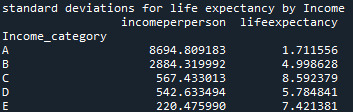
print ('standard deviations for life expectancy by Income')
sd1 = df.groupby('Income_category').std()
print (sd1)
Results – ANOVA Analysis
Aiming to answer the question of the task, I ran a test ANOVA. As shown below, from the 176 rows, 171 were used for the test, i have used a filter to remove some wrong values, as non numeric, negative, etc, reducing the rows of the original dataset

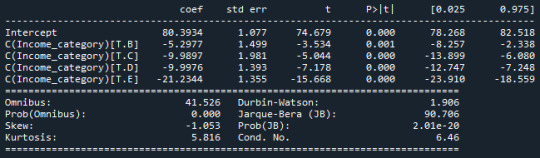
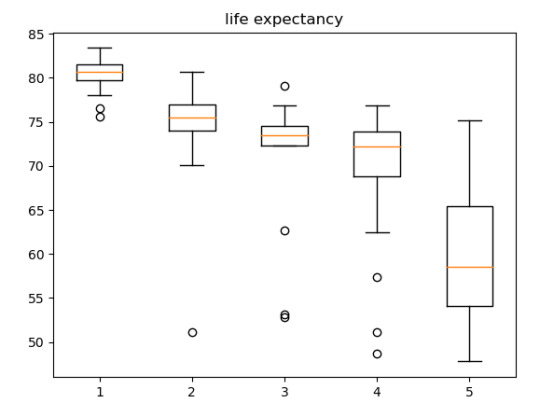
The ANOVA analysis shows a graph for each category (above) and, as we can see, the life expectancy of A class, have the life expectative of 80.39 years while the E class have the life expectative of 59.15 years.
2 notes
·
View notes
Text
Explorando la Relación entre Depresión, Consumo de Alcohol y Ocupación: Un Análisis de Varianza y Prueba F
¡Bienvenidos de nuevo a nuestro blog sobre el alcoholismo y la salud mental!
En esta ocasión, nos sumergiremos en el fascinante mundo del análisis de varianza (ANOVA) y la prueba F. Esta herramienta estadística nos permite explorar si existen diferencias significativas entre las medias de dos o más grupos. En nuestro estudio, nos enfocaremos en la variable "depresión" y en cómo se relaciona con el consumo total anual de alcohol.
La prueba F en este contexto se utiliza para determinar si hay una diferencia significativa entre las medias de dos grupos. En este caso, se estudiará la variable “depresión" la cual tiene dos niveles: True (presencia de depresión) y False (ausencia de depresión).
La hipótesis nula (H0) en la prueba F establece que no hay diferencia significativa entre las medias del consumo total anual para los dos grupos, es decir, que el consumo total anual es el mismo para las personas con y sin depresión.
Por otro lado, la hipótesis alternativa (H1) sugiere que hay al menos una diferencia significativa entre las medias de los grupos.
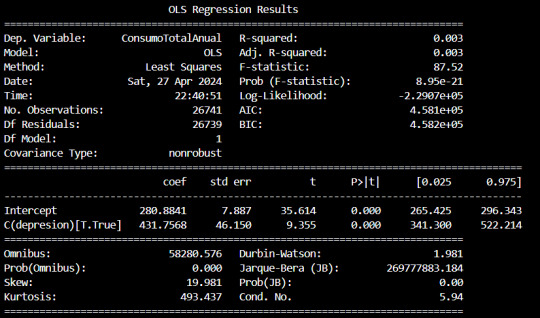
Dado que el valor p asociado con la prueba F es prácticamente cero (0.000), esto indica que hay suficiente evidencia para rechazar la hipótesis nula. Por lo tanto, concluimos que la media del consumo total anual de las personas difiere significativamente según si tienen depresión o no.
Durante la fase de visualización de datos, se observó que el porcentaje de alcoholismo variaba entre el 15% y el 17% para cada categoría ocupacional. Esta primera inspección sugirió inicialmente que podría no haber diferencias estadísticas significativas entre los grupos. Sin embargo, con el fin de verificar esta suposición de manera rigurosa, se optó por llevar a cabo un análisis de varianza (prueba F) para evaluar si existían diferencias estadísticamente significativas en la prevalencia de alcoholismo entre los distintos grupos ocupacionales. Los porcentajes que habíamos observado de alcoholismo por ocupación son:
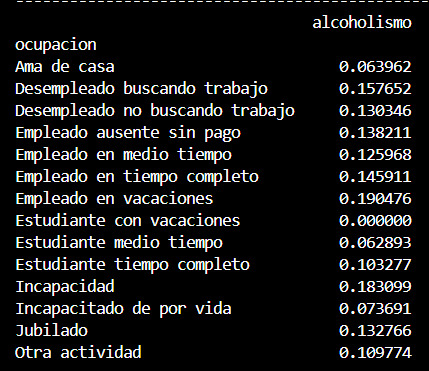
La prueba F se utilizó para determinar si existe una diferencia significativa entre las medias de la variable de respuesta (en este caso, el indicador de alcoholismo) entre los diferentes grupos definidos por la ocupación.
La hipótesis nula (H0) establece que no hay diferencia significativa entre las medias del indicador de alcoholismo para los diferentes grupos ocupacionales.
Mientras que la hipótesis alternativa (H1) sugiere que al menos una diferencia significativa está presente.
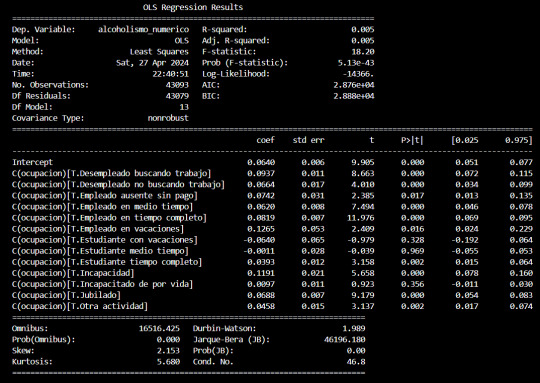
El resultado de la prueba F mostró un valor p de aproximadamente 5.13e-43, lo que indica que este valor es esencialmente cero. Por lo tanto, tenemos evidencia suficiente para rechazar la hipótesis nula y concluir que hay diferencias significativas en el indicador de alcoholismo entre los diferentes grupos ocupacionales.
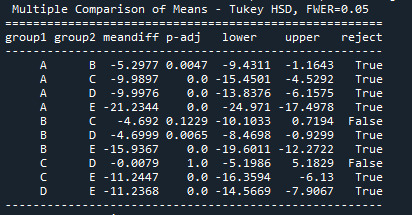
Después de realizar la prueba F y rechazar la hipótesis nula, se llevaron a cabo comparaciones múltiples entre los diferentes grupos ocupacionales para determinar cuáles de ellos presentaban diferencias significativas en cuanto a la prevalencia de alcoholismo.
Las comparaciones múltiples se realizaron utilizando el método de Tukey HSD (Diferencia Significativa Mínima Honestamente). Este método ajusta el valor p para tener en cuenta el error de tipo I acumulado debido a las múltiples comparaciones.
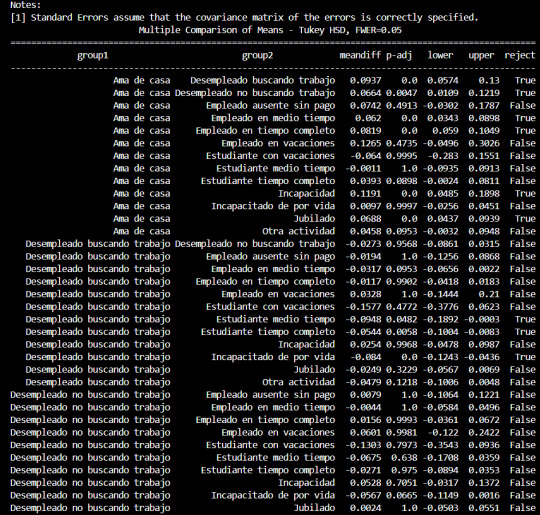
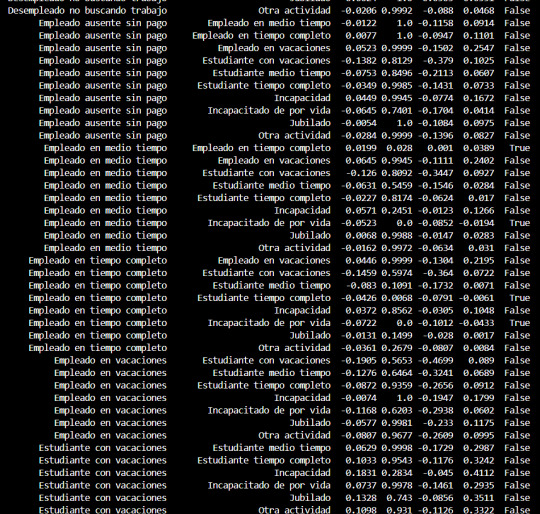
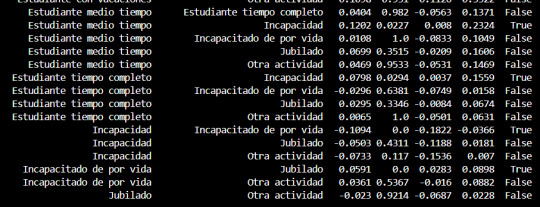
Los resultados de las comparaciones múltiples indicaron que hubo diferencias significativas en la prevalencia de alcoholismo entre varios pares de grupos ocupacionales. Se encontraron diferencias significativas entre ciertos grupos, mientras que otros no mostraron diferencias significativas.
Conclusión:
En conclusión, el análisis de varianza (ANOVA) y la prueba F nos han proporcionado una valiosa perspectiva sobre la relación entre la depresión, el consumo de alcohol y la ocupación. Hemos descubierto que las personas con depresión tienen un consumo total anual de alcohol significativamente diferente en comparación con aquellas sin depresión. Además, al analizar la prevalencia de alcoholismo entre diferentes grupos ocupacionales, encontramos diferencias significativas que nos brindan una comprensión más profunda de cómo el entorno laboral puede influir en los patrones de consumo de alcohol. Este análisis riguroso nos acerca un paso más a comprender los complejos vínculos entre el alcoholismo y la salud mental, lo que potencialmente podría informar estrategias más efectivas de prevención y tratamiento.
Puedes consultar el código y los datos con los que estamos trabajando aquí:
ANOVA.py
datos_nesarc.csv
0 notes
Text
hello math / stat tumblr, does anyone know how ANOVA works and how to conduct post-hoc tests by hand (Bonferroni correction and Tukey's HSD)
im crying my finals is next thursday idk what the fcuk my prof is on about
0 notes
Text

#msb#ssb#tsk#tusaş#kaan#mmu#tfx#tei#tai#aselsan#havelsan#roketsan#tübitak#petlas#stm#stg#alphavacılık#altınay#ander#anova#aspilsan#botek#c2tech#emge#kim#kolt#milpower#portek#taac#voco
0 notes
Link
1 note
·
View note
Text
If the pokemon games keep thanos'ing the national dex. We might end up being able to get every pokemon in plush form, before being able to get them in one of the games.


#im not sure if im happy or upset about this#pokemon plush#pokemon centre#sitting cuties#pokemon#all pokemon#national dex damnit#pokemon games#what are they thinking#can i just have all the pokemon now#kanto#hoenn#jhoto#sinnoh#anova#probably soom karlos#pokedex#eevee#pikachu
1 note
·
View note
Text
Why ANOVA Matters: Exploring its Significance in Data Analysis?
ANOVA, or Analysis of Variance, is a powerful tool used in data analysis. It can help identify the differences between two sets of data and determine which set has more significant variation. ANOVA is widely used in scientific research to test hypotheses about populations and to compare different treatments on samples from those populations.
At its core, ANOVA works by comparing the variance within each group with the variance between groups. If there’s a large difference between these two variances then it suggests that there’s something interesting going on – either an effect due to one group being different from another or even an interaction effect where both groups are contributing something unique together that isn't present when they're examined separately.
In addition to helping researchers draw meaningful conclusions about their studies, ANOVA also helps marketers understand how their customers interact with products and services across various segments like age, gender, location, etc., This information can be incredibly valuable for targeting campaigns as well as optimizing product offerings based on customer preferences so companies can maximize profits while still delivering quality service experiences for everyone involved!
Finally, while many people think that only scientists use ANOVAs - this isn't true! Anyone who wants better insights into their business operations should consider using this type of analysis because it's easy-to-understand yet highly effective at uncovering hidden trends among your customers' behaviors and preferences over time (or even across multiple markets). With just some basic knowledge you'll be able to make more informed decisions quickly - saving you time & money along the way too!
Also Read: Basic Statistics training
All in all - understanding why ANOVA matters will open up new possibilities for businesses looking for better insight into consumer behavior & market trends alike; making it easier than ever before for them to make smart decisions fast without sacrificing accuracy or precision at any step along the way.
0 notes
Text

#ProductPick - Anova Culinary Nano Sous Vide Precision Cooker
The ANOVA Precision Cooker Nano makes it easy to achieve professional-level cooking results at home. To use, simply attach the cooker to any water-filled pot, put your food in a sealable bag, and set the time and temperature.
0 notes
Text
Anova Precision Cooker good cooking

In the ever-evolving landscape of kitchen appliances, the Anova Precision Cooker has established itself as a game-changer for home cooks and culinary enthusiasts alike. Harnessing the power of sous vide technology, the Anova Precision Cooker promises to elevate your cooking experience to new heights of precision and flavor. This comprehensive review will delve into the intricacies of this remarkable kitchen companion, shedding light on its features, performance, user-friendliness, maintenance, and more. By the end, you'll have a clear understanding of why the Anova Precision Cooker has garnered a devoted following and why it deserves a prime spot in your culinary arsenal.
Product Overview
The Anova Precision Cooker is a revolutionary kitchen appliance that brings the art of sous vide cooking into the comfort of your home. Designed with meticulous attention to detail, this immersion circulator is a versatile tool that ensures your dishes are cooked to perfection every time. Its compact size and user-friendly interface make it an attractive choice for both amateur cooks and seasoned chefs. By allowing precise temperature control and constant water circulation, the Anova Precision Cooker promises to transform your ingredients into exquisite creations that tantalize the palate.
Key Features
Precise Temperature Control: One of the standout features of the Anova Precision Cooker is its unparalleled temperature accuracy. With the ability to maintain water temperatures within fractions of a degree, this immersion circulator enables you to achieve consistently flawless results. Whether you're aiming for a medium-rare steak or custard with the ideal texture, the Anova Precision Cooker ensures that your culinary creations are cooked to perfection.
Wi-Fi Connectivity: Embracing the convenience of modern technology, the Anova Precision Cooker comes equipped with Wi-Fi connectivity. This feature empowers you to control and monitor your cooking sessions remotely through a dedicated app. Imagine starting your sous vide cooking while you're still at work, ensuring that your meal is ready to be enjoyed as soon as you step through the door. The seamless integration of Wi-Fi connectivity into the cooking process adds an element of convenience that aligns perfectly with our fast-paced lifestyles.
User-Friendly Interface: Navigating the world of sous vide cooking has never been easier, thanks to the intuitive user interface of the Anova Precision Cooker. The clear digital display provides at-a-glance information about the cooking temperature and time, eliminating any guesswork from the equation. The device's ergonomic design ensures comfortable handling, and the straightforward controls allow you to focus on crafting delectable dishes without the hassle of complex settings.
Versatile Cooking Options: The Anova Precision Cooker is a versatile companion that caters to a wide array of cooking preferences. Whether you're a steak enthusiast, a vegetable aficionado, or someone with a sweet tooth, this immersion circulator has you covered. The precise temperature control opens doors to experimentation, enabling you to explore a diverse range of recipes that cater to your cravings and dietary requirements.
High-Quality Construction: Crafted with durability in mind, the Anova Precision Cooker boasts a high-quality construction that stands up to the rigors of regular use. The stainless steel body not only exudes a sense of sophistication but also ensures longevity, making it a wise investment for culinary enthusiasts seeking a reliable sous vide companion for years to come.
Performance and Cooking Results
Transitioning from traditional cooking methods to sous vide can be a culinary revelation, and the Anova Precision Cooker plays a pivotal role in making this transition seamless. The precision offered by this immersion circulator translates into consistently impressive cooking results that are bound to leave you astounded.
The ability to set and maintain the exact cooking temperature eliminates the risk of overcooking or undercooking your dishes. Whether you're aiming to achieve a tender and juicy medium-rare steak or a velvety custard, the Anova Precision Cooker ensures that your culinary aspirations are met with unwavering precision. The precise temperature control is especially notable when dealing with delicate ingredients that demand finesse, such as fish fillets or poached eggs. With the Anova Precision Cooker, these once-challenging dishes become a breeze, allowing you to impress yourself and your guests with flawless execution.
Furthermore, the even and consistent water circulation ensures that your food is cooked uniformly. Gone are the days of fretting over unevenly cooked portions or uneven textures. The immersion circulator's gentle water movement envelops your ingredients, promoting even heat distribution and resulting in dishes that are remarkably consistent from edge to edge. This is particularly advantageous when cooking large cuts of meat or dishes where uniformity is paramount.
Ease of Use
Transitioning to a new cooking technique can be intimidating, but the Anova Precision Cooker goes above and beyond to simplify the sous vide process, making it accessible to cooks of all skill levels. From the moment you unbox the device, it's clear that user-friendliness was a top priority in its design.
The device's intuitive interface takes the guesswork out of setting up your cooking parameters. The digital display presents temperature and timer information in a clear and concise manner, allowing you to make adjustments with ease. The responsive buttons provide tactile feedback, ensuring that you can confidently make changes even while your hands are busy prepping ingredients. Whether you're a tech-savvy individual or someone who prefers a more straightforward approach, the Anova Precision Cooker strikes a harmonious balance that caters to your comfort level.
Maintenance and Cleaning
After creating a culinary masterpiece, the last thing you want is to spend an excessive amount of time on cleanup. Recognizing this, the Anova Precision Cooker's design takes the hassle out of maintenance and cleaning. The stainless steel body not only adds a touch of elegance to your kitchen but also simplifies the wiping down of any splatters or spills.
The detachable stainless steel skirt and disk guard are easily removable, allowing for quick access to the components that might come into contact with food. This accessibility is crucial for thorough cleaning and preventing the buildup of residue over time. Additionally, the device's water-resistant construction means that you can confidently rinse off any accidental spills or splashes without worrying about damaging its internal components. The thoughtful design extends to the storage of the device as well. Its compact size ensures that it doesn't take up much space in your kitchen cabinets, and its sleek appearance means you won't mind leaving it on display as a testament to your culinary prowess.
Comparison with Other Sous Vide Cookers
In a market saturated with kitchen appliances claiming to offer sous vide capabilities, the Anova Precision Cooker sets itself apart through its combination of features, performance, and user-friendly design. While there are other immersion circulators available, the Anova Precision Cooker manages to strike a delicate balance that appeals to both beginners and seasoned culinary aficionados.
Compared to some alternatives, the Anova Precision Cooker boasts superior temperature accuracy, which is essential for achieving consistent results. The Wi-Fi connectivity further adds a layer of convenience that many other models lack. The ability to control and monitor your cooking sessions remotely elevates the cooking experience, allowing you to multitask or prepare for a meal while still being actively engaged in the cooking process.
When examining its construction, the Anova Precision Cooker shines with its stainless steel body, which not only lends durability but also contributes to its sleek aesthetic. Many other sous vide cookers compromise on build quality, resulting in devices that might not withstand the test of time. Additionally, the intuitive user interface and ergonomic design of the Anova Precision Cooker make it a joy to use, even for those who might be new to sous vide cooking.
Customer Feedback
The Anova Precision Cooker has garnered praise from a diverse range of users, all of whom have experienced firsthand the transformative power of sous vide cooking with this exceptional immersion circulator. Users consistently applaud the device's precision, noting that it has elevated their culinary endeavors to unprecedented levels. Achieving restaurant-quality results at home has never been easier, and the Anova Precision Cooker is often credited with making this possible.
The Wi-Fi connectivity feature is frequently highlighted as a game-changer, allowing users to integrate sous vide cooking seamlessly into their daily routines. Whether it's starting a meal remotely or ensuring that dishes are perfectly cooked upon returning home, the convenience offered by this feature has left an indelible mark on users' cooking experiences.
Additionally, the device's user-friendly interface has received praise for its simplicity and intuitiveness. Even individuals who were initially hesitant to embrace sous vide cooking have found themselves comfortably navigating the Anova Precision Cooker's controls, ultimately leading to their successful exploration of new recipes and culinary techniques.
Conclusion
Embarking on a culinary journey with the Anova Precision Cooker at your side is akin to having a personal sous chef dedicated to perfection. This immersion circulator marries advanced technology with a user-friendly design, resulting in an appliance that's not only practical but also empowering. The precise temperature control, Wi-Fi connectivity, and intuitive interface work harmoniously to provide an unparalleled cooking experience.
From sumptuously tender steaks to flawlessly poached eggs, the Anova Precision Cooker delivers results that are nothing short of extraordinary. The device's meticulous construction and thoughtful design extend beyond the kitchen, creating a seamless blend of functionality and aesthetics. As you delve into the world of sous vide cooking with the Anova Precision Cooker, you'll find yourself not only mastering a new culinary technique but also unlocking a world of flavors and possibilities that were previously unattainable.
Anova Precision Cooker
0 notes
Text
Data Analysis Tools - week 1 - Run an analysis of variance.
My variance analysis was the relation between the years os study and the monthly salary
I uploaded a .csv file with some data.

The null hypothesis (Ho) was: "There is no significant difference in monthly salary based on education level.
Since the result for ANOVA test was F value = 92,78 and p-Value < 0,0001. There is statistical evidence to reject the null hypothesis

I can conclude that there is a correlation between education and Salary.
I checked with a Post hoc comparison test the relation between education levels and we can conclude that some groups of education ca be related

for example, the Salary from 9 to 16 years of study have similar means
1 note
·
View note
Text
Watch "précision cooker in action!" on YouTube
0 notes
Link
Perlu Anda ketahui bahwa Anova dua arah itu membandingkan perbedaan antara kelompok yang sudah dibagi menjadi dua variabel independen yang setelah itu baru disebut faktor. Selain itu juga Anda pun memerlukan dua variabel independen dengan skala data kategori serta satu variabel terikat berskala data kuantitif. Bagi yang belum tahu Anova / Anava ini adalah sebuah singkatan dari Analysis of Varian yang dimana hal tersebut salah satu uji komparatif yang memang telah digunakan untuk menguji perbedaan mean atau rata – rata data lebih dari dua kelompok.
0 notes
Text
Running an ANOVA with Post Hoc
With the nesarc-dataset and by using the method “Analysis of Variance” “ANOVA“ it is possible to conclude several hypotheses between a categorical explanatory variable (as for example the state an american citizen is living in) and a quantative response value (as for example the numbers of cigarettes smoked a week).
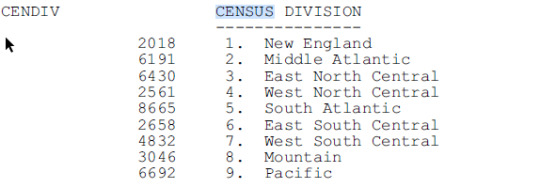
For doing this, we first set our null hypothesis, in my case I assume that there is no difference in the numbers of beers consumed in excessive beer drinking in one sitting (5+ beers in one sitting) for the categorical variable as “Census division” where the test persons are originated.
Meaning if the null hypothesis Ho is true, the means of excessive beer drinking quantities per census division should be the same for all 9 divisions.

Ho = µ1 = µ2= µ3= µ4= µ5= µ6= µ7= µ8= µ9
The alternative hypothesis resulting out of it is:
Ha = not all means are equal.
For performing the test I used the Data Analytics tool “SAS” and the nesarc dataset.
At first, I include the dataset and import the used variables for this test.

I defined the labels of thes used variables and explain what kind of data from the nesarc base should be used running the test.
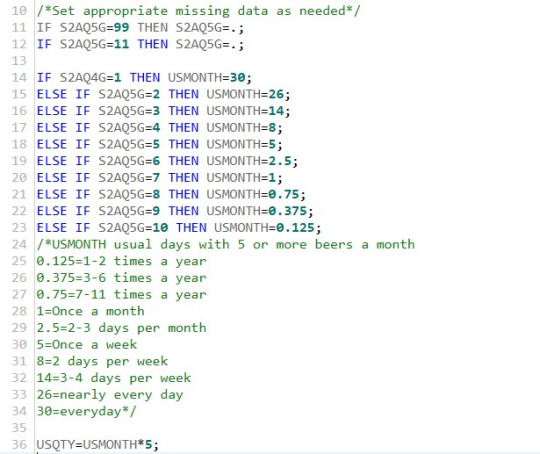
To get a meaningful quantative responsible variable, I include the number of days with excessive beer drinking (min. 5 a day), calculate a value for the monthly use and multiply it with the minimum amount of beers in those sittings to get the variable USQTY (usual quantity)
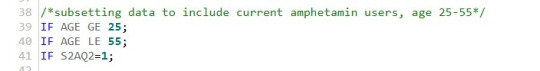
Then I only include data of interest in filtering for middle aged people (25 to 55 years old) who at least once drank beer in the last year.
Finally the data is sorted by ID-number of the nesarc participants and the ANOVA itself is run.
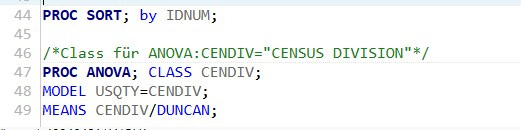
I also included the “Duncan's new multiple range test” as unction of the SAS tool to perform a post hoc test on the results of the ANOVA.
This shows if there really are significant differences in the means of more than two categorical variables and therefore shows, if the results of the ANOVA are valid for the used test case.
The Results are the following:
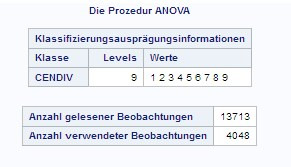
The 9 different CENDIVS with values 1 to 9 were used as categorical explanatory values.
With the included data, 13713 arguments were looked at, while 4048 match the criteria and were used for the test.
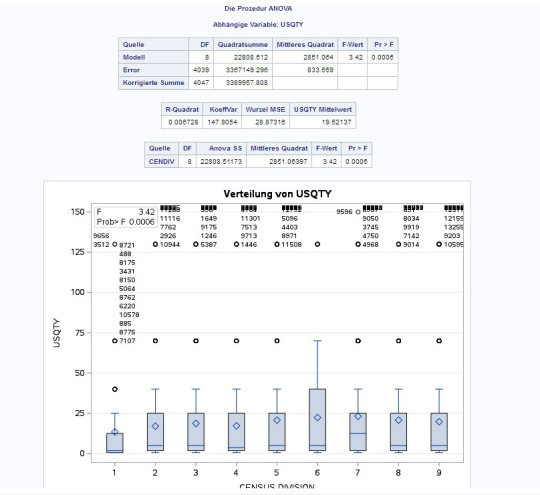
The test results in an F-statistic value of 3.42 and a p-value of 0,0006.
It is way lower than our alpha value of 5%.
Therefore we can reject the null hypothesis and accept the alternative hypothesis: Not all means are equal.
The Duncan Post Hoc treatment also shows the same:
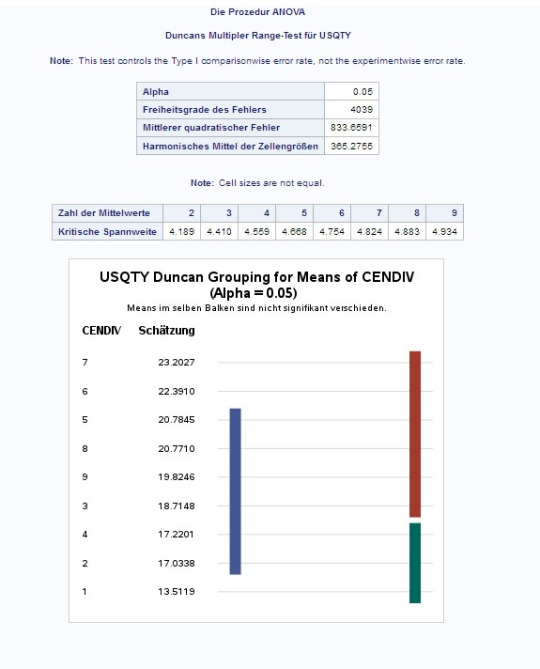
There are three different groups of means that are not significantly different to another, but to the other groups.
This tells us, that it is true to reject the null hypothesis and protects us against type 1 errors (rejecting the null hypothesis, although it is true).
1 note
·
View note
Photo
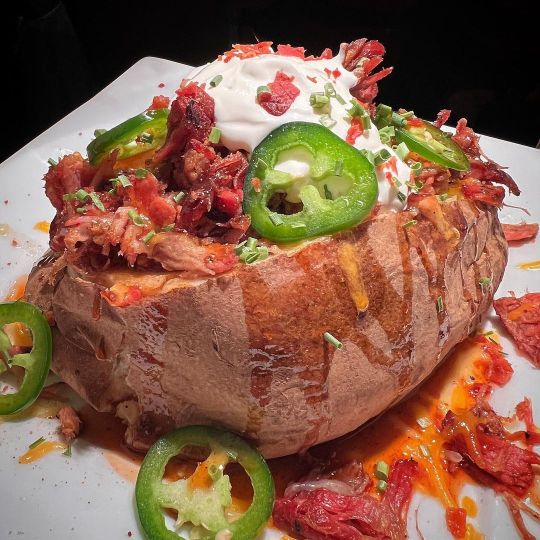
Pork loaded tater! Tonight’s installment of pork week is a giant baked potato loaded with pulled pork, garlic butter, sour cream, triple cheddar cheese, bacon, jalapeño, chives, @meatchurch Honey Bacon BBQ and @killerhogsbbq BBQ sauce. Woah nelly! #porkweek #pulledpork #bacon #loadedbakedpotato #pork #sourcream #chives #jalapeno #garlicbutter #sousvide #ozarkbeercompany #anova (at Springfield, Missouri) https://www.instagram.com/p/CnqV4AgucKu/?igshid=NGJjMDIxMWI=
#porkweek#pulledpork#bacon#loadedbakedpotato#pork#sourcream#chives#jalapeno#garlicbutter#sousvide#ozarkbeercompany#anova
0 notes
Last Seen Blogs

miami34dalk
Untitled

bloodysparklez
caramelldansen enthusiast

candid-2017
candid 2017

bunniii-ylr
Hehe...Tall Woman...

weblogpunch
WEBLOG PUNCH